Introduction
The Florida environmental horticulture industry, also known as green industry, is comprised of wholesale nursery, greenhouse, and turfgrass sod producers, landscape design, construction, and maintenance firms, and wholesale and retail distribution firms consisting of garden centers, home stores, mass merchandisers (with lawn/garden departments), brokers and re-wholesale distribution centers, and allied trades suppliers of input to the industry. It is imperative that this information be used by industry stakeholders in communicating the relevance and economic impact of the Florida green industry.
This report summarizes production and marketing practices and trade flows for the Florida ornamental plant grower and dealer firms for 2018. The Green Industry Research Consortium published a paper in 2020, “Economic Contributions of the Green Industry in the United States in 2018,” a national representation of the green industry’s economic impact. The data was identified using the North American Industry Classification System (NAICS) and generated from the Impact Analysis for Planning (IMPLAN) database and other methodologically sound databases. The IMPLAN modeling system was used to establish final demand economic multipliers and estimate the total economic activity generated from in-state sales and export sales. The results are described as economic impact, although it is understood that these values represent dynamic activity in the industry rather than net change in economic activity (Watson et al. 2007).
Nationally, Florida ranks second only to California, with total direct economic contributions estimated at $29,888 million. Regionally, Florida is ranked number 1 in the Southeast region.
The industry groups described in this report are separated first into the wholesale trade and retail sector. Secondly, this report breaks out the industry sectors of greenhouse and nursery production, lawn/garden equipment manufacturing, wholesalers (farm, garden equipment, nursery, and florist), lawn/garden equipment and supplies stores, florists, and landscape architecture and services. Lastly, this report includes an appendix of technical terminology used throughout the report.
Summary of Economic Contributions by Industry Sector
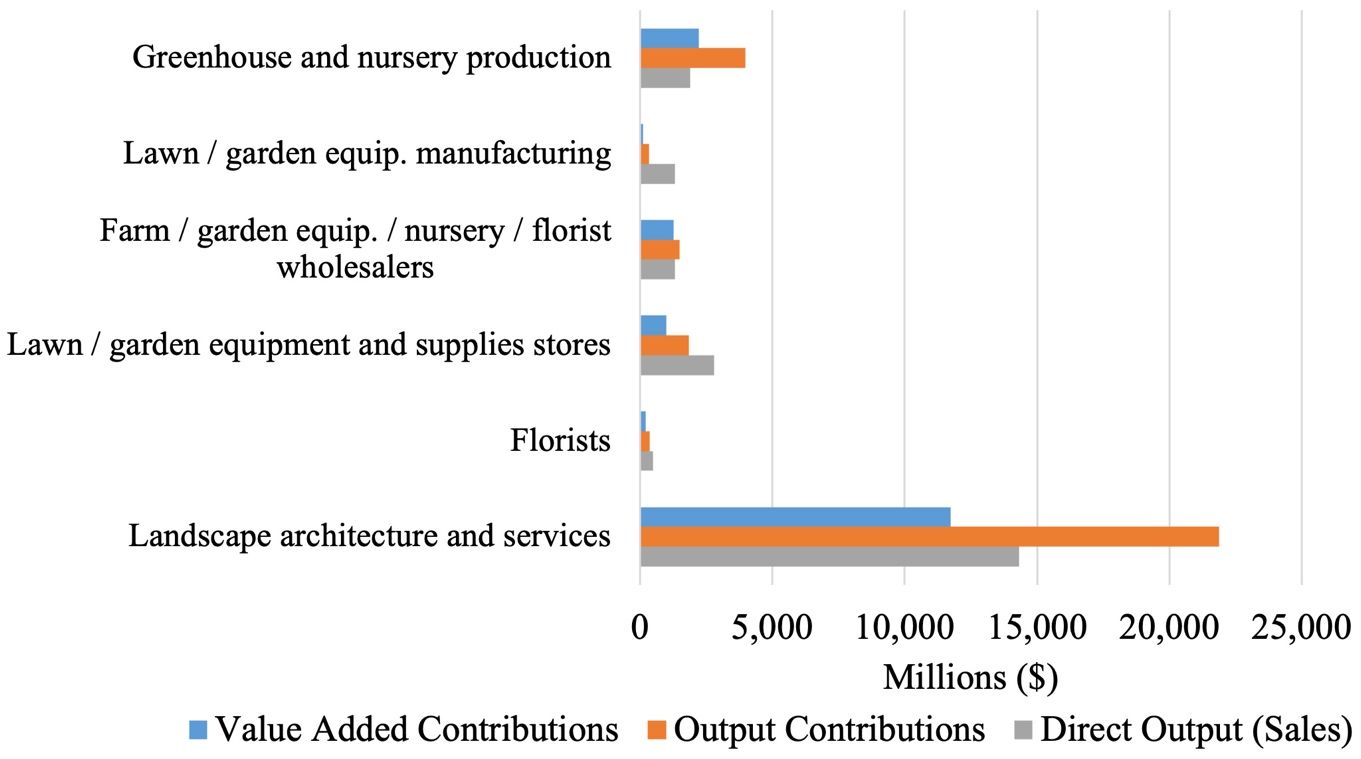
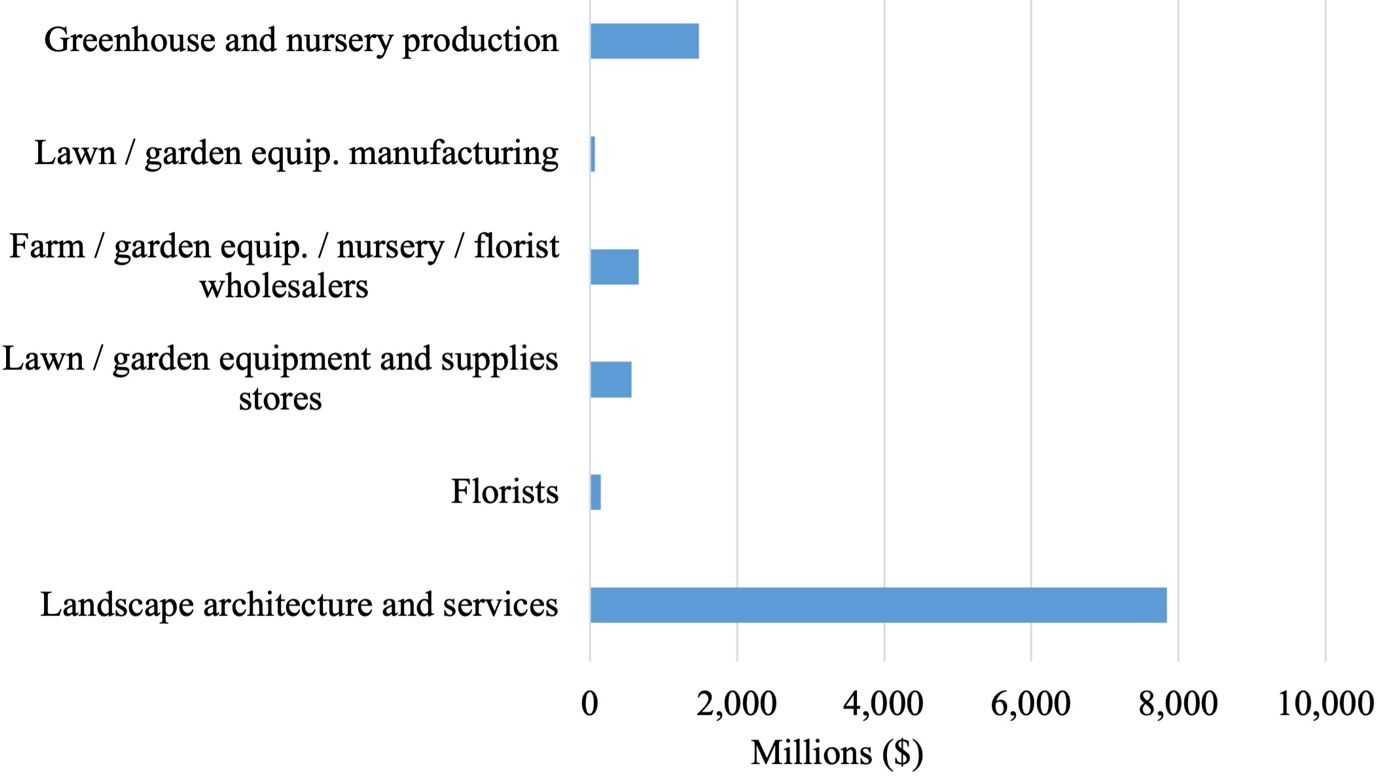
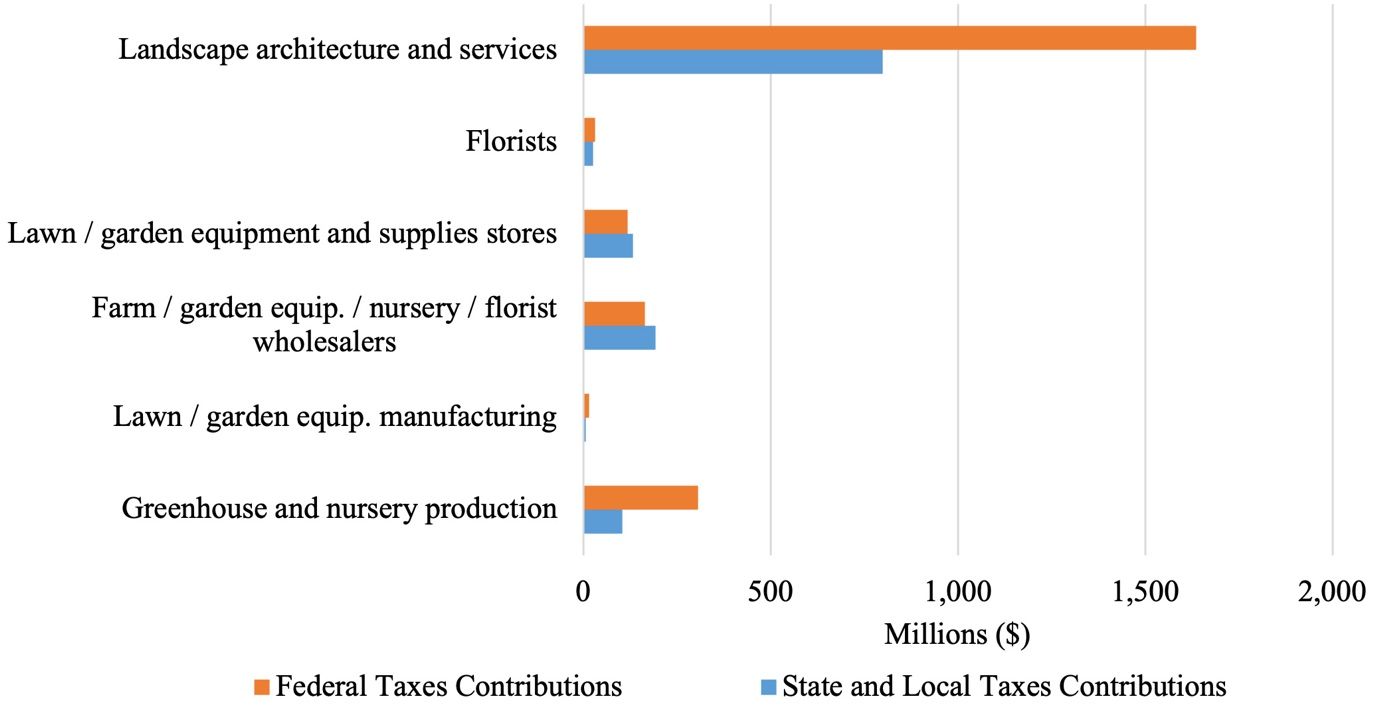
The estimated total economic contributions of the Florida green industry in 2018 are summarized by industry groups and sectors on Table 1 and Figures 1–3. The total output contribution, including indirect and induced regional economic multiplier effects of exports, was $29,888 million (Mn). Direct employment by green industry firms accounts for 121,725 full- and part-time jobs, and the total employment contributions (incorporating multiplier effects) in the broader economy were 203,482 jobs. The labor income contribution, representing employee compensation, benefits, and business owner income, was $10,768 Mn. The total value added, or GDP contribution consisting of sum of total income and indirect business taxes, was $16,550 Mn. Direct industry output, or sales revenue, for all sectors was $22,126 Mn. The contributions in business taxes on sales, property, payroll, excise, motor vehicle, fuels, etc., that were paid to state and federal taxes were $1,259 Mn and $2,270 Mn, respectively.
By far, the largest individual sector was landscape architecture and services, which contributed $14,308 Mn in direct sales output, $14,308 Mn in total output, 80,572 jobs, and $11,739 Mn in GDP value added contributions (Table 1, Figures 1–3).
The next largest sector was greenhouse and nursery production with $1,886 Mn in direct sales output, $3,978 Mn in total sales, 21,509 jobs, and $2,211 Mn in GDP value added contributions. Farm/garden equipment/nursery/florist wholesalers contributed $1,318 Mn in direct sales output, $1,499 Mn in total sales output, 9,499 jobs, and $1,269 Mn in GDP value added. The larger retail, lawn/garden equipment, and supplies stores accounted for $2,800 Mn in direct sales output, $1,848 Mn in total sales contributions, 6,633 jobs, and $1,003 Mn in GDP value added. Florist supply accounted for $493 Mn in direct sales output, $359 Mn in total sales output, 3,278 jobs, and $217 Mn in GDP value added. Lastly, lawn/garden equipment manufacturing accounted for $1,322 Mn in direct sales output, $329 Mn in total sales output, 234 jobs, and $112 Mn in GDP value added.
Table 1. Summary of Florida green industry economic contributions by industry sector in 2018.
Credit: UF/IFAS
Credit: UF/IFAS
Credit: UF/IFAS
Summary of Economic Contributions by Wholesale and Retail Firms in 2018
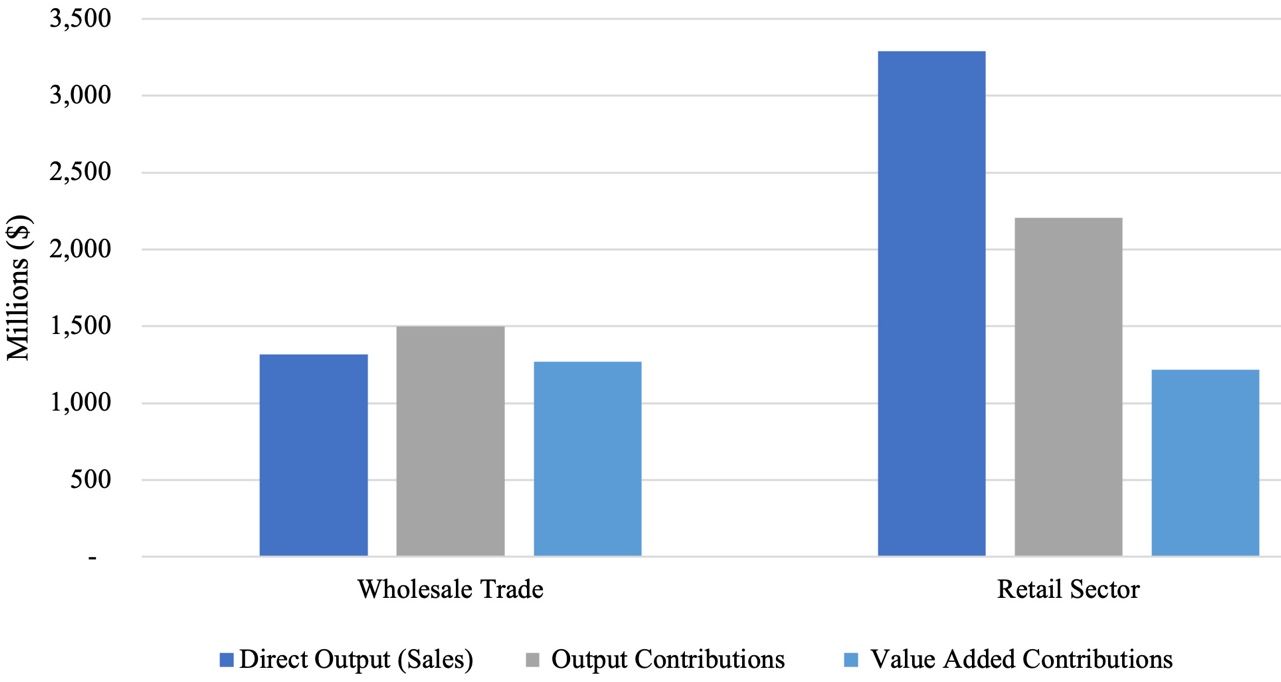
Dividing the Florida green firms into wholesaling and retailing groups, wholesalers would be considered farm/garden equipment/nursery/florist wholesalers (NAICS 42382, 42493) (Figure 4). Retailing firms consist of lawn/garden equipment and supplies stores (NAICS 4442) and florists (NAICS 4531). Wholesaling firms contribute $1,499 Mn in total sales contributions, $1,318 Mn in direct sales output, and $1,269 Mn in GDP value added contributions. Retailing firms contribute $2,207 Mn in total output contributions, $3,292 Mn in direct output contributions, and $1,219 Mn in GDP value added contributions.
Credit: UF/IFAS
Employment Contributions
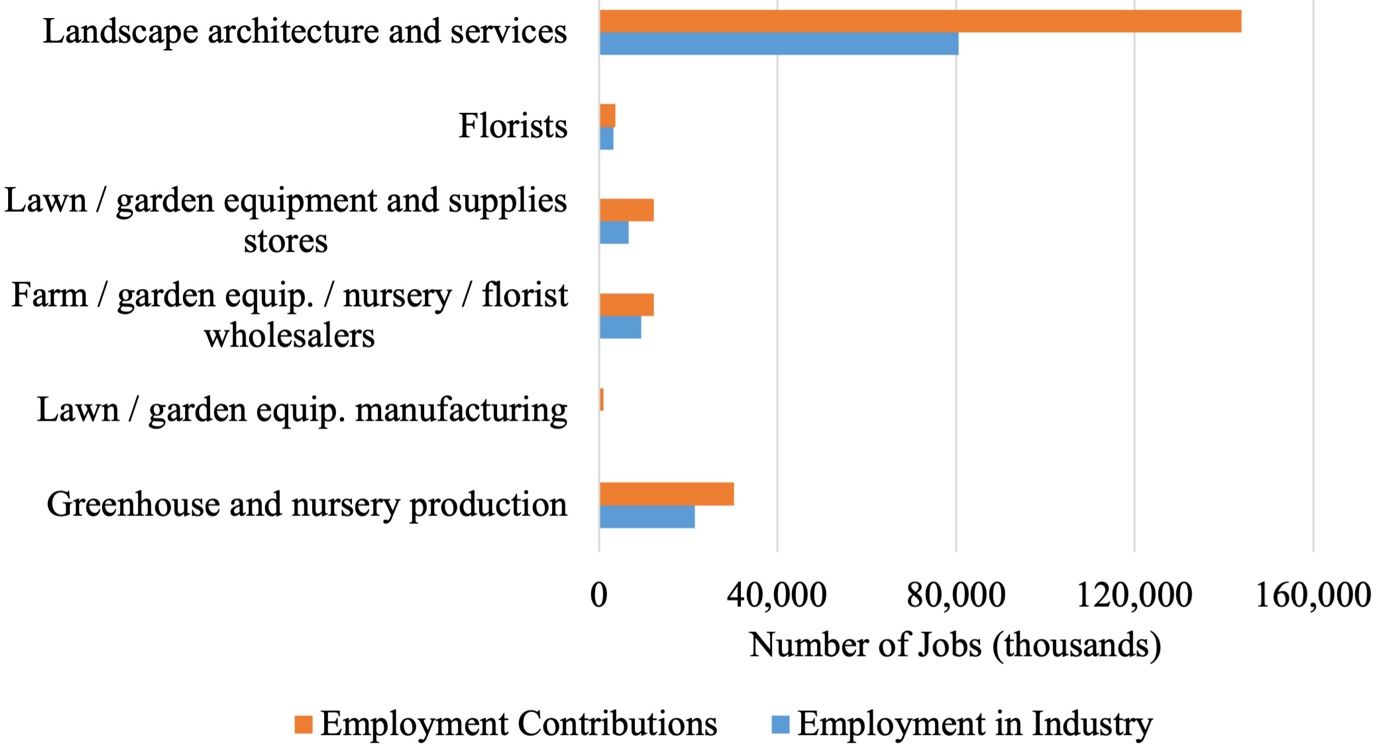
Comparing the employment reported and the employment contribution by Florida green industry firms in 2018, the largest sector, landscape architecture and services, contributed 80,572 in direct employment but contributed to 143,997 jobs in total employment contributions in the entire industry (Figure 5). Greenhouse and nursery production firms contributed 21,509 in direct jobs but contributed to 30,169 jobs in total employment contributions. Wholesalers (farm, garden equipment, nursery, and florist) directly employed 9,499 individuals but contributed to 12,236 total jobs in the industry. Lawn/garden equipment and supplies stores contributed 6,633 jobs in direct employment but contributed to 12,349 jobs in total industry contributions. Florists contributed 3,278 in direct employment but 3,719 in total industry employment. Lastly, lawn/garden equipment manufacturing contributed to 234 direct jobs and 1,013 in total employment in the industry.
Credit: UF/IFAS
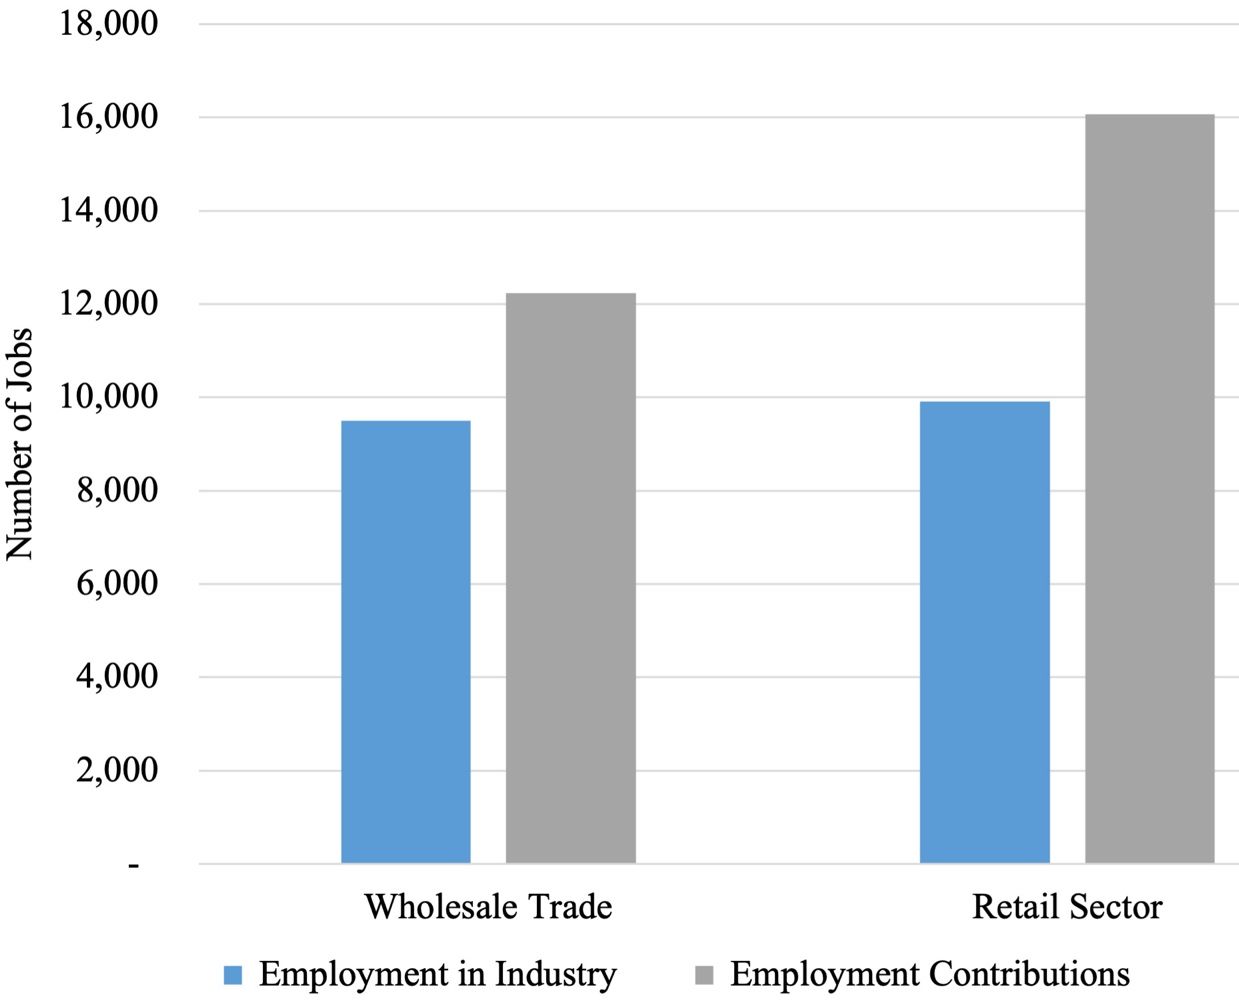
Evaluating the employment contributions in 2018 by wholesale and retail firms, wholesalers employed 9,499 employees but contributed to 12,236 jobs in the industry (Figure 6). Retailers employed 9,911 but contributed to 16,068 jobs in the industry.
Credit: UF/IFAS
Labor Contributions
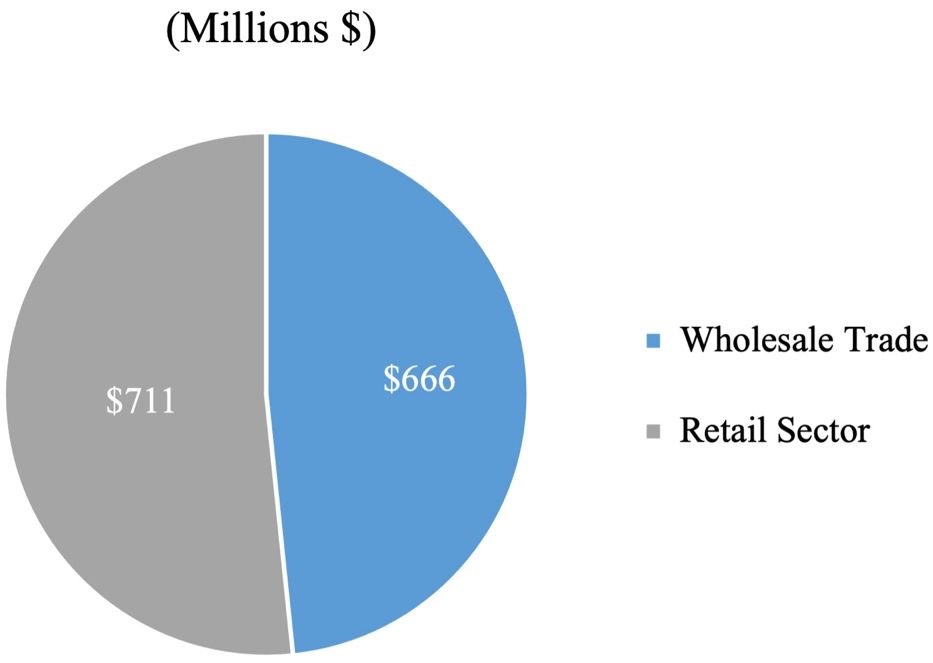
Assessing labor income contributions in 2018 by wholesale and retail groups, retail firms (consisting of lawn/garden equipment and supplies stores and florists) dispensed $711 Mn in contributed labor income (Figure 7). Wholesalers (i.e., farm, garden equipment, nursery, and floral) contributed $666 Mn in labor income in 2018.
Credit: UF/IFAS
Federal and State Tax Contributions
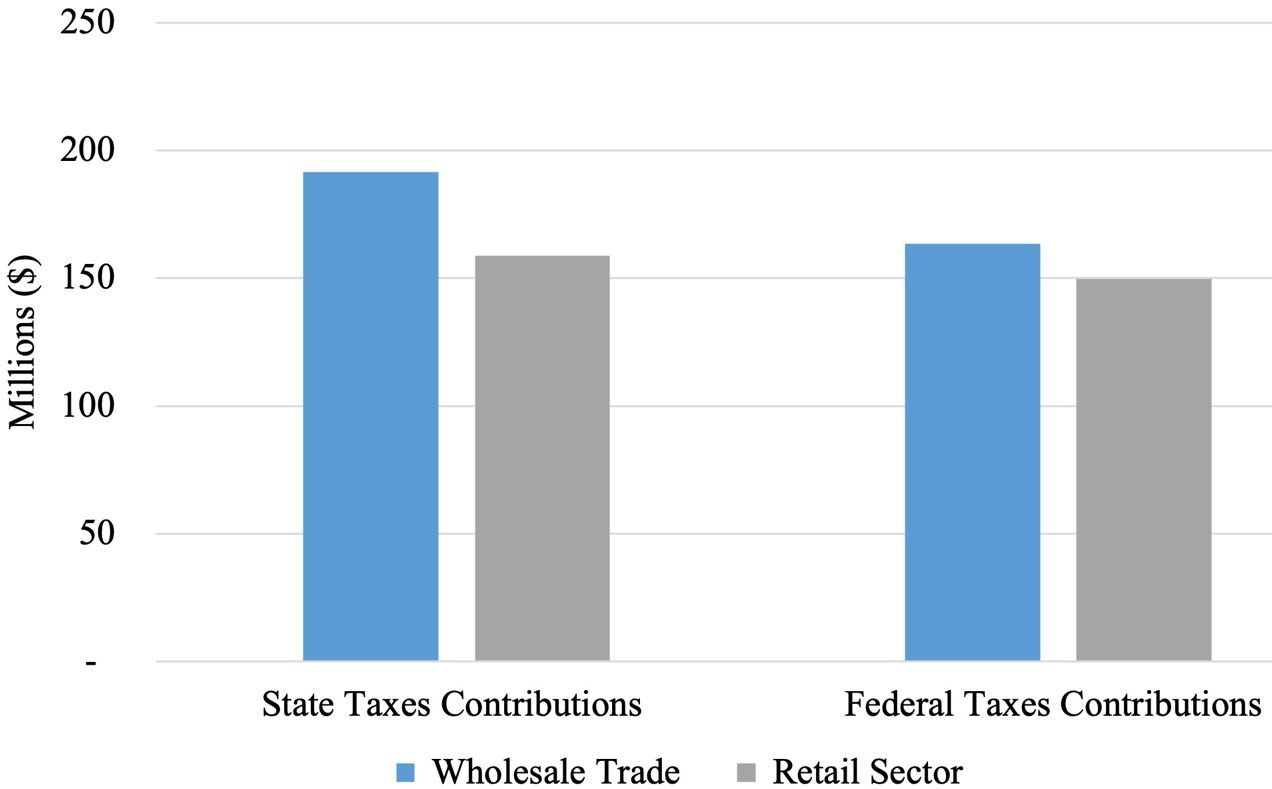
Lastly, 2018 federal and Florida state and local tax contributions by wholesale and retail groups were evaluated (Figure 8). Wholesaler firms contributed $192 Mn in state tax contributions. They also contributed $164 Mn in federal tax contributions. Retail firms contributed slightly less, with $159 Mn in state tax and $150 Mn in federal tax contributions.
Credit: UF/IFAS
References
IMPLAN Group, LLC. 2018. IMPLAN Impact Analysis and Social Accounting software, and U.S. State and County Data Package for 2018, release 3, June 2018. Huntersville, NC.
Watson, P., J. Wilson, D. Thilmany, and S. Winter. 2007. “Determining Economic Contributions and Impacts: What is the difference and why do we care?” Journal of Regional Analysis and Policy 37(2): 140–146.
Appendix: Glossary of Economic Impact Terms
Contributions are the gross changes in a region’s economy that can be attributed to a given industry, event, or policy.
Direct effects/impacts represent the revenues, value added, income, or jobs that result directly from an economic activity within a regional economy.
Employee compensation is comprised of wages, salaries, commissions, and benefits such as health and life insurance, retirement, and other forms of cash or non-cash compensation.
Employment is a measure of the number of jobs involved, including full-time, part-time, and seasonal positions. It is not a measure of full-time equivalents.
Exports are sales of goods to customers outside the producing region, which represent a net inflow of money to the region. This also applies to sales of services to customers visiting from other regions.
Final Demand represents sales to final consumers, including households and governments, and exports from the region.
Gross Regional Product is a measure of total economic activity in a region, or total income generated by all goods and services. It represents the sum of total value added by all industries in that region, and is equivalent to Gross Domestic Product for the nation.
IMPLAN is a computer-based input-output modeling system that enables users to create regional economic models and multipliers for any region consisting of one or more counties or states in the United States.
Impact or total impact is the change in total regional economic activity (e.g., output or employment) resulting from a change in final demand, direct industry output, or direct employment, estimated based on regional economic multipliers.
Imports are purchases of goods and services originating outside the region of analysis.
Income is the money earned within the region from production and sales. Total income includes labor income such as wages, salaries, employee benefits, and business proprietor income, plus other property income.
Indirect effects or impacts occur when businesses use revenues originating from outside the region or study area to purchase inputs (goods and services) from local suppliers. This secondary or indirect business generates additional revenues, income, jobs, and taxes for the area economy.
Induced effects or impacts occur when new dollars, originating from outside the study area, are introduced into the local economy. Induced economic impacts occur as the households of business owners and employees spend their earnings from these enterprises to purchase consumer goods and services from other businesses within the region. This induced effect generates additional revenues, income, jobs, and taxes for the area economy.
Indirect business taxes are taxes paid to governments by individuals or businesses for property, excise, and sales taxes. These do not include income taxes.
Input-Output (I-O) model and Social Accounting Matrix (SAM) is a representation of the transactions between industry sectors within a region that captures what each sector purchases from every other sector in order to produce its output of goods or services. Using such a model, flows of economic activity associated with any change in spending may be traced backwards through the supply chain.
Intermediate sales are sales to other industrial sectors. The value of intermediate sales is netted-out of total value added.
Labor income refers to all forms of employment compensation, including employee wages and salaries, and proprietor income or profits.
Local revenues/expenditures represent simple transfers between individuals or businesses within a regional economy. These transactions do not generate economic spin-off or multiplier (indirect and induced) effects.
Margins represent the portion of the purchaser price accruing to the retailer, wholesaler, and producer/manufacturer in the supply chain. Typically, only the retail margins of many goods purchased by consumers accrue to the local region because the wholesaler, shipper, and manufacturer often lie outside the local area.
Multipliers capture the total effects, both direct and secondary, in a given region, generally as a ratio of the total change in economic activity in the region relative to the direct change. Multipliers are derived from an I-O model of the regional economy. Multipliers may be expressed as ratios of sales, income, or employment, or as ratios of total income or employment changes relative to direct sales. Multipliers express the degree of interdependency between sectors in a region's economy and therefore vary considerably across regions and sectors.
- A sector-specific multiplier gives the total changes to the economy associated with a unit change in output or employment in a given sector (i.e., the direct economic effect) being evaluated.
- Indirect effects multipliers represent the changes in sales, income, or employment within the region in backward-linked industries supplying goods and services to businesses (e.g., increased sales in input supply firms resulting from more nursery industry sales).
- Induced effects multipliers represent the increased sales within the region from household spending of the income earned in the direct and supporting industries for housing, utilities, food, etc.
- An imputed multiplier is calculated as the ratio of the total impact divided by direct effect for any given measure (e.g., output, employment).
Other property income represents income received from investments, such as corporate dividends, royalties, property rentals, or interest on loans.
Output is the dollar value of a good or service produced or sold, and is equivalent to sales revenues plus changes in business inventories.
Output-consumption ratio is the total industry output divided by the apparent consumption for any given commodity or industry, and is a measure of the degree to which local demands are met by local production.
Producer prices are the prices paid for goods at the factory or point of production. For manufactured goods, the purchaser price equals the producer price plus a retail margin, a wholesale margin, and a transportation margin. For services, the producer and purchaser prices are equivalent.
Proprietor income is income received by non-incorporated private business owners or self-employed individuals.
Purchaser prices are the prices paid by the final consumer of a good or service.
Region defines the geographic area for which impacts are estimated, usually an aggregation of several counties defined on the basis of worker commuting patterns.
Sector is an individual industry or group of industries producing similar products or services, or with similar production processes. Sectors are classified according to the North American Industrial Classification System (NAICS).
Value added is a broad measure of income, representing the sum of employee compensation, proprietor income, other property income, indirect business taxes, and capital consumption (depreciation). Value added is a commonly used measure of the contribution of an industry to regional economy because it avoids double counting of intermediate sales. Total value added across all industries is equivalent to Gross Regional Product.