Collectively, the agriculture, natural resource, and food industries are significant contributors to the economy of the state of Florida. This publication provides a brief summary of the information available in the most recent iteration of the annual report on the economic contributions of these industries in the State of Florida, published by the University of Florida, Institute of Food and Agricultural Sciences (UF/IFAS) Economic Impact Analysis Program. The full report (96 pages) is available at https://fred.ifas.ufl.edu/media/fredifasufledu/economic-impact-analysis/reports/FRE_Economic_Contributions_Ag_Natural_Resources_Food_Industries_FL_Report_2019_WEB-(2).pdf. The economic contributions of these industries were evaluated for calendar year 2019 to provide current information for all market participants as important reference data for the purpose of well-informed public policy.
Licensed IMPLAN regional economic modeling software (IMPLAN Pro) and associated Florida state and county databases (IMPLAN Group LLC) for 2019 were used to estimate the total economic contributions of selected industry sectors associated with agricultural production and services, natural resource extraction and management, and food and kindred product processing, manufacturing, and distribution. Analyses of this type capture not only the direct economic activity within these industries, but the indirect activity supported throughout the regional economy via supply chain relationships and induced activity supported by the re-spending of household income. This analysis includes 120 industry sectors that represent the broad array of activities encompassed by commodity production, manufacturing, distribution, and supporting services associated with agriculture and food as well as natural resources management. Economic contributions are measured in terms of employment, industry output, value added, exports, labor income, other property income, and business taxes. A glossary of economic terms is provided at the end of this publication for reference.
The overall economic contributions of Florida agriculture, natural resource, and food industries in 2019 are summarized in Table 1 and listed below.
- Direct employment of 1.75 million full-time and part-time jobs, and total employment contributions (including multiplier effects in other sectors) of 2.50 million jobs, representing 19.8% of the workforce.
- Direct industry output or sales revenues of $182.62 billion, and total output contributions of $316.02 billion.
- Foreign and domestic exports of $41.53 billion that bring new money into the Florida economy.
- Total value-added contributions of $159.74 billion, representing 14.8% of Gross State Product (similar to Gross Domestic Product, which is measured at the national scale).
- Total labor income contributions of $96.53 billion, which includes employee wages, fringe benefits, and proprietor income.
- Total other property income contributions of $46.69 billion representing rents, dividends, interest, royalties, etc.
- Total local, state, and federal government tax contributions on production and imports of $16.52 billion.
Across the various industry groups, total employment and value-added contributions were largest for:
- Food and Kindred Products Distribution* (1.81 million jobs; $108.31 billion),
- Agricultural Inputs and Services (231,463 jobs; $14.61 billion),
- Crop, Livestock, Forestry, and Fisheries Production (172,451 jobs; $9.67 billion),
- Food and Kindred Product Manufacturing (143,891 jobs; $14.67 billion),
- Mining (59,598 jobs; $5.25 billion),
- Forest Product Manufacturing (50,707 jobs; $5.63 billion), and
- Nature-Based Recreation (golf courses) (33,280 jobs; $1.61 billion).
*This industry group includes restaurants, other food service establishments, grocery stores, and other types of retail food stores.
Excluding the Food and Kindred Products Distribution industry group, the total value-added contributions for all other industry groups were $51.43 billion (4.7% of Gross State Product), and the employment contributions were 691,389 jobs (5.5% of state workforce).
Table 1. Summary of economic contributions of agriculture, natural resources, and food industry groups in Florida in 2019.
A subset of these economic contribution estimates were aggregated into seven agricultural commodity groups that have identifiable market-chain linkages between production, processing/manufacturing, and distribution sectors. Resulting total employment and value-added contributions for these commodity groups include:
- Environmental Horticulture: 190,166 jobs; $11.27 billion
- Forestry and Forest Products Manufacturing: 57,291 jobs; $6.10 billion
- Grain and Oilseed Farming and Processing: 51,208 jobs; $3.26 billion
- Fruit and Vegetable Farming and Processing: 40,583 jobs; $3.40 billion
- Livestock Farming and Animal Products Manufacturing: 23,420 jobs; $1.96 billion
- Sugarcane Farming and Refining: 12,743 jobs; $1.29 billion
- Fishing and Seafood Products: 10,007 jobs; $672 million
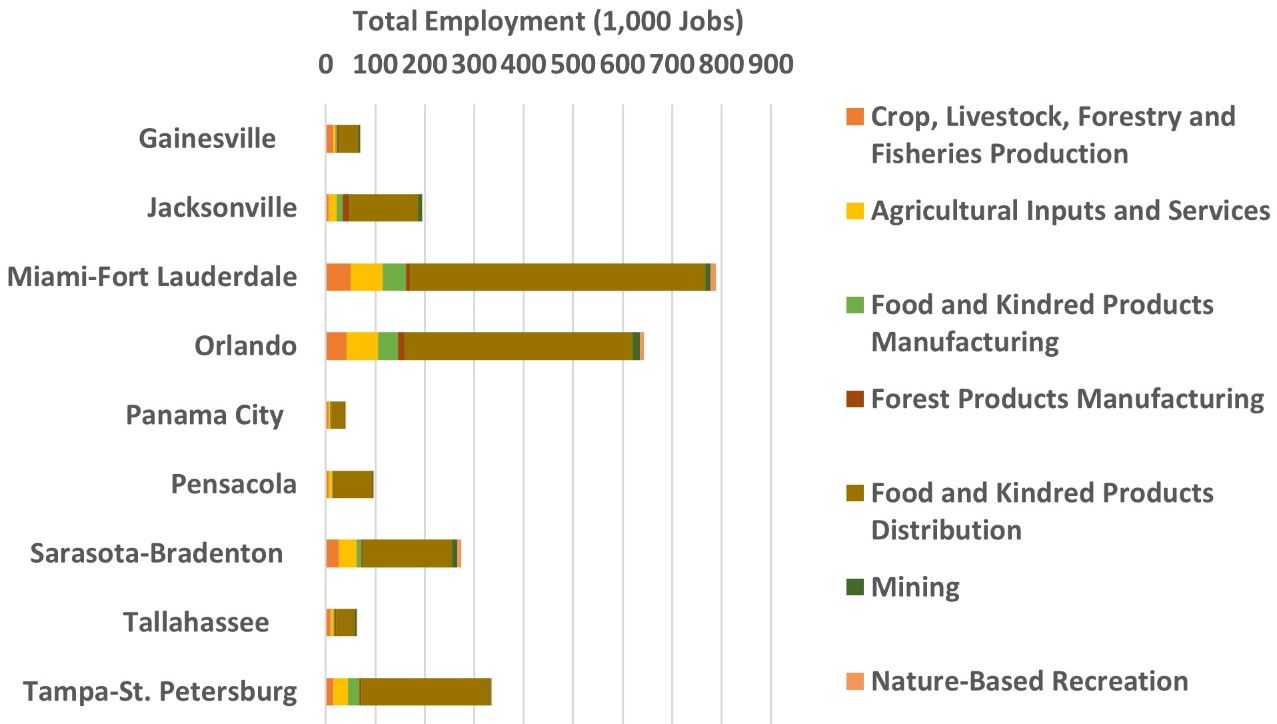
Geographically, the size and composition of agriculture, natural resource, and food industries varies dramatically across the state of Florida due to differences in climate, natural resource endowments, population, and settlement patterns. The largest economic contributions occur in the major metro areas of Miami-Ft. Lauderdale, Orlando, Tampa-St. Petersburg, Sarasota-Bradenton, and Jacksonville, where there are large demands for food and kindred products, and a large workforce available for the industry (Figure 1).

Credit: IMPLAN data for Florida counties
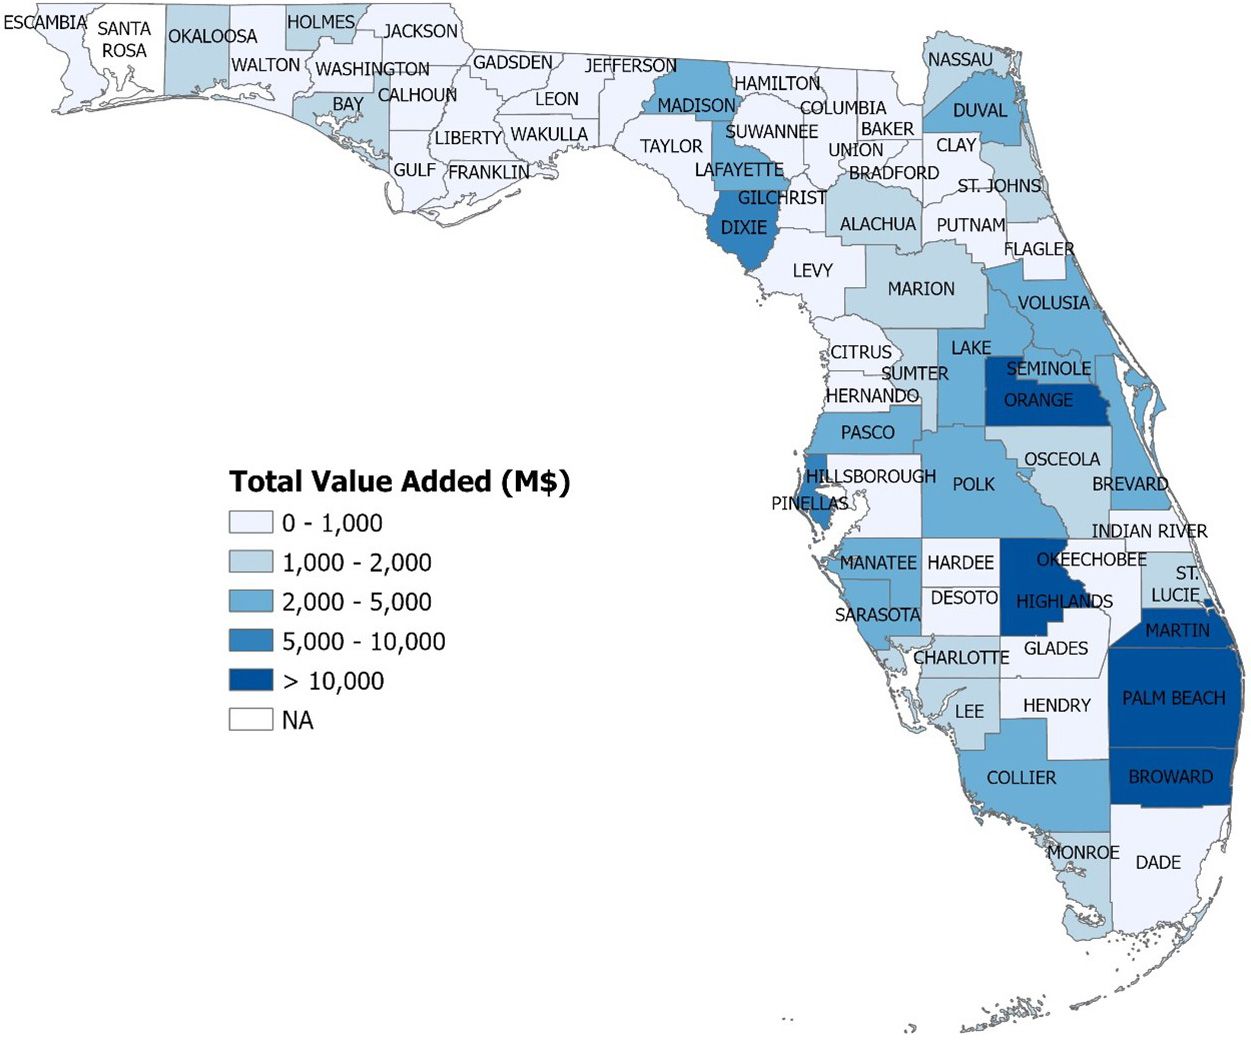
The seven largest counties in terms of employment and value-added contributions were Miami-Dade (294,791 jobs; $22.68 billion), Palm Beach (194,490 jobs; $18.00 billion), Orange (221,346 jobs; $14.34 billion), Broward (192,746 jobs; $12.81 billion), Hillsborough (176,637 jobs; $11.94 billion), Duval (120,276 jobs; $7.69 billion), and Pinellas (106, 334 jobs; $6.13 billion) (Figure 2).

Credit: IMPLAN data for Florida counties and ArcGIS software
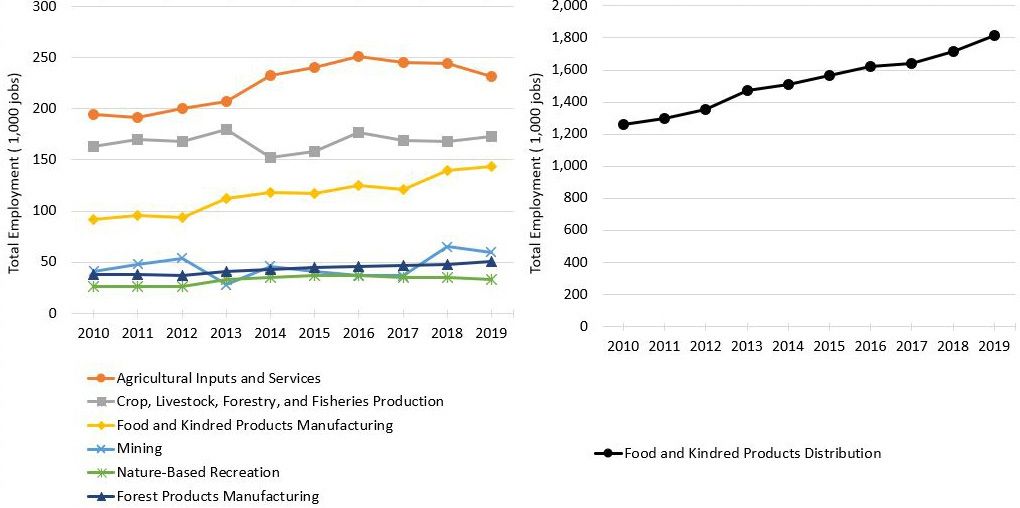
During the 10-year period of 2010 to 2019, total employment in Florida’s agriculture, natural resource, and food industries increased by 38%, or an average annual rate of 4.2% (9-year change), and total value-added contributions grew by 35.3%, or 3.9% annually, in inflation-adjusted terms. Growth in total employment contributions during this period was highest for Food and Kindred Products Manufacturing (56.9%), Mining (45.8%), Food and Kindred Products Distribution (43.8%), Forest Products Manufacturing (34.2%), Nature-based Recreation (26.7%), Agricultural Inputs and Services (18.9%), and Crop, Livestock, Forestry, and Fisheries Production (5.9%) (Figure 3).

Credit: IMPLAN data for Florida
Glossary of Economic Terms
Contribution (economic) represents the gross value of economic activity associated with an industry, event, or policy in an existing regional economy.
Employment is a measure of the number of jobs involved, including full-time, part-time, and seasonal positions. It is not a measure of full-time equivalents (FTE).
Exports are sales of goods to customers outside the region in which they are produced. Exports represent a net inflow of money to the region. This also applies to sales of goods and services to customers visiting from other regions.
Final Demand represents sales to final consumers, including households, governments, and exports from the region.
Gross Regional Product is a measure of total economic activity in a region, or total income generated by all goods and services. It equals the total value added by all industries in that region and is equivalent to Gross Domestic Product as measured at the national level.
IMPLAN is a computer-based input-output modeling system that enables users to create regional economic models and multipliers for any region consisting of one or more counties or states in the United States. The current version of the IMPLAN software, IMPLAN Pro, accounts for commodity production and consumption for 540 industry sectors, 10 household income levels, taxes to local/state and federal governments, capital investment, imports and exports, transfer payments, and business inventories. Regional datasets for individual counties or states are purchased separately. The IMPLAN software and regional data are licensed by IMPLAN Group, LLC, Huntersville, NC.
Imports are purchases of goods and services originating outside the region of analysis.
Income is the money earned within the region from production and sales.
Taxes on Production and Imports are taxes paid to governments by individuals or businesses for property, excise, and sales taxes, but do not include income taxes.
Local refers to goods and services that are sourced from within the region, which can be defined as a county, multi-county cluster, or state.
Non-local refers to economic activity originating outside the region.
Multipliers capture the total effects, both direct and secondary, in a given region, generally as a ratio of the total economic contributions in the region relative to the direct economic contributions. Multipliers are derived from an input-output model of the regional economy. Multipliers might be expressed as ratios of sales, income, or employment, or as ratios of total income or employment changes relative to direct sales. Multipliers express the degree of interdependency between sectors in a region's economy and therefore vary considerably across regions and sectors.
Other Property Income represents income received from investments such as corporate dividends, royalties, property rentals, or interest on loans.
Output is the dollar value of a good or service produced or sold and is equivalent to sales revenues plus changes in business inventories.
Proprietor Income is income received by non-incorporated private business owners or self-employed individuals.
Region or Regional Economy is the geographic area and the economic activity it contains for which contributions are estimated. It can consist of an individual county, an aggregation of several counties, a state, or aggregation of states. These aggregations are sometimes defined on the basis of worker commuting patterns.
Sector is an individual industry or group of industries that produce similar products or services or have similar production processes. Sectors are classified according to the North American Industrial Classification System (NAICS).
Value Added is a broad measure of income, representing the sum of employee compensation, proprietor income, other property income, indirect business taxes, and capital consumption (depreciation).