Introduction
This publication is intended to inform citrus growers and other citrus industry stakeholders about the impact of rising orange juice (OJ) prices on consumer perception and demand and the long-term impact on market access.
In early 2022, during the highest period of inflation in more than 40 years, consumers continued to display strong demand for goods and services in the wake of the two previous years of the COVID-19 pandemic. In the first quarter of 2022, the Bureau of Economic Analysis (BEA) reported increases in real personal consumption expenditures on goods and services signifying that many Americans had resumed leisure travel and were splurging on luxury items, such as new cars, while the housing market remained robust (BEA 2023). Amid rising prices, consumers spent heavily at grocery stores. Within the OJ category, which had experienced years of declining sales before the pandemic, sales of 100% OJ remained steady at levels similar to those seen in 2019.
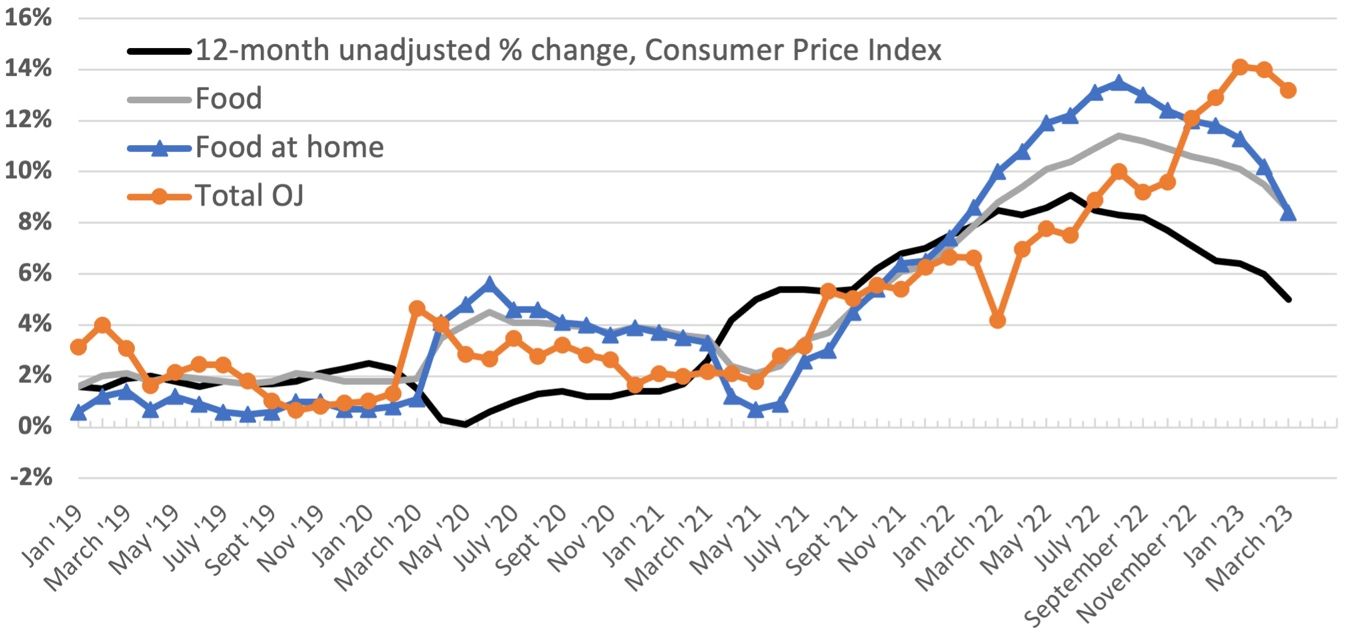
In April 2022, according to data from the Bureau of Labor Statistics, the inflation rate in the United States climbed to its highest level in over 40 years. The Consumer Price Index (CPI), which measures the average change in prices of goods and services over time, rose by 0.9 percent in April, bringing the year-over-year increase to 9.1 percent. This marked the beginning of the highest annual inflation rate since September 1982. The increase in prices was all encompassing, with the highest increases in food, shelter, and gasoline. At the same time, other goods and services experienced significant inflationary pressures, notably for big ticket purchases like used cars and air travel. Ongoing supply chain disruptions, labor shortages, and strong demand for goods and services were credited as the main drivers of the inflationary pressures (Federal Reserve Open Market Committee, 2022). At the time, many economists remained uncertain whether to expect inflation to remain heightened for the remainder of the year, and the Federal Reserve escalated efforts to combat inflation.
As the year progressed, inflation rates moderated gradually with Federal Reserve to curb them. Persistent inflation in prices for goods and services in the United States caused a decline in consumer confidence, particularly in the food at home sector, which experienced higher inflation rates compared to other sectors, such as a peak of 13.1 percent in August 2022. Although inflation within the OJ category rose relatively slowly compared to the overall inflation in the food at home index, it remained high and peaked at 14.1% in January 2023. During this period of inflation, consumers responded to rising food prices by purchasing less food, as reported by Yoon et al. (2023). The expected response was a decline in OJ sales.
At the same time, Florida orange production was forecasted to reach historically low levels of production during the 2022/23 season mainly due to the citrus greening disease coupled with unfavorable weather conditions (USDA ERS 2023). The recent spike in OJ prices added another challenge to the pressured industry. To provide stakeholders in the industry insights into consumer behavior, we analyzed consumer survey data and examined the extent to which the demand for 100% OJ has changed during the recent inflationary period. We used the latest statistics from both retail sales and consumer panel data. First, we used Nielsen data collected from retail stores to examine changes in consumer demand for OJ in terms of volume/dollar sales and prices. Second, we used consumer panel data to investigate how consumers’ OJ-purchasing behaviors and their perceptions of OJ changed in reaction to the elevated OJ prices.
Credit: Bureau of Labor Statistics
Data
In this publication, we use two data sources to describe the 100% OJ market and OJ consumer behavior in the United States. First, we use Nielsen scanner data (Nielsen) to show volume and dollars sales of OJ over time. Nielsen data is collected from retail stores such as grocery/drug stores, mass merchandisers, dollar stores, and military commissaries across the nation from January 2018 to March 2023. The types of 100% OJ in the data include refrigerated not-from-concentrate, refrigerated reconstituted, shelf stable, and frozen OJ. Second, we use the Florida Department of Citrus OJ consumer tracker survey (FDOC OJ tracker), which was designed and is maintained by the University of Florida’s Florida Agricultural Marketing Research Center (FAMRC), to gain a comprehensive understanding of consumer perceptions of OJ and their OJ purchasing behaviors. The survey gathered 500 responses a month from primary grocery shoppers in the United States, aged 18 and older.
Results
Changes in Orange Juice Sales from Nielsen Scanner Data
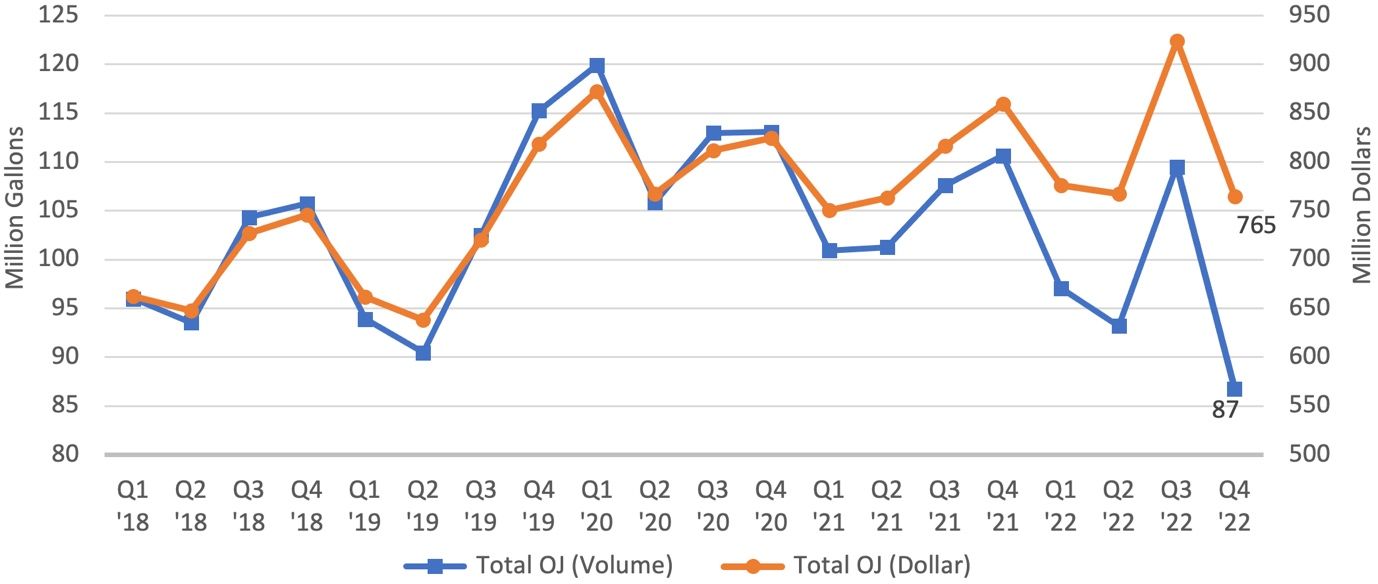
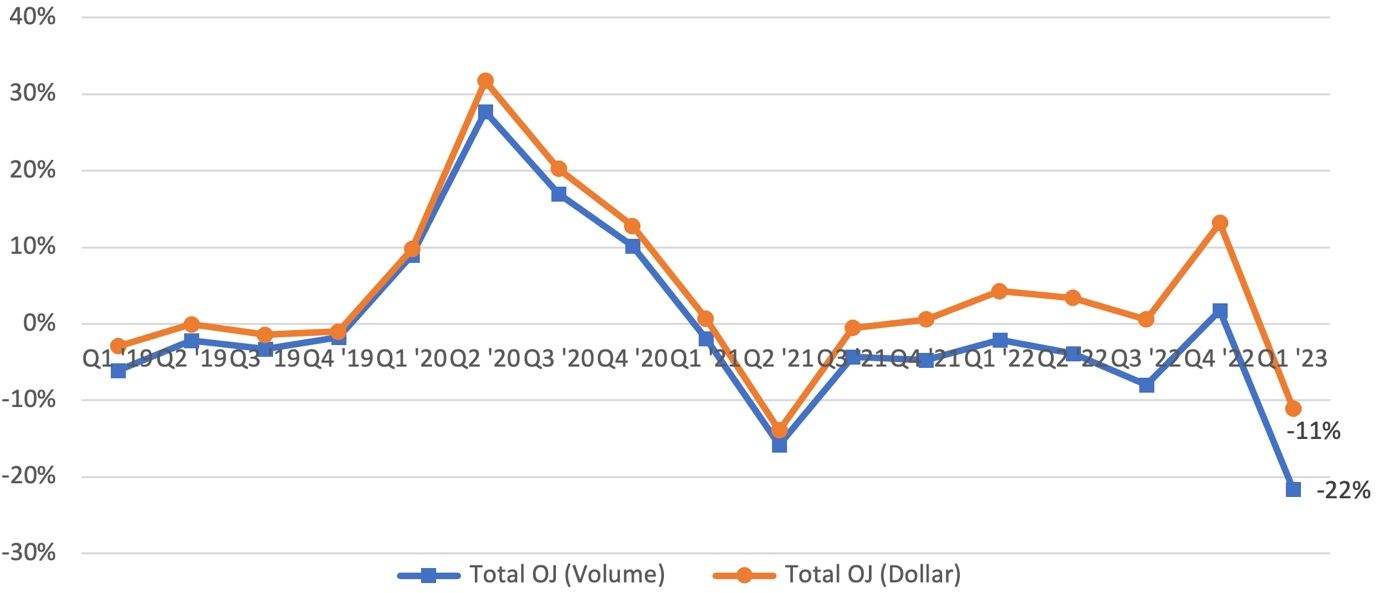
Sales of 100% OJ soared during the early Covid-19 pandemic in 2020, showing 16% and 18% increased sales in annual volume and dollar sales, respectively, compared to the previous year of 2019 (Figures 2 and 3). Before 2020, sales of 100% OJ had been steadily declining. At first, this increase in sales occurred mostly because consumers were stocking up on essential items, but after the initial burst, sales remained strong due to consumers’ perception that OJ consumption provides health and wellness benefits. The pandemic effect on OJ sales began to fade in 2021, and annual OJ volume and dollar sales dropped by 7% and 4%, respectively, compared to sales in 2020.
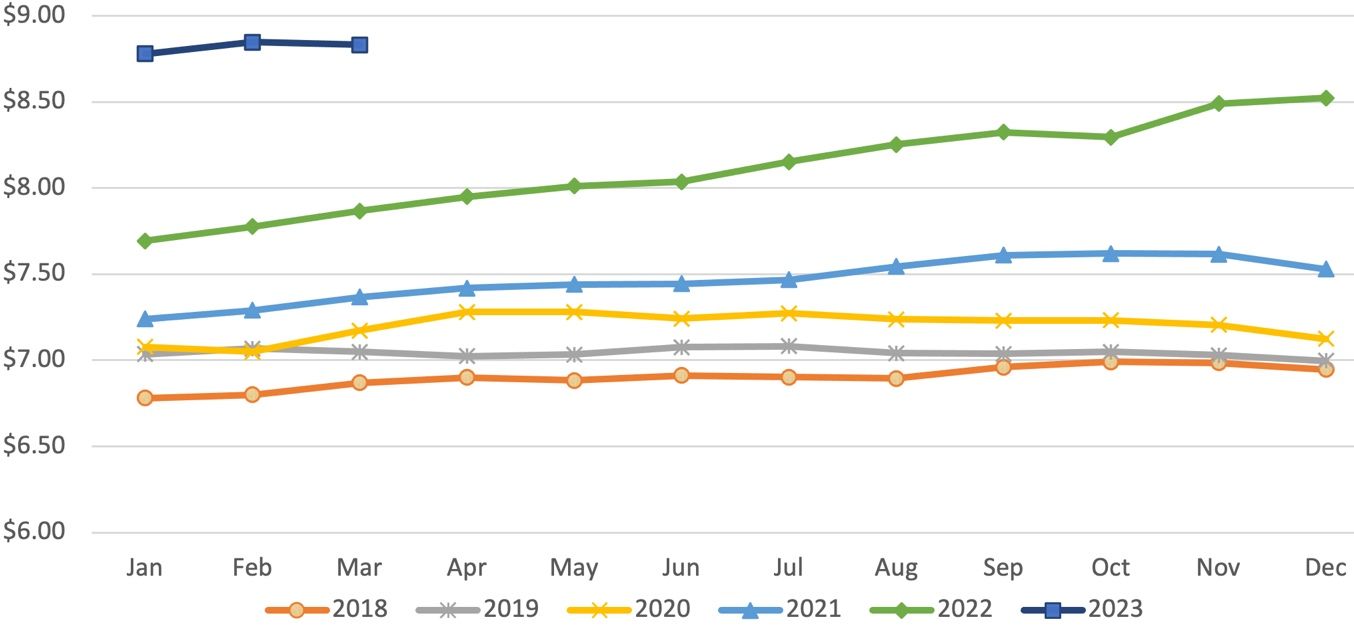
During the same period, the price of OJ was increasing, but the increasing-price trend became more apparent in 2022 with 9% year-over-year increase. Despite OJ volume sales declining by 7% and 3% in 2021 and 2022, respectively, the increased price of OJ helped to maintain higher retail dollar sales levels, like those seen during the COVID-19 pandemic in 2021–2022. While OJ dollar sales dropped slightly (-4%) in 2021, they increased by 5% in 2022. However, the persistent increases in OJ prices contributed to significant drops in both OJ dollar and volume sales in the first quarter of 2023 (Figures 2 and 3). Orange juice dollar sales in the first quarter of 2023 decreased 11% on a year-over-year basis from 860 to 765 million dollars. Compared to OJ dollar sales change, OJ volume sales experienced a much larger decline in the same period, 22% sales drop year-over-year from 111 to 87 million gallons. The average OJ price in the first quarter 2023 was $8.82 per gallon, which was 14% higher than a year ago price of $7.77 (Figure 4). During Q1 2019 and Q3 2021, the inflation rates in OJ prices ranged from 1% to 4%, indicating moderate changes throughout the Covid-19 pandemic period. However, beginning in Q4 2021, the rising price of OJ becomes more noticeable, climbing to 14% in the first quarter 2023.
Credit: Nielsen
Credit: Nielsen
Credit: Nielsen
Orange Juice Consumer Responses to Rising Orange Juice Prices
The OJ tracker provides in-depth information on consumer behavior in response to OJ price inflation. The tracker survey requires participants to report the types of groceries they have purchased within the last 30 days. Based on the responses, “active” consumers are defined as those who purchased a product within the last 30 days. The tracker data shows that both active and non-active OJ consumers have reported noticing the recent increase in OJ prices. Among active OJ consumers, while “taste” is the number one factor that goes into consumers’ OJ purchasing decisions (27%), “price” is the rising factor chosen by 20% of respondents in 2022 and 2023 (Figure 5). Non-active OJ consumers, those who have not reported purchasing OJ in the previous month, are more likely to list “price” as the most selected reason for not purchasing OJ in 2022 (Figure 6). Similarly, “Not on sale/deal” is also a rising reason for not buying OJ in the past month.
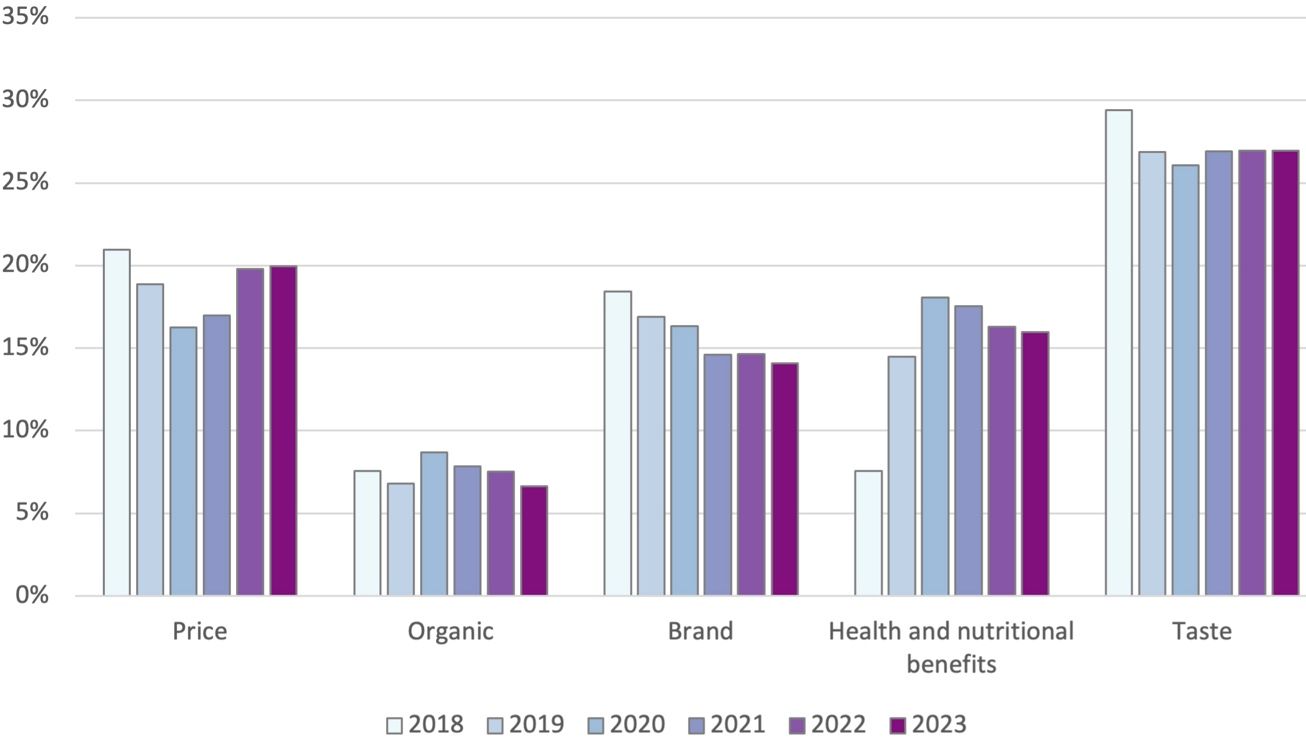
Credit: FAMRC OJ tracker. 2023 statistics are based on the four-month data collected from January to April 2023
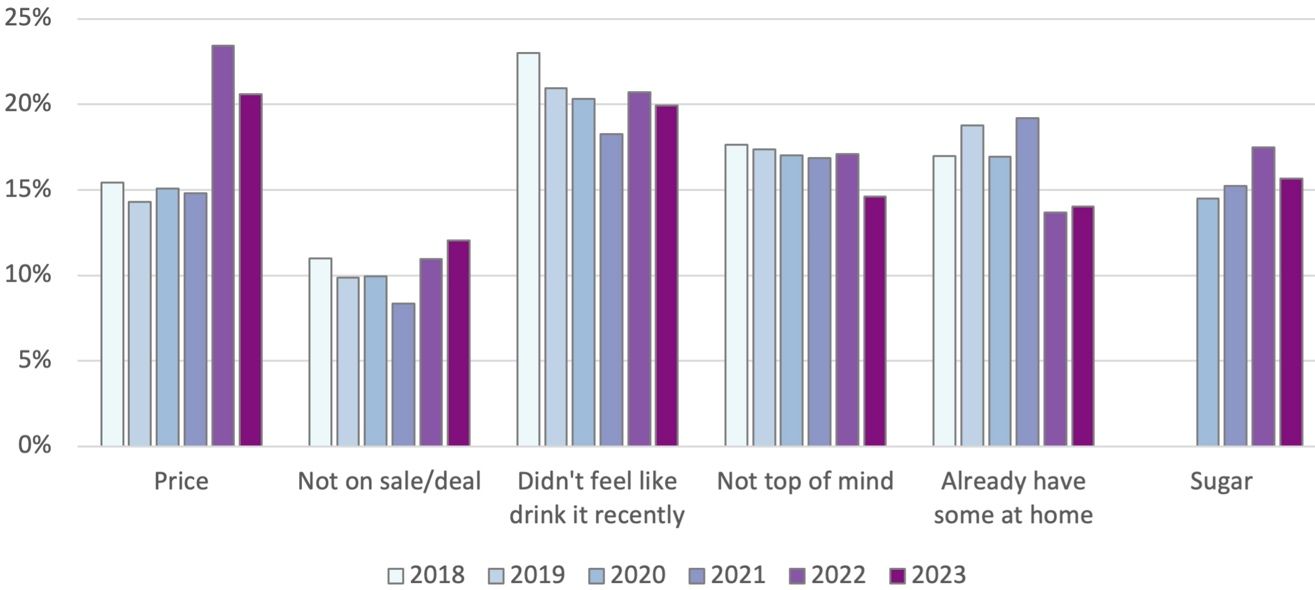
Credit: FAMRC OJ tracker. 2023 statistics are based on the four-month data collected from January to April 2023
Even though consumers were well aware of the rising price of OJ, the share of active OJ consumers slightly increased during the inflationary period (Figure 7). The percentage of active OJ consumers was 48% in 2021, which increased to 51% in 2022. We observed a similar trend among 100% fruit juice consumers, which changed from 60% in 2021 to 63% in 2022. Furthermore, the share of active OJ consumers among active 100% fruit juice consumers rose slightly from 79% in 2021 to 81% in 2022. The share of active OJ consumers in 2023 (January–April) remains constant from 2022 statistics. According to the report based on Nielsen annual sales data (Florida Department of Citrus 2023), the OJ household penetration rate slightly contracted from 60% in 2021 to 57.6% in 2022. However, the 2022 penetration rate was still slightly above the average of the past few years 2018–2020, which was 56.4%.
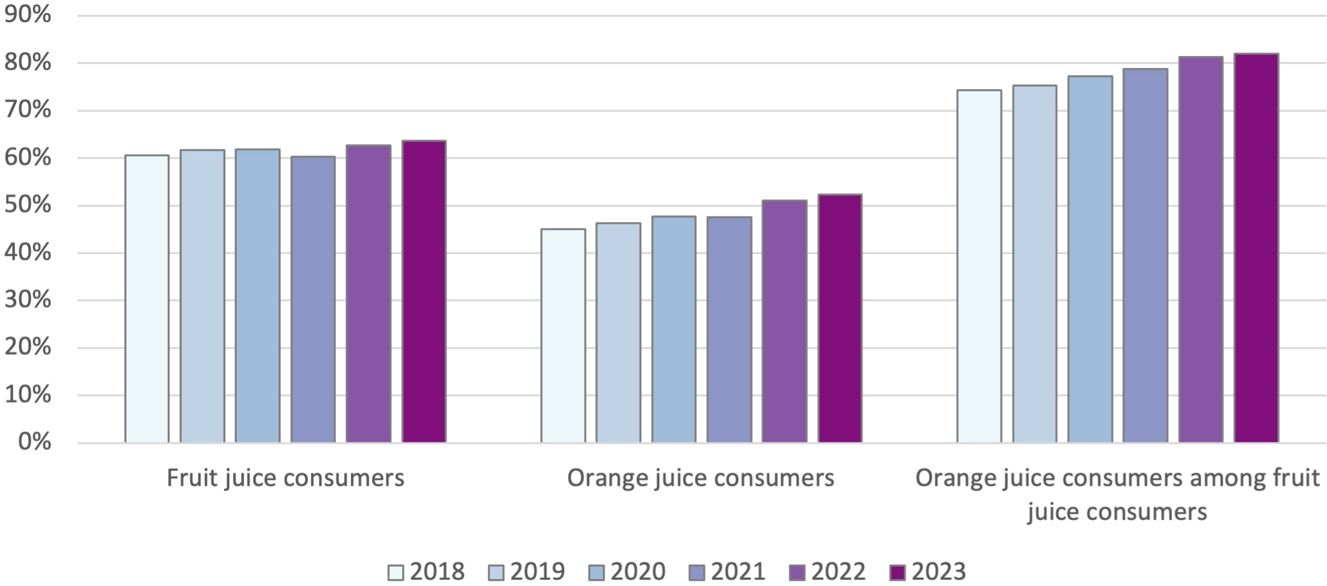
Credit: FAMRC OJ tracker. The 2023 statistics are based on the four-month data collected from January to April 2023
Statistics from Nielsen and the OJ tracker database suggest that the volume and dollar sales of OJ decreased while the share of active OJ consumers remained relatively robust in recent years. This indicates that consumers responding to rising OJ prices are more likely to cut back on the quantity and frequency of their OJ purchases, rather than completely discontinuing OJ consumption. The OJ tracker shows that the average purchase frequencies in the past 30 days for the two most popular OJ container sizes (64 oz and 50 oz–59 oz) decreased 4.4 to 4.1 times and 4.1 to 3.9 times, respectively, during 2021 and 2022. Another report based on Nielsen household homescan data also reveals decreased trends in terms of OJ purchase quantity and frequency (Florida Department of Citrus 2023). The annual average OJ quantity in gallons per OJ-buying household (i.e., buying rate) decreased from 3.9 in 2021 to 3.6 in 2022. Similarly, the annual OJ purchase frequency by OJ buying households decreased from 6.4 times a year to 6.2 times a year on average during the same period.
High OJ price is certainly a significant barrier to maintaining OJ consumption. According to the OJ tracker, respondents reported a slightly lower intention to purchase OJ during their next grocery shopping trip. The share of respondents who stated an intent to purchase OJ in their next grocery shopping trip decreased slightly to 63% in 2022 and 65% in 2023 from 67% in 2021. Respondents also reported a slightly lower intention to maintain their current level of OJ consumption, from 77% in 2021 to 74% in 2022 and 72% in 2023. Even with the recent increase in OJ prices, the share of consumers who possess positive perception about OJ remains strong over the recent years, with over 60% of respondents since 2019 evaluating OJ as a valuable food product. As Heng et al. noted in their 2019 study, the continued effort to market OJ by emphasizing the health benefits of drinking it is crucial, particularly during the inflationary period, because awareness of OJ and positive perceptions of OJ are the key demand drivers.
Conclusions
Current statistics from the Nielsen scanner and OJ tracker datasets indicate that consumers are aware of the ongoing increases in OJ prices and have reduced their OJ consumption in response by lowering their OJ purchase quantity and frequency. However, declines in sales are not specific to OJ. During the recent inflationary period, purchasing less food became a more common cost-saving strategy (Yoon et al. 2023). Given the relatively constant share of active OJ consumers in recent years, the decline in OJ consumption is mainly attributed to increases in OJ prices, rather than changes in consumer preference for OJ. This indicates there is a possibility that the demand for OJ may increase once inflation is mitigated.
The OJ category faces many challenges, and it is worth noting that there are several contributing factors behind rising OJ prices in recent years. First, overall inflation across most economic sectors played a pivotal role, with persistent inflation in the food at home CPI peaking at 13.5 percent in August 2022, with only moderate signs of easing thereafter. However, for the past two decades, supply side disruptions have also contributed significantly to the decline in OJ consumption and to a general decline in distribution of OJ to retail spaces. More recently, supply side disruptions have included a shortage of labor, the high cost of inputs, and challenges to the transportation industry that have made delivery of goods and services to consumers more difficult. Third, natural disasters, such as freezes and hurricanes, have damaged orange trees and the orange crop in Florida. Finally, citrus greening disease has severely stunted Florida citrus production, with reduced crops, lower juice yields and declining acreage. The supply shortfalls have had far-reaching consequences on the state of the OJ category, including reduced overall investment in the citrus industry and high inflation in the category.
Despite the recent inflationary period, analysis of OJ tracker data indicates that the proportion of consumers with a positive perception of OJ remained steady and robust. This finding underscores the significance of sustained marketing efforts that highlight the health and wellness attributes of consuming OJ. It is known that consumer awareness of OJ promotion and positive perceptions of OJ are key demand drivers of OJ consumption (Heng et al. 2019). Therefore, continuous promotion of OJ may aid in sustaining OJ consumption levels when OJ prices are under pressure from supply shortage and overall economic inflation.
References
Bureau of Economic Analysis. 2023. Table 2.3.6. Real Personal Consumption Expenditures by Major Type of Product, Chained Dollars. https://fred.stlouisfed.org/release/tables?eid=4911&rid=53
Federal Reserve Open Market Committee. 2022. Monetary Policy and Economic Outlook. Board of Governors of the Federal Reserve. https://www.federalreserve.gov/monetarypolicy/fomc.htm
Florida Department of Citrus. 2023. Household Purchase Dynamics in the Beverage Category https://fdocgrower.app.box.com/s/i81411zspf0wsof41wd85amkf0eb6kdi/file/1216355869021
Heng, Y., R. W. Ward, L. A. House, and M. Zansler. 2019. “Assessing Key Factors Influencing Orange Juice Demand in the Current US Market.” Agribusiness 35 (4): 501–515. https://doi.org/10.1002/agr.21596
United States Department of Agriculture Economic Research Service (USDA ERS). 2023. Fruit and Tree Nuts Outlook: March 2023. https://www.ers.usda.gov/webdocs/outlooks/106240/fts-376.pdf?v=3143.5
Yoon, S., House, L., Chen, L. A., & Heng, Y. (2023). How Do Consumers Perceive and Respond to Recent Food Price Inflation? Choices: The Magazine of Food, Farm, and Resource Issues, 38(3). https://www.choicesmagazine.org/choices-magazine/data-visualizations/how-do-consumers-perceive-and-respond-to-recent-food-price-inflation