Introduction
Citrus production in the United States, particularly production of oranges, has faced a steady decline since the early 2000s, attributed to various challenges such as the outbreak of the devastating Huanglongbing (HLB) disease (Hernández et al. 2012; Singerman et al. 2018) and labor shortages. The shrinking domestic supply has resulted in an increasing reliance on imports. This article provides an overview of declining US orange production and the rising imports, aiming to provide industry stakeholders and policymakers with insights into the current state of the industry and the potential threats it faces, informing both policymaking and business decisions.
United States Orange Production
Between the 1960s and the 1980s, the United States rose to prominence in the global orange market and became the world’s leading producer, accounting for over 20% of worldwide production (FAO 2023). Yet, since the 2000s, the US orange industry has been grappling with continuous declines, primarily due to the catastrophic outbreak of Huanglongbing (HLB), the most devastating citrus disease in the last several decades. Since its first identification in Florida, in 2005, HLB has significantly impacted fruit quality and yield, currently affecting nearly all Florida citrus acreage (Rezazadeh 2022). Additionally, the industry weathered a series of hurricanes, including Charley, Frances, and Jeanne in 2004, Wilma in 2005, and Irma in 2017 (FDOC 2021). Citrus production was also impacted by labor shortages, increasing reliance on immigrant workers (Guan et al. 2015; Biswas et al. 2018b; Ali 2022; Huang et al. 2022), and escalating wages for grove workers (Calvin et al., 2022). By 2021, the US contribution to global orange production dropped to 5% (USDA-FAS 2023a; FAO 2023). Despite this decline, oranges remain a crop of substantial economic importance in US agriculture, contributing billions of dollars to the national economy annually (Statista 2023).
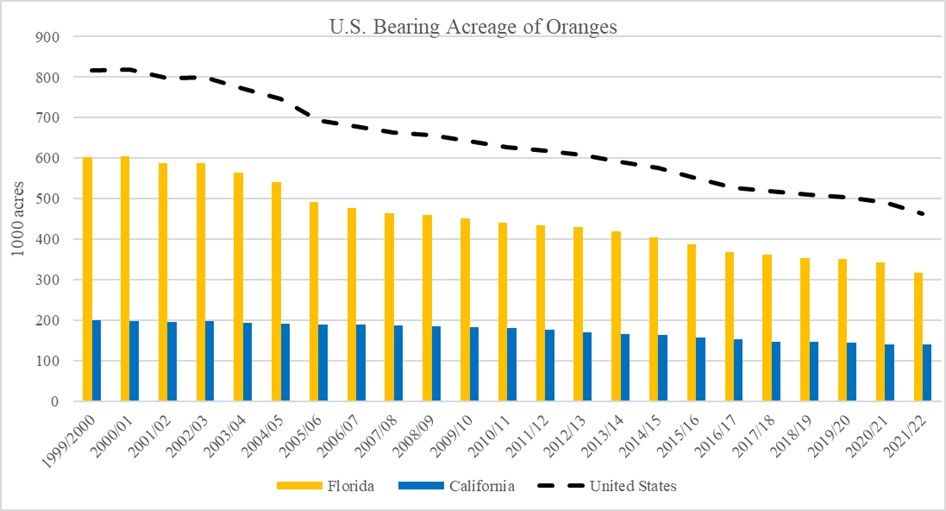
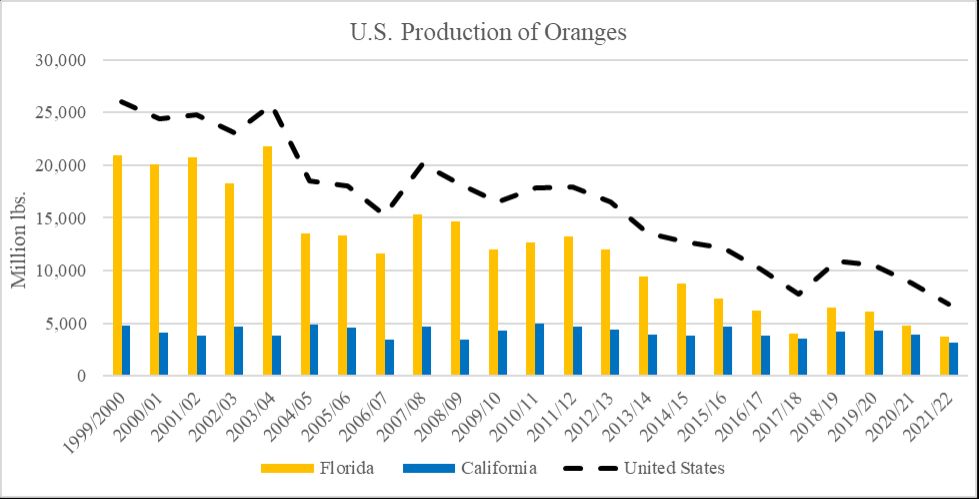
In the past two decades, the area of the United States devoted to orange cultivation has shrunk by 43% from 817 thousand acres in 2000 to 464 thousand acres in 2022 (Figure 1). The orange yield per acre has also significantly decreased, from 32 thousand pounds in 2000 to 15 thousand pounds in 2022, dropping 53%. Consequently, the production of US oranges has seen a consistent downward trend since 2000. In 2022, production amounted to 6,853 million pounds of oranges. Compared to the volume produced in 2000 (25,994 million pounds) (Figure 2), this represents a dramatic drop of 69%. Of the 6,853 million pounds of oranges produced in 2022, 59% were processed into juice, while 41% were sold as fresh oranges (USDA-NASS 2023). Due to domestic supply shortages, processors in the United States use imported oranges (and orange juice), primarily from Brazil, Chile, and Mexico, to meet demand.

Credit: USDA-NASS, 2023

Credit: USDA-NASS 2023; USDA-ERS 2023
Florida and California are the United States’ leading orange producers (Figure 2). Florida, harvesting from September to June, accounted for 54.1% of the 2022 total US production, while California, producing year-round, provided 45.6%; Texas and Arizona combined accounted for the remaining 0.3%.
However, Florida, although the top producer, has seen its bearing acreage, yield per acre, and total orange production consistently declining over the past 20 years. Florida orange production decreased from 20,970 million pounds in 2000 to 3,708 million pounds in 2022, representing a 82% fall (Figure 2). During the same period, bearing acreage in Florida dropped by 47% from 602 thousand acres to 317 thousand acres (Figure 1). Yield per acre in Florida also declined, by 67%, from 34.8 thousand pounds to 11.6 thousand pounds. California surpassed Florida in yield in 2014 and has continued to lead in yield since then (USDA-ERS 2023). In 2022, Florida’s yield per acre (11.6 thousand pounds) was nearly 50% less than California’s (22.6 thousand pounds).
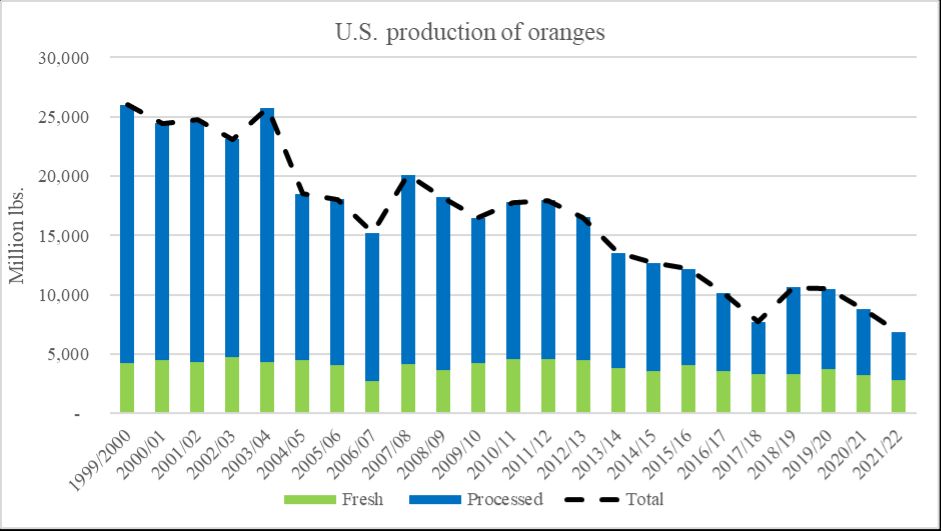
As depicted in Figure 3, the bulk of US orange production is for processing. On average, roughly 70% of the oranges produced in the United States have been earmarked for processing since 2000. There has been a noticeable decline in the use of oranges for processing in recent years. While approximately 22,000 million pounds were allocated for processing in 2000, only 4000 million pounds were left for processing in 2022. This decline is explained by the drop in Florida production, of which more than 90% goes to be processed, representing more than 90% of total US processed oranges since 2000. Conversely, the production of oranges intended for fresh marketing has remained relatively consistent, averaging around 4,000 million pounds since 2000. This stability of fresh orange production is explained by the relatively stable production of California oranges. California production specializes in oranges to be marketed fresh. Since 2017, California has represented 90% of US national production of fresh oranges since 2017.

Credit: USDA-ERS 2023
United States Imports of Oranges
The United States holds a significant position as an importer of oranges. In 2022, the United States ranked fourth in the world in terms of the value of fresh orange imports, totaling $270 million. This ranking placed the United States behind France, Germany, and the Netherlands (Tridge 2023). As a result of declining domestic orange production, the United States has seen rising imports of orange juice (OJ). The United States ranked third among OJ-importing nations in 2021 with OJ imports valued at $362 million, trailing behind Belgium and the Netherlands (OEC 2023).
Among the major sources of imports, Brazil primarily stands out in the category of processed orange juice imports, while Chile leads in terms of fresh orange imports. Meanwhile, Mexico has emerged as the second-largest source of both types of imports for the United States, steadily increasing its share of total imports. Notably, Mexico overtook Brazil as the top source of Frozen Concentrated Orange Juice (FCOJ) imports since 2019 (USDA-FAS 2023; CitrusBR Analysis 2020).
United States imports of fresh oranges have been on an upward trajectory since the early 2000s.
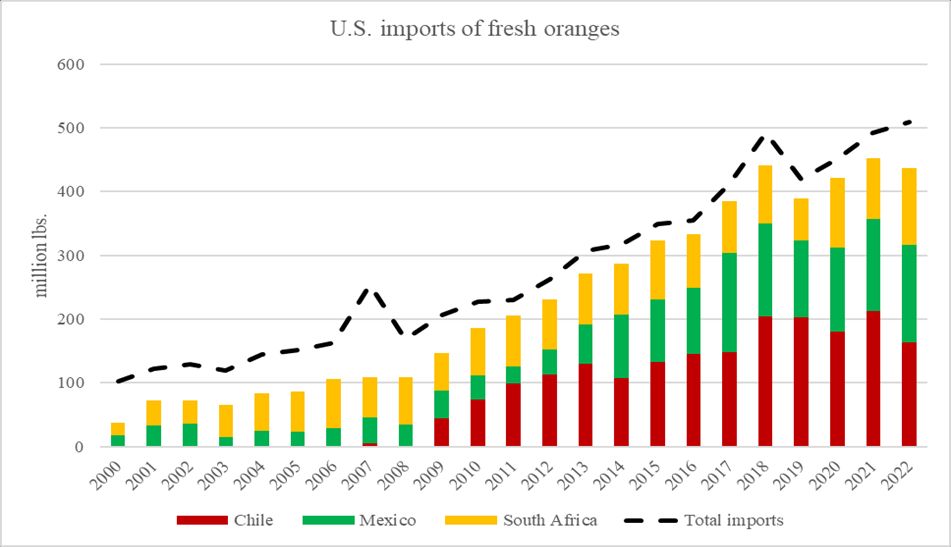
As illustrated in Figure 4, total US imports of fresh oranges have experienced a fivefold increase since 2000, surging from 103 million pounds to a substantial 509 million pounds in 2022. Over the past five years, three primary sources of imports, Chile, Mexico, and South Africa, have consistently dominated this landscape. These three countries collectively have constituted an average of 91% of total fresh orange imports since 2017, culminating in 510 million pounds in 2022. Notably absent until 2009, Chile has been leading US fresh orange imports since 2011, consistently representing an average of 40% of the total fresh orange imports over the last five years. South Africa, which was the top source of US fresh orange imports until 2010, peaking at 48% of total imports in 2006, ceded its position to Chile in 2011 and was subsequently overtaken by Mexico in 2014.

Credit: USDA-FAS 2023a
Mexican shipments of fresh oranges have seen an impressive ninefold increase since 2000, starting at 17 million pounds (17% of total imports) and reaching a remarkable 153 million pounds (30% of total imports) in 2022.
The surge in US imports of oranges, particularly from Chile and Mexico, can be attributed to several key factors. Declining production in the United States has certainly increased the demand for imports. Lower labor costs in these countries have also made their products more competitive. As of 2022, the Mexican minimum wage (approximately $1.5 per hour) is roughly one-tenth of the US minimum wage in the citrus-producing states of California and Florida ($15 and $12 per hour, respectively), whereas the Chilean minimum wage (approximately $2.5 per hour) is about one-fifth of the US minimum wage (CountryEconomy.com 2023a, b; US Bureau of Labor Statistics 2023). These substantial wage disparities are particularly noteworthy in the context of labor-intensive crop production, where manual labor plays a significant role in harvesting (Singerman and Burani-Arouca 2018; Calvin and Martin 2010). Additionally, favorable growth conditions, including higher temperatures and a lower risk of freezing, along with elevated terrain and fertile soil (USDA-FAS 2021), have facilitated large-scale production of high-quality oranges. Mexico’s marketing season spans from November to October and peaks between May and June. Chile’s marketing season begins in April and reaches its peak from July to October. Together Mexico and Chile ensure a steady supply of oranges during the US off season (USDA-FAS 2023a).
The implementation of the North American Free Trade Agreement (NAFTA) in 1994 and the Chile Free Trade Agreement in 2004 have made the United States the preferred destination for both Mexican and Chilean exporters. Over the past five years, Mexican fresh oranges have been predominantly exported to the US market, constituting 97% of their total exports. Similarly, the United States remains the top export market for Chile, accounting for over 90% of the country's orange exports (USDA-FAS 2022a, b).
Concluding Remarks
The steady decline in US citrus production, particularly production of oranges, over the last two decades, is attributed to the HLB outbreak and the competitiveness of foreign products. The declining consumption, primarily due to rising prices (Kim et al. 2018) and a shift in consumer habits away from sugary products like orange juice (Heng et al. 2018; Heng et al. 2019), has also played a role in this decline. Decreasing production has led to an increased reliance on imports to meet the demand for oranges.
Mexico has emerged as a prominent exporter of fresh oranges and processed orange juices. Notably, Mexico has been the largest source of US frozen concentrate orange juice (FCOJ) imports since 2019. While the increasing imports from Mexico have played an important role in meeting the US market demand after HLB created major disruptions in domestic supply, the surging imports from a country with competitive advantages will likely continue to present a major challenge for US orange growers even if the HLB problem is eventually resolved and the US domestic citrus industry begins a recovery. In particular, Mexico’s abundant labor, lower wages (Wu et al. 2018), and government policies that favor citrus production (Wu et al. 2022a) will continue to drive growth of the industry there. Mexico’s prominent position has been demonstrated in the markets of many fruit and vegetable crops (Huang et al. 2022), including tomatoes (Li et al. 2022), peppers (Biswas et al. 2018a), cucumbers, squash (Wu et al. 2022b), and berries (Suh et al. 2017; Wu and Guan 2021). In 2022, Mexico accounted for over 60% of total US fruit and vegetable imports, resulting in a staggering $16 billion US deficit in the bilateral fruit and vegetable trade (USDA-FAS 2023a).
For the sustainability and survival of the US citrus industry, prioritizing investment in research and development to combat HLB remains the primary task. Additionally, keeping a close watch on both the decline in orange juice consumption and the surge in orange juice imports will remain essential to gain insight into how these trends affect the US citrus industry.
References
Ali, S. 2022. “Farmers Push for Immigration Reform to Counter Labor Shortages and Rising Food Prices.” NBC News. Available online at: https://www.nbcnews.com/news/us-news/farmers-pushing-immigration-reform-counter-labor-shortages-escalating-rcna45741. Retrieved on: 11/30/2023.
Biswas, T., Z. Guan, and F. Wu. 2018a. “An Overview of the U.S. Bell Pepper Industry: FE1028, 12/2017.” EDIS 2018 (2). Gainesville, FL. https://doi.org/10.32473/edis-fe1028-2017
Biswas, T., F. Wu, and Z. Guan. 2018b. “Labor Shortages in the Florida Strawberry Industry: FE1041, 7/2018.” EDIS 2018 (5). Gainesville, FL. https://doi.org/10.32473/edis-fe1041-2018
Calvin, L., and P. L. Martin. 2010. Labor-Intensive US Fruit and Vegetable Industry Competes in a Global Market (No. 1490-2016-127358, pp. 24-31).
Calvin, L., P. Martin, and S. Simnitt. 2022. Adjusting to Higher Labor Costs in Selected US Fresh Fruit and Vegetable Industries, EIB-235, U.S. Department of Agriculture, Economic Research Service.
CitrusBR Analysis. 2020. Brazilian Association of Citrus Exporters. Available online at: https://citrusbr.com/wp-content/uploads/2021/03/Mexico-Brazil-Analysis.pdf. Retrieved on 10/05/2023.
CountryEconomy.com. 2023a. Chile National Minimum Wage - NMW. Available online at: https://countryeconomy.com/national-minimum-wage/chile. Retrieved on 12/01/2023.
CountryEconomy.com. 2023b. Mexico National Minimum Wage – NMW. Available online at: https://countryeconomy.com/national-minimum-wage/mexico. Retrieved on 12/01/2023.
FAO (Food and Agriculture Organization of the United Nations). 2023. FAOSTAT Database. https://www.fao.org/faostat/en/#home
Florida Department of Citrus-FDOC. 2021. Citrus Reference Book. At the Economic and Market Research Department. Available online at: https://www.floridacitrus.org/grower/florida-department-of-citrus/economic-market-resources/economic-reports/. Retrieved on 12/05/2023.
Guan, Z., F. Wu, F. Roka, and A. Whidden. 2015. “Agricultural Labor and Immigration Reform.” Choices 30 (4): 1–9.
Heng, Y., L. A. House, and H. Kim. 2018. “The Competition of Beverage Products in Current Market: A Composite Demand Analysis.” Agricultural and Resource Economics Review 47 (1): 118–131 https://doi.org/10.1017/age.2017.10
Heng, Y., R. W. Ward, L. A. House, and M. Zansler. 2019. “Assessing Key Factors Influencing Orange Juice Demand in the Current US Market.” Agribusiness 35 (4): 501–515. https://doi.org/10.1002/agr.21596
Hernández, J. L., S. Hwang, F. Escobedo, A. H. Davis, and J. W. Jones. 2012. “Land Use Change in Central Florida and Sensitivity Analysis Based on Agriculture to Urban Extreme Conversion.” Weather, Climate, and Society 4 (3): 200–211. https://doi.org/10.1175/WCAS-D-11-00019.1
Huang, K. M., Z. Guan, and A. Hammami. 2022. “The US Fresh Fruit and Vegetable Industry: An Overview of Production and Trade.” Agriculture 12 (10): 1719. https://doi.org/10.3390/agriculture12101719
Kim, H., M. Zansler, and L. A. House. 2018. “Retail Promotion with Price Cut and the Imperfect Price Responses of Orange Juice Demand in the US.” Agribusiness 34 (2): 363–376. https://doi.org/10.1002/agr.21523
Li, S., F., Wu, Z. Guan, and T. Luo. 2022. “How trade affects the US produce industry: The case of fresh tomatoes”. International Food and Agribusiness Management Review, 25(1), 121-133.
OEC. 2023. Available online at: https://oec.world/en/profile/hs/orange-juice-not-fermented-spirited-or-frozen#:~:text=Exporters%20and%20Importers&text=In%202021%2C%20the%20top%20importers,and%20United%20Kingdom%20(%24284M). Retrieved on 10/05/2023.
Rezazadeh, A. 2022. “Citrus Greening Myths and Facts.” UF-IFAS Blogs. Available online at: https://blogs.ifas.ufl.edu/stlucieco/2022/05/16/citrus-greening-myths-and-facts/
Singerman, A., and M. Burani-Arouca. 2018. “Harvesting Charges for Florida Citrus, 2017/18.”
Singerman, A., M. Burani-Arouca, and S. H. Futch. 2018. “The Profitability of New Citrus Plantings in Florida in the Era of Huanglongbing.” HortScience 53 (11): 1655–1663. https://doi.org/10.21273/HORTSCI13410-18
Statista. 2023. “Production Value of Oranges in the U.S. from 1999/2000 to 2022/2023 (in 1,000 U.S. dollars) *. Available online at: https://www.statista.com/statistics/193836/production-value-of-oranges-in-the-us-since-1999/. Retrieved on 10/05/2023.
Suh, D. H., Z., Guan, and H., Khachatryan. 2017. “The impact of Mexican competition on the US strawberry industry”. International Food and Agribusiness Management Review, 20(4), 591-604.
Tridge. 2023. “Fresh Orange.” Available online at: https://www.tridge.com/intelligences/orange/import. Retrieved on 10/05/2023.
US Bureau of Labor Statistics. 2023. “State Minimum Wage Laws.” Available online: https://www.dol.gov/agencies/whd/minimum-wage/state#:~:text=Basic%20Minimum%20Rate%20(per%20hour)%3A%20%2412.00,%2415.00%20on%20September%2030%2C%202026. Retrieved on 12/01/2023.
USDA-ERS (United States Department of Agriculture, Economic Research Service). 2023. Fruit and Tree Nuts Yearbook Tables. Available online at: https://www.ers.usda.gov/data-products/fruit-and-tree-nuts-data/fruit-and-tree-nuts-yearbook-tables/ . Retrieved on 10/05/2023.
USDA-FAS (United States Department of Agriculture, Foreign agricultural Service). 2023a. GATS portal. Available online at: https://apps.fas.usda.gov/gats/ExpressQuery1.aspx. Retrieved on 03/01/2023.
USDA-FAS (United States Department of Agriculture, Foreign agricultural Service). 2023b. “Chile: Citrus Semi-Annual.” Available online at: https://www.fas.usda.gov/data/chile-citrus-semi-annual#:~:text=In%20MY%202022%2F23%2C%20FAS,a%20decrease%20in%20freight%20costs. Retrieved on 10/05/2023.
USDA-FAS (United States Department of Agriculture, Foreign agricultural Service). 2022a. “Citrus in Chile.” Available online at: https://www.fas.usda.gov/data/chile-citrus-chile. Retrieved on 10/05/2023.
USDA-FAS (United States Department of Agriculture, Foreign agricultural Service). 2022b. “Mexico: Citrus Annual.” Available online at: https://www.fas.usda.gov/data/mexico-citrus-annual-7. Retrieved on 10/05/2023.
USDA-FAS (United States Department of Agriculture, Foreign agricultural Service). 2021. “Mexico: Citrus Annual.” Available online at: https://fas.usda.gov/data/mexico-citrus-annual-6. Retrieved on 12/01/2023.
USDA-NASS (United States Department of Agriculture, National Agricultural Statistics Service). 2023. Data and Statistics. USDA-NASS, Washington, DC. https://quickstats.nass.usda.gov/
Wu, F., and Z. Guan. 2021. “An Overview of the Mexican Blueberry Industry: FE1106, 12/2021.” EDIS 2021 (6). Gainesville, FL. https://doi.org/10.32473/edis-fe1106-2021
Wu, F., Z. Guan, and M. Garcia-Nazariega. 2018. “Comparison of Labor Costs between Florida and Mexican Strawberry Industries: FE1023, 12/2017.” EDIS 2018 (1). Gainesville, FL. https://doi.org/10.32473/edis-fe1023-2017
Wu, F., Z. Guan, and K. M. Huang. 2022a. “Protected Agriculture in Mexico: FE1124, 12/2022.” EDIS 2022 (6). Gainesville, FL. https://doi.org/10.32473/edis-fe1124-2022
Wu, F., Z. Guan, and K. M. Huang. 2022b. “The US Cucumber and Squash Industry: An Overview of Production and Trade: FE1125, 12/2022.” EDIS 2022 (6). Gainesville, FL. https://doi.org/10.32473/edis-fe1125-2022