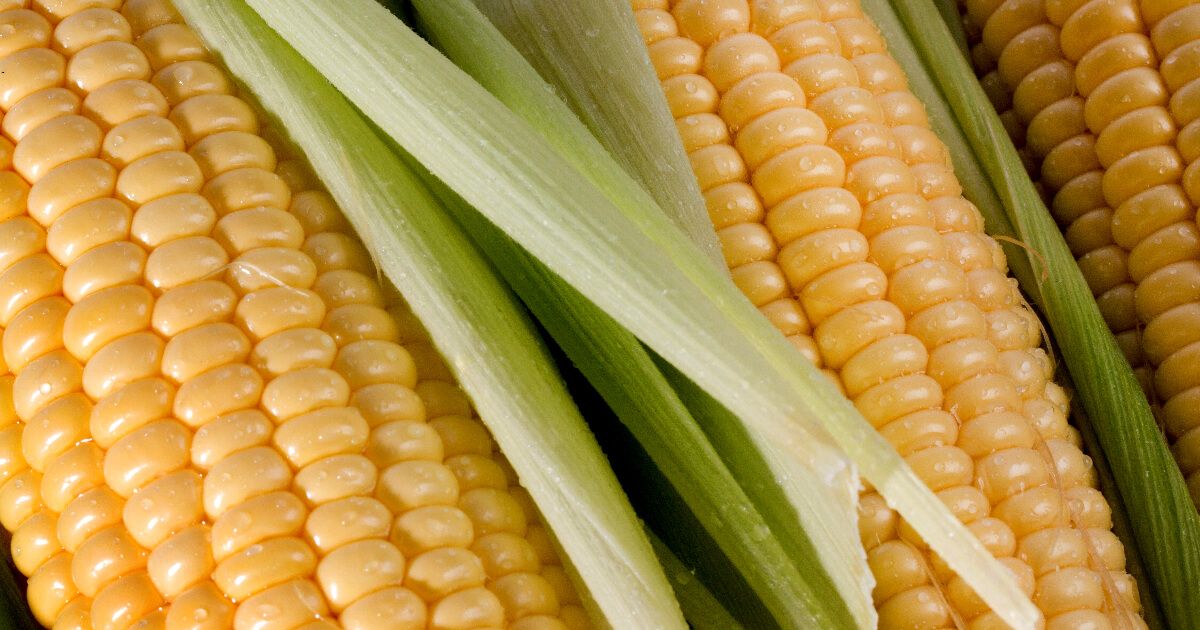
Credit: UF/IFAS Extension file photo
Introduction
Sweet corn is one of the top three vegetable crops in the United States in terms of harvested acreage and total production (USDA-NASS 2023); from 2014 to 2021, sweet corn was counted as one of the top three largest vegetable crops in terms of production in the United States (USDA-NASS 2014; 2015; 2016; 2017; 2018; 2019; 2020; 2021; 2022). In 2022, the value of the crop totaled $809 million, 22% more than in 2021 (USDA-NASS, 2023). Sweet corn is typically produced for fresh and processed consumption, where fresh market sweet corn accounts for more than 65% of the value of utilized sweet corn production (USDA-NASS 2023). In 2015, fresh market sweet corn was cultivated on approximately 242,090 acres (USDA-NASS). Most fresh market sweet corn is produced in California, Florida, Georgia, and New York. Most processed sweet corn is produced in Minnesota, Oregon, Washington, and Wisconsin (USDA-NASS 2018).
As with most commodities, seasonality of fresh market sweet corn can affect both planted acres and prices received. California mainly supplies the West Coast of the United States with fresh market sweet corn without major competitors, and the remaining states supply the East Coast, and often influence each other’s markets (Rettke, 2019). Florida is the main fresh market supplier for the East Coast from November through May.
Thanks to south Florida’s sub-tropical climate, fresh market sweet corn (hereafter referred to as sweet corn) can be grown there during the fall, winter, and spring when the climate in other states is not suitable for sweet corn production. However, from the end of May to late July, when increasing temperatures and rainfall decrease the profitability of sweet corn production in Florida, Georgia begins supplying the East Coast. Georgia’s planting timing and growing conditions can significantly affect Florida’s late-season market. For example, early plantings or hot weather in Georgia can increase supplies of fresh market sweet corn and decrease prices before Florida exits the market. Conversely, a freeze in Georgia can decrease the supplies of fresh market sweet corn and increase the price before Florida exits the market. Another major demand factor for Florida sweet corn is cold weather in key Northern markets. When spring temperatures in Northern markets remain low and consumers do not begin grilling food or buying foods they associate with warm weather, sweet corn among them, consumption declines, lowing the price growers receive.
In Florida, sweet corn is grown on 37,600 to 53,000 acres annually (USDA-NASS 2017a). Florida sweet corn growing seasons vary by region, with farmers in northern Florida planting from February to April, farmers in central Florida planting from January to April, and farmers in southern Florida planting from October to March (The Crop Profile/PMSP database 2007). In recent years, between 2017 to 2022, Florida growers harvested an average of 35,467 acres annually (USDA-NASS 2021), which is 19%, 37%, and 45% more than acres harvested in California, Georgia, and New York, respectively.
This publication provides information on conventional fresh market sweet corn acreage, volume, and pricing for the top four producing states: California, Florida, Georgia, and New York. (Other states produce a substantial amount of processed market sweet corn but are not the focus here.) This article is one in a series of publications on Ask IFAS that focus on trends in Florida’s five most economically important specialty crops (excluding citrus): fresh market sweet corn, bell peppers, tomatoes, watermelons, and strawberries. This information will be useful to producers, Extension agents, and others interested in trends concerning specialty crop commodities. This publication serves as a unique source summarizing important information about the specialty crop market and production trends.
Data
Data on acres harvested, price received, and production value per acre for fresh market conventional sweet corn were obtained from the United States Department of Agriculture National Agricultural Statistics Services (USDA-NASS). Averaged over the market year, these data allow us to show trends in sweet corn production and prices over time. To assess marketable fresh market sweet corn volume on a year-to-year basis, we examine truck shipment (movement) data from the USDA Agricultural Marketing Service (USDA-AMS). Movement data describes the volume of sweet corn transported domestically in 40,000-lb-capacity refrigerated trucks. These transportation data show movement across the Interstate highway system, from farms to distribution centers and destinations for international shipments. These transported data do not include sweet corn transported via box trucks or rail or by other means. Also, the volume shipped by 40,000-lb-capacity refrigerated trucks is not equivalent to the volume of sweet corn produced.
Yearly data for sweet corn from 2010 to 2022 was assessed for California, Florida, Georgia, and New York. Below we show trends of conventional sweet corn harvested acres, price per cwt (100 pounds), the value of production per acre, and the volume of sweet corn transported by 40,000-lb-capacity refrigerated trucks.
Harvested Acreage
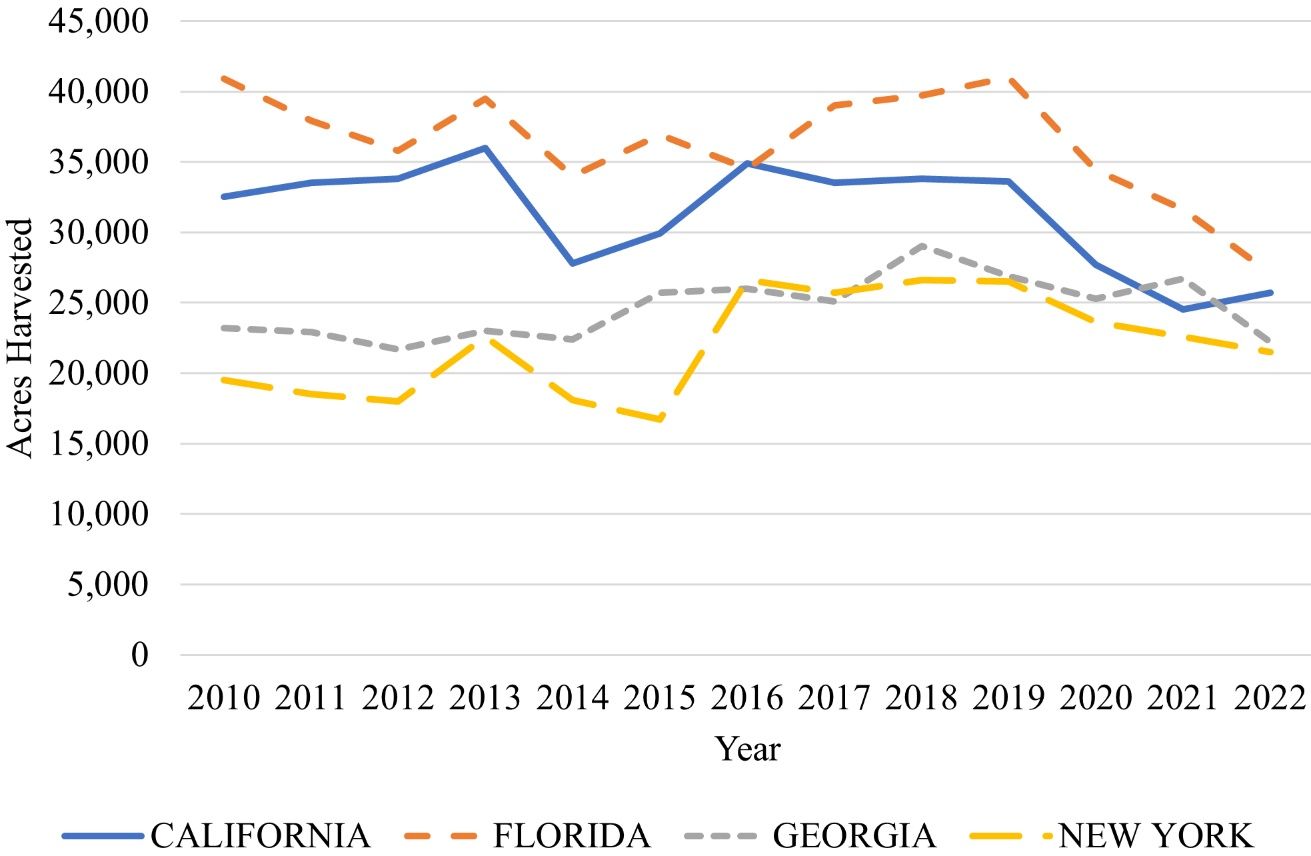
Over the past 13 years, Florida had the highest average fresh market harvested acres of sweet corn at 36,331 acres per year (Figure 2). Florida production peaked in 2019 and 2010 at 41,000 and 40,900 acres, respectively. A noteworthy decline in 2016 is attributed to extremely cold weather in the Northeast that greatly decreased demand for Florida sweet corn in key Northeast markets (personal communications with industry representatives). After 2019, acres harvested from Florida declined to an average of 31,033 acres from 2020 to 2022. This decline is attributed to a few factors, among them Florida sweet corn growers reacting to a decline in consumer demand and the increased supply of imports from Mexico and other countries during Florida’s marketing windows (personal communications with industry representatives). From 1970–2021, overall consumption of sweet corn by Americans decreased by 43% (Mitchell and Knuteson 2023). From 2000–2020, Mexico’s imports of sweet corn to the United States during Florida’s marketing window increased by 76% (FDACS 2021).
Credit: USDA-NASS 2017a
California followed Florida with 31,323 acres over the 13-year period and a peak in 2013. California observed declines in 2014 and after 2019 but saw a rise in 2022 at 25,700 acres. California’s 2021 decline in acres harvested is likely due to reported drought in most of the area of the state devoted to growing sweet corn (USDA-NASS 2022). Georgia observed uniform acres harvested, with peaks in 2018 and 2021. From 2010 to 2015, New York acres harvested were low, averaging 19,340 acres. However, after 2016, New York averaged 24,729 acres harvested; 27% more than the average of the previous six years.
Price Trends
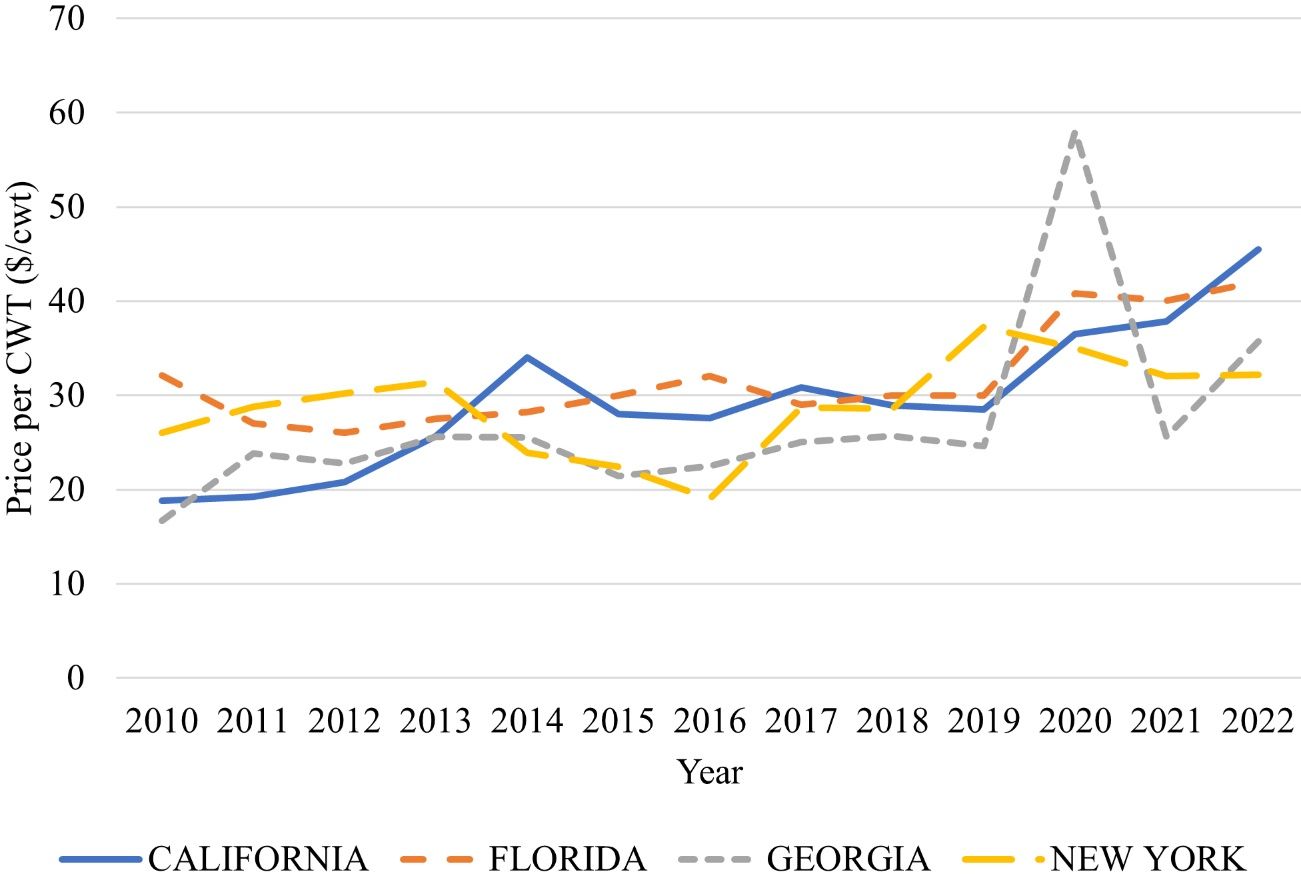
Price received by weight (Figure 3) was uniform over the past 13 years with an increase after 2019. Florida led all producing states in 2016 with a price of $32 per cwt. California, on the other hand, led all states on average from 2010 until mid-2017. After declining in 2015, New York growers’ price received increased dramatically from 2016 to 2019. In 2020, Georgia growers obtained the highest price at $58 per cwt. COVID-19 had a significant impact on the Georgia price that year. Georgia growers limited their planted acres after observing a decline in demand in Florida at the beginning of April 2020 because of COVID-19 shutdowns. When Georgia entered the market in May, restaurants were closed, consumers were eating most meals at home, and the limited acres meant that Georgia’s limited supply could not cover the increased demand, leading to a sharp increase in price (personal communications with industry representatives). The 2020 price increase in California could be attributed to lower production, although the state experienced warm weather conditions across sweet corn growing areas. (USDA-NASS 2021).
Credit: USDA-NASS 2017a
Value Per Acre
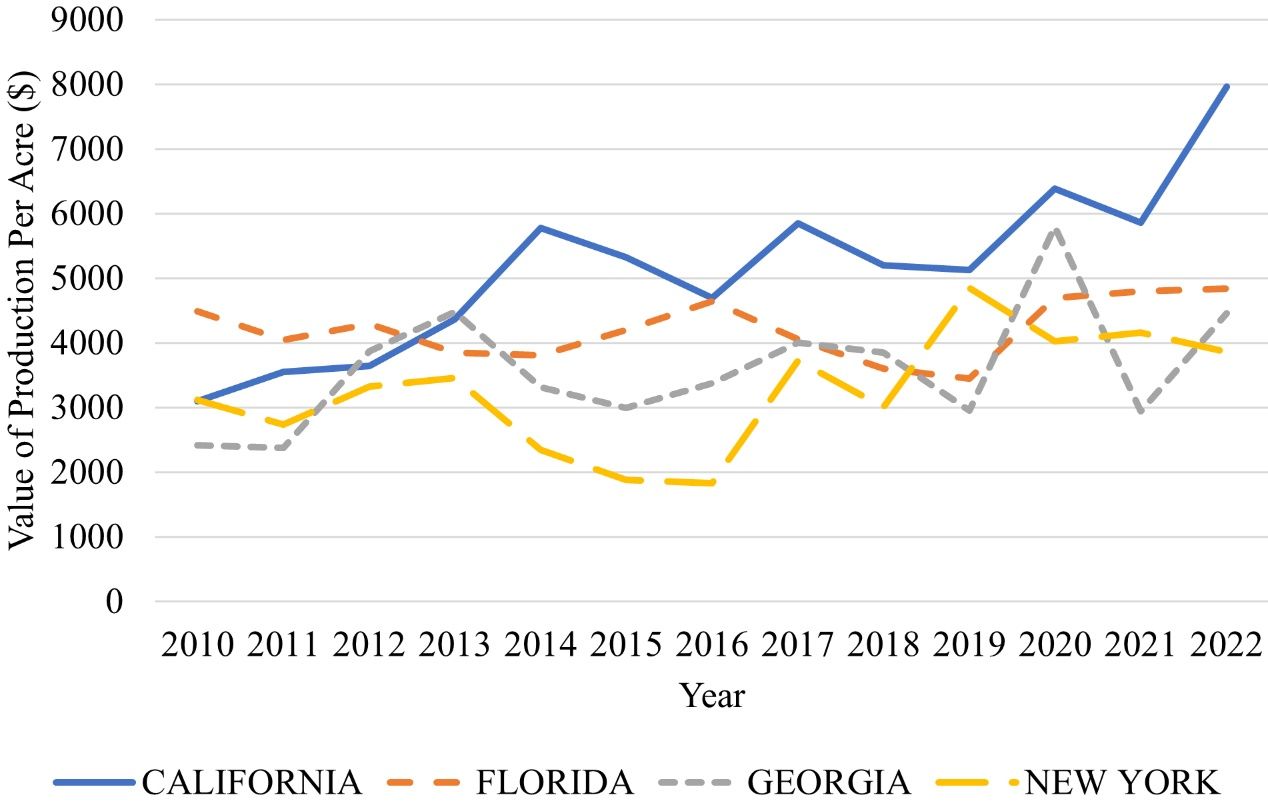
Florida leads the nation in fresh market sweet corn acres harvested, while California leads in value of production per acre (Figure 4). Over the 13-year period, California earned an average of $5,142 per acre with peaks in 2020 and 2022 at $6,388 and $7,963, respectively. California’s average per-acre value of production over the 13-year period was 22%, 43%, and 58% more than Florida’s, Georgia’s, and New York’s, respectively. This is because California’s yield was 31%, 28%, and 58% higher than yields in Florida, Georgia, and New York, respectively (data not shown here). Florida growers earned the highest value of production from 2010 to 2012. After 2012, Florida earned the highest values of production per acre in 2021 and 2022. In 2019, Florida observed the lowest value earned by the state at $3,450 per acre. Georgia’s $58 per cwt in 2020 increased the state’s value per acre to $5,800; a 96% increase from 2019. New York’s value of production per acre rose in 2017 after declines from 2013 to 2016. The highest value of production per acre earned by New York was in 2019 at $4,849; New York averaged $3,939 per acre from 2017 to 2022.
Credit: USDA-NASS 2017a
Volume Shipped
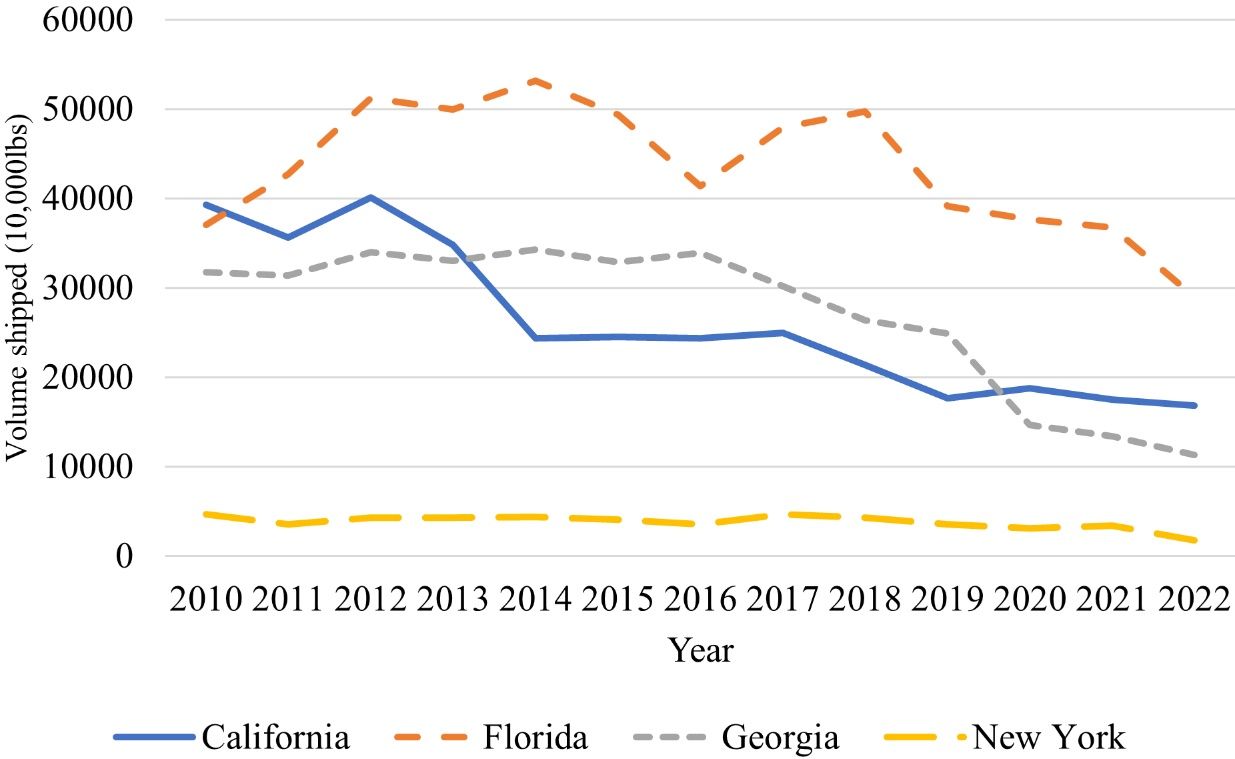
Figure 5 shows the volume of fresh market sweet corn shipped in 40,000-lb-capacity refrigerated trucks. Like acres harvested, volume shipped declined over the 13-year period. Florida averaged 43.5 million lb shipped, this is 66% more than the volume shipped from California and 60% more than the volume shipped from Georgia. Over the 13-year period, Florida sweet corn growers shipped more than 10 times the sweet corn New York growers shipped in the same period. Decreases in Florida’s volume shipped are attributed to the same factors that caused the decline in harvested acres: a perceived decrease in consumer demand and an increase in imports from countries like Mexico during the Florida shipping season (personal communications with industry representatives; FDACS 2021).
Credit: USDA-AMS
Over the 13-year period, California averaged 26 million lb of sweet corn shipped per year with a high of 40.1 million lb in 2012. Georgia growers shipped more sweet corn than California growers between 2014 and 2020. This contrasts with acres harvested during the same period: California growers consistently harvested more acres than Georgia growers. Much of California’s sweet corn is marketed within the state—at farmers’ markets, roadside stands, and direct to retail in major metropolitan cities within the state (Smith et al. 1997). Much of California’s sweet corn, therefore, may not require transportation via 40,000-lb-capacity refrigerated trucks. Georgia shipped an average of 27 million lb of sweet corn per year, 3.5% more than California. Georgia peaked at 34.3 million lb in 2014. The volume shipped from New York was uniform, with an average of 3.8 million lb. Since these data are only for 40,000-lb-capacity refrigerated trucks, and New York is a major terminal market, we do not anticipate observing high volumes of sweet corn shipments from that state.
Summary
The trends shown here indicate that though demand for sweet corn decreased over the past 13 years, Florida remains a top producer of fresh market sweet corn supplying the East Coast and Northern markets. Seasonality affects supply and demand and plays a large role in acres harvested and prices received. All states showed a decline in acres harvested between 2019 and 2022, with 2022 values for Florida, California, Georgia, and New York being 34%, 24%, 17%, and 19% less than 2019 values, respectively. Though Florida growers have the largest harvested acres and typically receive higher prices, they lag California growers in terms of per-acre value of production. This is driven by the higher yields observed on California farms (data not shown here).
The 2020 COVID-19-related shutdowns had a meaningful effect on prices received in Georgia, Florida, and California. Prices increased as more people dined at home. For Georgia in particular, the price received for fresh market sweet corn more than doubled from 2019 to 2020. Generally, more recent price increases could be associated with inflationary factors in the macroeconomy, as we see similar trends in other commodities. This publication, however, does not distinguish between price increases caused by inflation and those caused by other issues, like changes in supply.
Acknowledgments
This work is supported by the USDA National Institute of Food and Agriculture, Specialty Crops Research Initiative project award 2019-51181-30010 and the Multi-State Hatch FL-SWF-005724, “Economic Valuation and Management of Natural Resources on Public and Private Lands (W5133).”
References
Florida Department of Agriculture and Consumer Services-Division of Marketing and Development. 2021. Mexico’s Ag-Export Impacts on Florida Agriculture. FDACS.
Rettke, D. 2019. “California Sweet Corn Production Moves into Central Valley.” Fresh Plaza. Accessed on March 5, 2024. Available at https://www.freshplaza.com/north-america/article/9117190/california-sweet-corn-production-moves-into-central-valley/
Smith, R., J. Agular, and J. Caprile. 1997. Sweet Corn Production in California. University of California Agriculture and Natural Resources. Available at https://doi.org/10.3733/ucanr.7223
The Crop Profile/PMSP database. 2007. Crop Profile for Sweet Corn in Florida. https://ipmdata.ipmcenters.org/documents/cropprofiles/FLsweetcorn2007.pdf
USDA Agricultural Marketing Service. 2020. Specialty crop 10,000 lb. movement. USDA-AMS, Washington, DC. https://marketnews.usda.gov/mnp/fv-report-config-step1?type=movement
USDA National Agricultural Statistics Service. 2015. Vegetables 2014 Summary. USDA-NASS, Washington, DC. https://downloads.usda.library.cornell.edu/usda-esmis/files/02870v86p/b2773z217/br86b639p/VegeSumm-01-29-2015.pdf
USDA National Agricultural Statistics Service. 2016. Vegetables 2015 Summary. USDA-NASS, Washington, DC. https://downloads.usda.library.cornell.edu/usda-esmis/files/02870v86p/n009w4740/9c67wq616/VegeSumm-02-04-2016.pdf
USDA National Agricultural Statistics Service. 2017a. NASS - Quick Stats. USDA National Agricultural Statistics Service. https://quickstats.nass.usda.gov
USDA National Agricultural Statistics Service. 2017b. Vegetables 2016 Summary. USDA-NASS, Washington, DC. https://www.nass.usda.gov/Publications/Todays_Reports/reports/vegean17.pdf
USDA National Agricultural Statistics Service. 2018. Vegetables 2017 Summary. USDA-NASS, Washington, DC. https://www.nass.usda.gov/Publications/Todays_Reports/reports/vegean18.pdf
USDA National Agricultural Statistics Service. 2019. Vegetables 2018 Summary. USDA-NASS, Washington, DC. https://downloads.usda.library.cornell.edu/usda-esmis/files/02870v86p/gm80j322z/5138jn50j/vegean19.pdf
USDA National Agricultural Statistics Service. 2020. Vegetables 2019 Summary. USDA-NASS, Washington, DC. https://www.nass.usda.gov/Publications/Todays_Reports/reports/vegean20.pdf
USDA National Agricultural Statistics Service. 2021. Vegetables 2020 Summary. USDA-NASS, Washington, DC. https://downloads.usda.library.cornell.edu/usda-esmis/files/02870v86p/j6731x86f/9306tr664/vegean21.pdf
USDA National Agricultural Statistics Service. 2022. Vegetables 2021 Summary. USDA-NASS, Washington, DC. https://downloads.usda.library.cornell.edu/usda-esmis/files/02870v86p/zs25zc490/9593vz15q/vegean22.pdf
USDA National Agricultural Statistics Service. 2023. Vegetables 2022 Summary. USDA-NASS, Washington, DC. https://downloads.usda.library.cornell.edu/usda-esmis/files/02870v86p/hq37x121v/4b29ck28c/vegean23.pdf