From May to October, 2016, an urban forest ecological analysis was conducted within the city of Gainesville in partnership with the city's Parks, Recreation, and Cultural Affairs Department. Researchers established 177 permanent sample plots within Gainesville's city limits (Figure 1) to quantify the vegetation structure, functions, and values of the urban forest. These locations were documented for future inventories to monitor changes in Gainesville's urban forest structure and assess how these changes may impact the functions the forest provides.
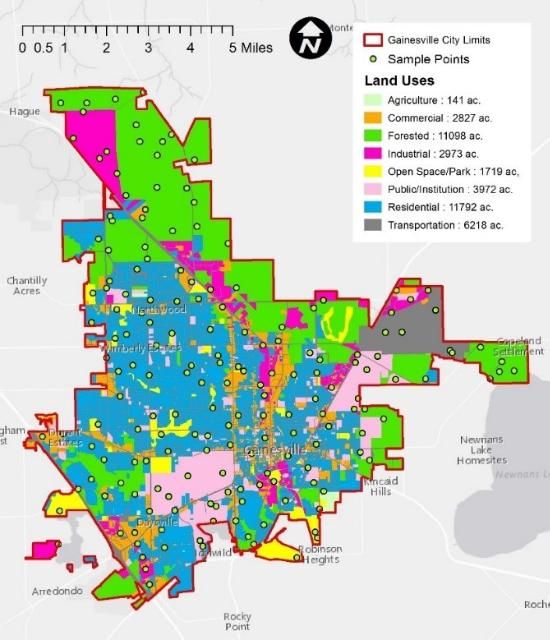
The purpose of this urban forest ecological analysis is to quantify the composition, structure, and benefits of Gainesville's urban forest. Results from this type of assessment can serve as the basis for: 1) enhancing the understanding of urban forest values, 2) improving or developing urban forest policies, 3) ensuring effective urban forest planning and management, and 4) providing empirical data for the inclusion of trees within environmental regulations.
Within each plot, the field crew recorded data such as diameter of trees at breast height (4.5'; DBH), tree height, species identification, crown widths, condition assessments, crown light exposure, proximity of trees to buildings, shrub measurements, and groundcover distribution. The team used the i-Tree Eco model developed by the U.S. Forest Service to calculate values from this data for variables such as species diversity; species origin and abundance; tree density; diameter distribution; tree, shrub and ground covers; and leaf area (i-Tree 2010).
Differences from Tree Canopy Studies
In many urban forest assessments, researchers and managers only quantify the amount of tree canopy cover in the city. While this is a useful approach, it does not provide information about the vegetation below the canopy. Our assessment divided the forest into three vertical layers, or strata, at every sample plot: tree, shrub, and ground cover (Table 1).
Description of each vertical stratum of the urban forest included in the i-Tree Eco sampling methodology.
Composition
The composition of the forest refers to the species that make up the forest. Gainesville is located in temperate north Florida. Many of the plant species found in Gainesville are specific to this climate zone (Plant Hardiness Zone 9a: average annual extreme minimum temperatures between 20°F to25°F) and are not found further south in the sub-tropical regions of the state. Typical forest types in this region include mixed pine and mixed hardwood uplands and cypress/gum wetlands. Remnants of these forest types were found within the city limits. Pine plantations managed for timber are common in northern Florida, and the city of Gainesville contains some actively managed pine plantations.
Diversity
For the purpose of this study, species diversity is the number of species present. Diversity can be used as an indicator for vulnerability or resilience to insect and disease outbreaks and natural disturbances such as drought and high wind events. In this study, 173 species were identified in Gainesville. Of these, 97 species were identified in the tree stratum and 153 species in the shrub stratum. The land-use category with the greatest diversity is residential (70 species), because homeowners typically plant a broader suite of tree species than may be found in other urban areas. The land-use category with the lowest number of species is industrial (21 species). By comparison, 42 tree species were identified in the forested land-use category.
Tree Population
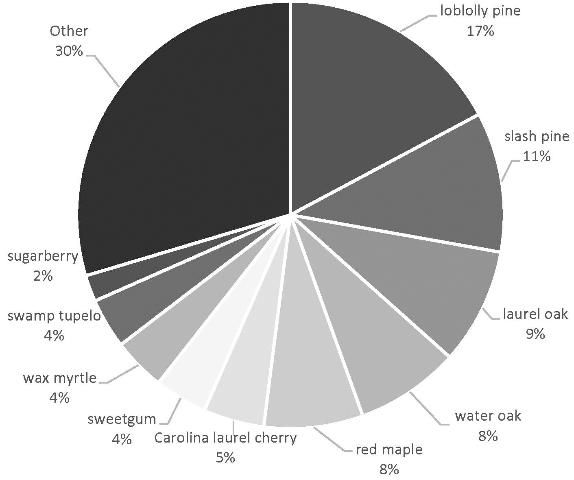
There are an estimated 7.2 million trees in Gainesville and a total of 97 species. The 10 most common tree species, representing 70% of the population are loblolly pine (Pinus taeda), slash pine (Pinus elliottii), laurel oak (Quercus laurifolia), water oak (Quercus nigra), red maple (Acer rubrum), Carolina laurel cherry (Prunus caroliniana), sweetgum (Liquidambar styraciflua), wax myrtle (Morella cerifera), swamp tupelo (Nyssa biflora), and sugarberry (Celtis laevigata) (Figure 2). All of these species are common in natural plant communities found in this geographical region. For the purpose of this study, we defined a "natural plant community" as one described by the Florida Natural Areas Inventory (FNAI). Loblolly and slash pines represent 28% of the trees in this inventory due to the large acreage of pine plantations within the city. Understanding species composition can help managers anticipate the impacts of possible disturbances. For example, loblolly and slash pines are susceptible hosts for bark beetles, which have the potential to be a problem in certain years. Relative to other cities in Florida, it is notable that Gainesville's urban forest is not dominated by any invasive tree species.
Native and Non-Native Tree Species
Of the 97 tree species identified in Gainesville, 65 are native to Florida, meaning they were found in Florida before European colonization in the 16th century. The remaining 32 species are non-native, meaning they were introduced outside of their native ranges. Of these non-native species, six were listed by the Florida Exotic Pest Plant Council (FLEPPC 2016) as invasive: mimosa (Albizia julibrissin), paper mulberry (Broussonetia papyrifera), camphor (Cinamomum camphora), glossy privet (Ligustrum lucidum), jambolan plum (Syzigium cumini), and Chinese tallow (Triadica sebifera). Invasive species are those that spread into and dominate an area and harm the ecological functions of the forest. Although other invasive species were found in the shrub and ground cover strata, the i-Tree sampling scheme does not capture the cover of these species.
Structure
Forest structure is the distribution of vegetation both horizontally and vertically. The following physical attributes of the forest were measured and calculated to determine forest structure: tree density, diameter distribution, urban forest cover, and leaf area. These metrics were ultimately used to quantify the ecological functions of Gainesville's urban forest.
Tree Stratum
Tree Cover
Tree canopy cover is used to quantify the amount of land area under and around trees. Sometimes thought of as the "footprint" of the urban forest, ecologically, canopy cover influences microclimate (e.g., shade in parking lots and on homes) as well as the interception of rainfall (reducing stormwater flow) and air pollution abatement (Leff 2016).
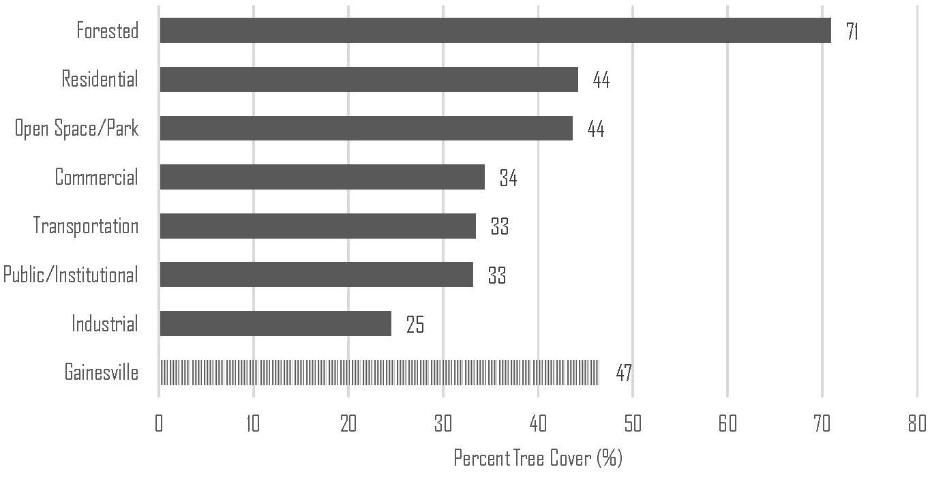
Based on Eco sample plot data collected, the estimated average tree canopy cover of Gainesville is 47%, but it is spatially variable across land uses (Figure 3). Tree cover is greatest in forested areas (71%) and lowest in industrial areas (25%).
Diameter Distribution of Trees
The diameter distribution of live trees in Gainesville is skewed toward smaller-diameter classes (Figure 4). However, species within each class grow at different rates and have different maximum size potentials. For example, wax myrtle (Morella cerifera), which makes up 10% of the 1–3" diameter class, grows quickly but has a small maximum diameter and is short-lived. Loblolly pine (Pinus taeda), however, grows quickly but has a large maximum diameter and is longer-lived. By comparison, live oak (Quercus virginiana), which makes up 25% of the largest-diameter class grows relatively slowly, has the potential to get large, and is very long-lived. Only four of the 97 species identified in the city make up the largest-diameter class (>30"), and 3 of those 4 are not present in the species that make up the majority of the smallest-diameter class.
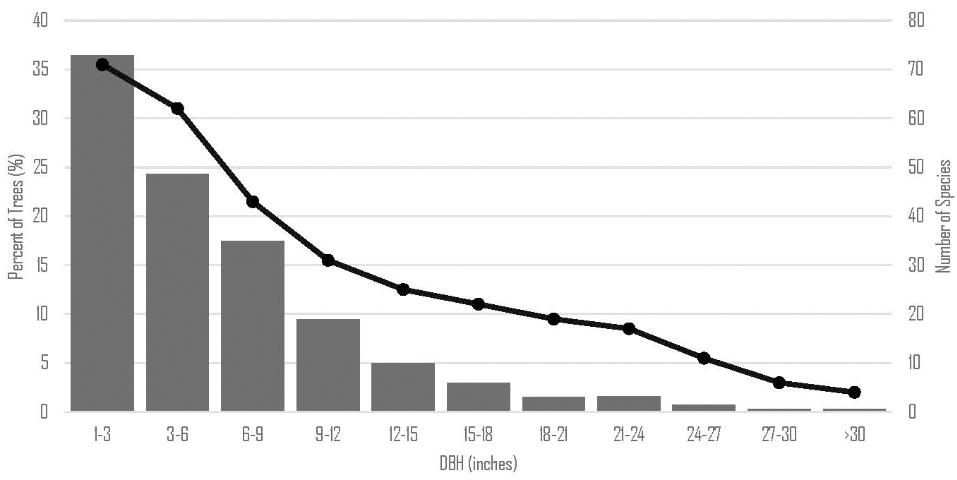
For example, live oaks make up 25% of the largest-diameter class, but less than 0.1% of the smallest-diameter class. These species-level results within each diameter class can help managers plan for the future. Having both large- and small-diameter trees within species is essential to the health and longevity of the urban forest. An urban forest with variation in tree size and species composition is generally better suited to support a variety of ecosystem services (Andreu et al. 2008).
Shrub Stratum
Shrub cover is often overlooked and undervalued as a component of the urban forest. Like tree cover, it is an estimate of the amount of area in the urban forest covered by the shrub stratum. Shrubs provide additional leaf area and some of the same benefits as trees. Because the tree and shrub layers are in overlapping strata, their cover estimates are not additive.
Groundcover Stratum
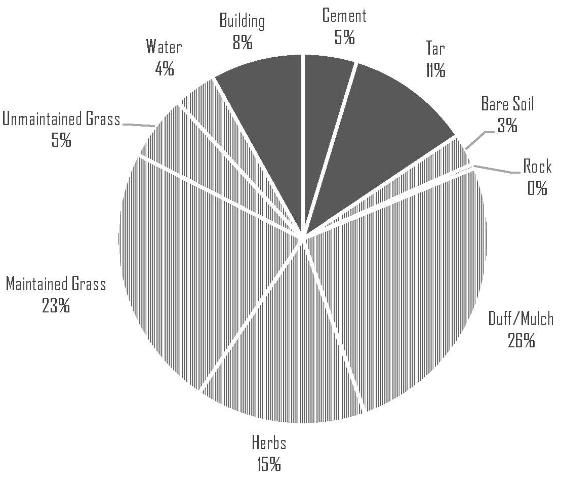
The groundcover stratum is made up of the species and surfaces covering the ground including herbaceous and woody vegetation less than 1 foot tall. Groundcover is divided into two broad categories: impervious (e.g., roads, rooftops, and sidewalks) and pervious (e.g., lawns, gravel driveways, mulched beds, and ponds) surfaces. The groundcover type likely determines whether rainfall will seep into the ground or be diverted as stormwater runoff.
Urbanization tends to increase the amount of impervious surface area in a city. In Gainesville, 23% percent of the groundcover is impervious (Figure 5). The land-use areas with the greatest amount of impervious surfaces are commercial (66%), residential (38%), and transportation (32%). The land-use categories with the greatest amount of pervious ground cover are forested (99%) and open space/park (97%). Pervious surfaces were divided into seven categories (maintained grass, unmaintained grass, duff/mulch, herbs, bare soil, water, and rock). Each of the seven has different hydrological impacts (Figure 5). Much of the pervious surfaces in Gainesville are classified as maintained grasses or lawns (23%). In Florida approximately "one-third of the freshwater use is for municipal use, half of which is used to water lawns" (Cervone 2003). The land-use categories with the highest percentage of maintained grass are transportation (36%), public/institutional (34%), and residential (34%). However, grasses in the transportation land-use category are likely maintained by mowing, but are less likely to be irrigated than in grasses in the public/institutional or residential land-use categories.
Summary
Trees in cities were formerly thought of merely as a collection of individuals found along streets and incorporated into landscaping. However, urban trees are now viewed as being part of a unique forest type and understanding the urban forest's structure and composition is an important first step towards managing it. This analysis aims to provide a broader understanding of the city of Gainesville's forest.
The first step toward the goal of improving the health and sustainability of a city's urban forest is for that city to understand its current urban forest: what species make up the forest in what percentages, the overall age and health of the forest, the various services the forest performs, and how well it is able to perform them. The next steps toward creating a forest management plan for that urban forest include answering questions to determine what the city wants for its forest and how it will act to achieve those goals. The purpose of this document is to help complete the first step: what sort of urban forest do we have in the city of Gainesville? From this picture of the structure and composition of Gainesville's urban forest, the i-Tree Eco model quantifies the services and values of the urban forest for a deeper understanding of what benefits it is providing the city. With this understanding, management strategies can be tailored to provide the services that benefit our community.
The content of this fact sheet was derived from the "City of Gainesville Urban Forest Ecological Analysis 2016." The full report can be viewed via this link: https://waterinstitute.usf.edu/upload/documents/GNV-ECO-Report-2016.pdf
References
Andreu, M. G., D. Fox, S. Landry, R. Northrop, and C. Hament. 2017. Urban Forest Ecological Analysis. Report to the City of Gainesville, March 2017. City of Gainesville, Florida.
Cervone, S. 2003. Aquifers. Retrieved from Center for Aquatic and Invasive Plants, University of Florida and the Bureau of Invasive Plant Management, Florida Department of Environmental Protection: http://plants.ifas.ufl.edu/guide/aquifers.html
Florida Exotic Pest Plant Council Invasive Plant Lists. 2016. Retrieved from FLEPPC.
FNAI Guide to the Natural Communities of Florida. 2010. Florida Natural Areas Inventory.
i-Tree. 2010. i-Tree: Tools for Assessing and Managing Community Forests. https://www.itreetools.org
Leff, M. 2016. The Sustainable Urban Forest—A Step by Step Approach. Philadelphia: Davey Institute/USDA Forest Service.