Introduction
A topographic map provides both a) a detailed and accurate representation of cultural and natural features on the ground and b) a quantitative representation of relief, usually using contour lines. Therefore, it can be used to address spatial questions in disciplines related to natural resources, hydrology, forestry, agriculture, or ecology. A topographic map is typically published as a map series, made up of two or more map sheets called quadrangles. The map sheets are then combined to form the whole map. In 1879, the USGS (United States Geological Survey) began to map the topography of the United States. This mapping was done at different levels of detail to support land use specific to a geographic area. USGS produced new map versions of each area at semi-regular time intervals. US Topo maps are the current generation of USGS topographic maps. The first of these maps were published in 2009. They are modeled on the legacy 7.5-minute series of the mid-20th century. Unlike traditional topographic maps, the US Topo product is automatically generated from national map databases and updated every three years for all 48 of the contiguous United States, Hawaii, and the United States territories. They are published as freely available geospatial PDF documents that facilitate coordinate readings and spatial measurements (e.g., distance, area) through built-in georeferencing technology. This publication is intended for practitioners and an academic audience that is familiar with basic principles of cartography such as map scale or geographic coordinates (i.e., latitude, longitude).
Why topographic maps?
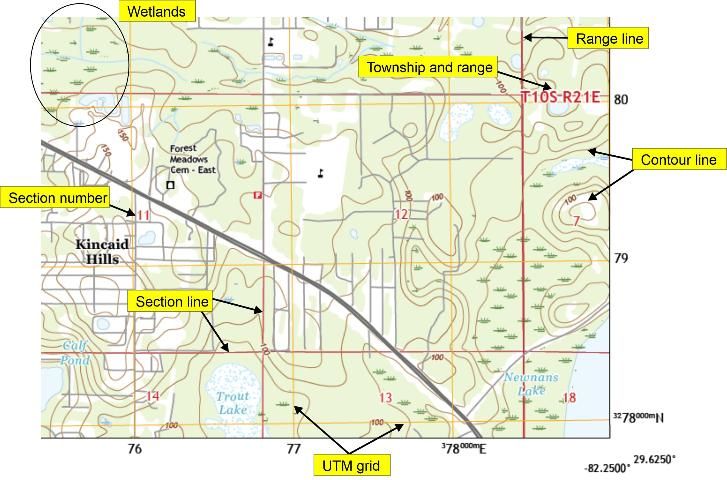
The advent of online mapping platforms (e.g., Google Maps, Bing Maps) and 3D global image viewer programs (e.g., Google Earth) has transformed the way users can access spatial information. In particular, high-resolution satellite images, thematic data layers including points of interest (POI), and point coordinates or elevations are all easily accessible. Previously, this spatial information was only found in topographic paper maps. Therefore, the widespread change in mapping technology raises the important question of the relevance of topographic maps in today's digital information era. Whereas online mapping platforms have undoubtedly increased the availability of maps on all kinds of electronic devices (e.g., tablets, smartphones, laptops), topographic maps still fill an important niche by providing valuable information and functionality relative to online maps. For example, when US Topo quadrangles are downloaded as Portable Document Format (PDF) documents, they are available offline to provide backup maps in case of signal data loss in the field. In addition, all layers can be turned on and off in these PDF documents. This allows users to customize the map content and complexity of the map depending upon application (e.g., hydrology and forestry projects benefit from visualization of different map layers). Furthermore, US Topo quadrangles provide spatial data layers, which are not commonly found in online maps or mapping applications. Figure 1 visualizes some of these topographic and thematic layers on a US Topo quadrangle. Contour lines are a standard topographic layer available in US Topo maps that are not typically found in online mapping platforms. Likewise, the following thematic layers are standard in US Topo Maps but less frequently accessible online: a) wetlands, b) the Public Land Survey System (PLSS) with township lines, range lines, section lines, and section numbers, and c) projection-related reference layers, such as the UTM (Universal Transverse Mercator) grid, to visualize easting and northing coordinates across the mapped area.
Geographic Coordinates and Map Scale
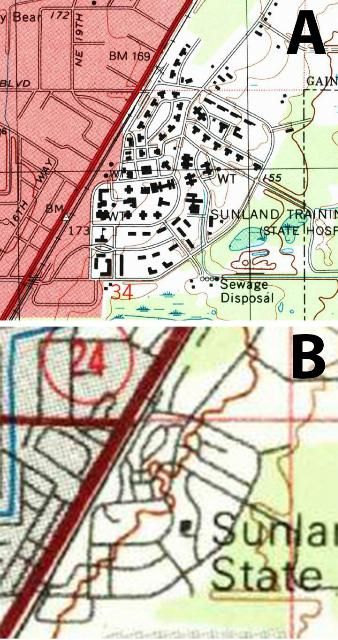
The spatial arrangement and size of map sheets for the different topographic map series are guided by map scale and geographic coordinates. Therefore, this section provides a brief introduction to these concepts. A map scale is the ratio of a distance on the map to the corresponding distance on the ground. It is commonly expressed as a verbal statement (e.g., one inch equals five miles), an equivalence (e.g., 1 inch = 5 miles), a representative fraction (e.g., 1:24,000), or a graphic bar scale (see Figure 7 for an example on a US Topo map). Large scale maps (e.g., 1:10,000) show features larger than small scale maps, provide more details, and map a smaller geographic area. By contrast, maps with a smaller scale (e.g., 1:100,000) make each feature look smaller than on large scale maps, apply heavier cartographic generalization (i.e., simplify the representation of features), and map a larger geographic area. Figure 2 juxtaposes the same area mapped on a 1:24:000 topographic map from 1994 (A) and a 1:100,000 topographic map from 1981 (B). The level of detail (e.g., buildings, road layout) is clearly higher in the larger scale (1:24,000) map on the top.
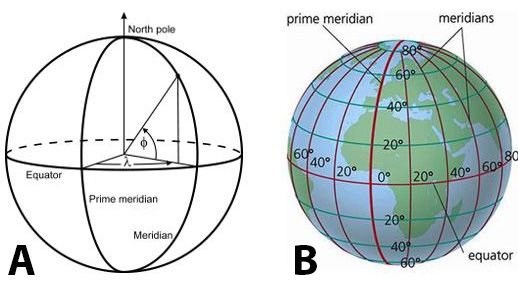
The definitions of geographic latitude and longitude are indirectly based on the fact that the earth constantly spins on a rotation axis. Although the orientation of the rotation axis changes slightly relative to the earth's crust over time, the axis serves as a natural line of reference. The two points on the earth's topographic surface that are located at the ends of the rotation axis are the north and south geographic poles. The equatorial plane is a plane at a right angle to the rotation axis that goes through the point on the rotation axis that divides the earth into a northern and a southern hemisphere (Figure 3A). For simplicity in the remaining definitions, a spherical earth model is used to approximate the shape of the earth. A great circle is a circle on the surface of the sphere formed by the intersection of the sphere with a plane that passes through the center of the sphere. A great circle divides a sphere into two hemispheres. The equator is a special great circle that divides the earth into a northern and a southern hemisphere. Meridians are a special group of great circles, namely those that pass through the north and south geographic poles. The prime meridian is the meridian from which other meridians are reckoned. The only differentiating characteristic of the prime meridian is that it passes through the Royal Observatory in Greenwich, UK (Figure 3B).
For the spherical earth model, the angle measured up or down from the equator along a meridian to the point of interest is latitude (Figure 3A). It is positive or reckoned North (N) in the northern hemisphere and negative or reckoned South (S) in the southern hemisphere and often denoted by the small Greek letter phi (φ). Longitude, denoted by the small Greek letter lambda (λ), is an angle in the equatorial plane measured from the prime meridian to some other meridian of interest. The angle of longitude can be reckoned either east or west.
A small circle is a circle on the surface of the sphere formed by the intersection of the sphere with a plane that does not pass through the center of the sphere. Parallels are a specific group of small or great circles that connect all locations around Earth at a given latitude. Selected parallels are shown in blue in Figure 3b. The equator is the only parallel that is a great circle; all other parallels are small circles. Because each point on a parallel has the same latitude, parallels are also called lines of latitude. Correspondingly, because each point on a meridian has the same longitude, meridians are also called lines of longitude.
Credit: quora.com
USGS Topographic Map Collections
USGS topographic quadrangle maps are divided into two product types:
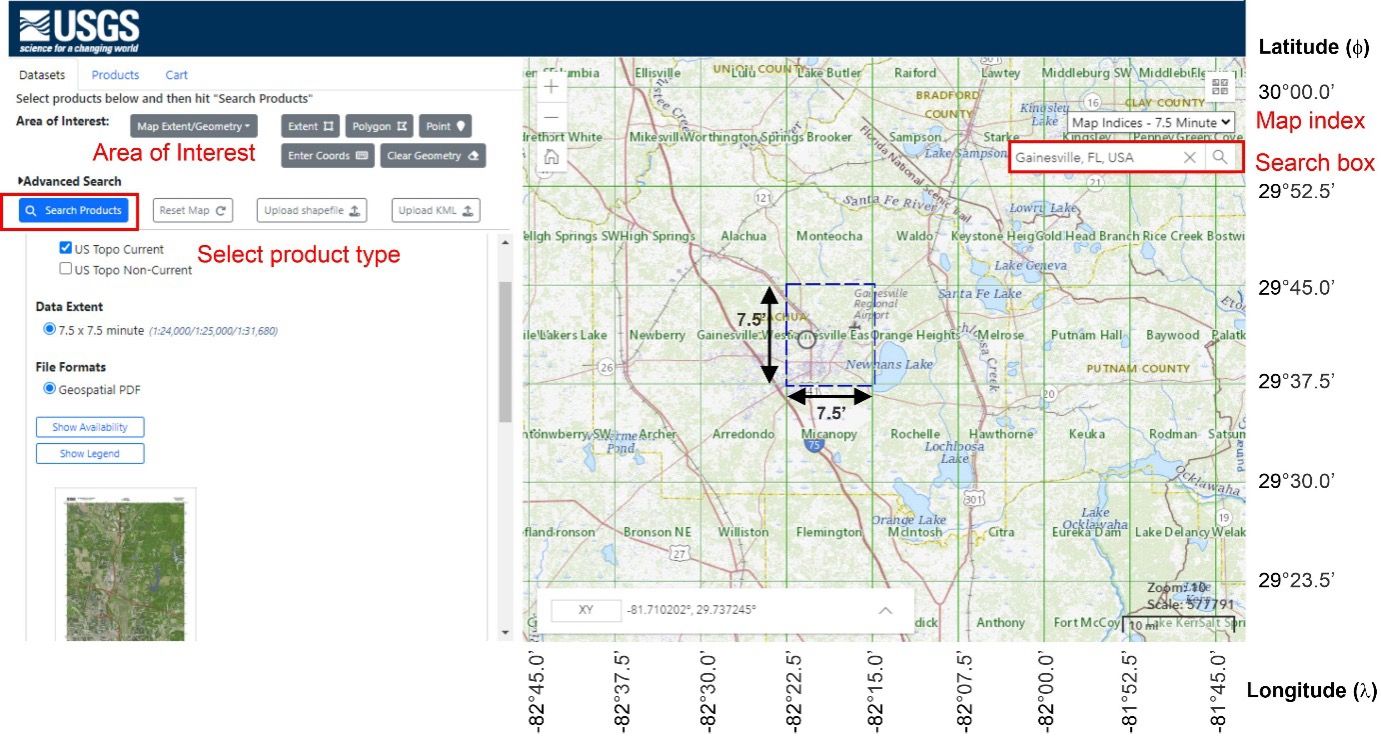
- US Topo refers to USGS topographic maps published as digital documents in 2009 and later. This current topographic map series uses a 1:24,000 map scale in its printed form. A US Topo quadrangle covers 7.5 minutes (') in latitude and longitude; therefore, the US Topo system is arranged as a 7.5' x 7.5' grid across the United States. Figure 4 shows this layout for the area around Gainesville, FL. US quadrangles are individual map sheets that are laid out as four-sided figures. Each side is bounded by lines of latitude and longitude. This set of lines is called the projection line. The dashed lines in Figure 4 visualize the projection line for the Gainesville East quadrangle.
- The Historical Topographic Map Collection (HTMC) is a set of scanned images of USGS topographic quadrangle maps originally published as paper documents from 1884 to 2006. They come in smaller map scales (e.g., 1:250,000 or 1:62,500). Therefore, each map sheet covers a larger area than a US Topo quadrangle. As a historical map archive, the HTMC can be used for numerous temporal analyses such as finding names of natural and cultural features that have changed over time.
Obtaining USGS Topographic Maps
Both the US Topo series and HTMC maps are offered free of charge for download through various websites. Map formats vary by web portal and include the following:
- Geospatial PDF files are PDF files with a geospatial extension that provides limited spatial functionality (e.g., displaying ground coordinates, measuring distances/areas).
- GeoTIFF files are compressed, Tagged Image File Format (TIFF) images with embedded georeferencing information so that the map can be displayed in a Geographic Information System (GIS).
- KMZ files are Keyhole Markup Language Zipped (KMZ) files used for displaying a map in Google Earth.
- JPG files are non-georeferenced, Joint Photographic Experts Group images useful for getting a quick view of the map in order to find place names or simply explore the map area.
The most common web portals to obtain USGS topographic maps (together with their download formats) are:
- The National Map: Geospatial PDF
- USGS Store: Geospatial PDF
- TopoView: Geospatial PDF, GeoTIFF, KMZ, JPG
As an example, Figure 4 illustrates procedural steps for finding and downloading a US Topo quadrangle from The National Map Download Client.
- Select Product Type: In the product list in the left window, check the box for US Topo. This expands the options for US Topo quadrangles and allows the user to select current or non-current maps. Historical topographic maps (with varying scales and map extents) can be selected when checking the box below.
- Define an Area of Interest: There are two methods to hone in on the general Area of Interest (AOI) by either using a) the Map Extent/Geometry option or b) the Selectable Polygon option.
- Map Extent/Geometry: Select the "Map Extent/Geometry" option in the drop-down menu in the left panel, where one can use pan and zoom tools on the map window to the right. AOI refinement is achieved by a) drawing a bounding box, b) drawing a point, c) defining a search window by typing in latitude/longitude coordinates, or d) typing in a place name in the search box. Figure 4 demonstrates the use of the search box for Gainesville, FL.
- Selectable Polygon: Select the "Selectable Polygon" option in the drop-down menu in the left panel to activate a predefined map layer of administrative boundaries (e.g., state, county). Select the polygon of interest through a mouse click on the map.
- Map Index: To get a better overview of the system layout, standard map cell grids can be turned on by choosing an option from the Map Index drop-down menu in the map. The Gainesville example shows the 7.5-minute index in green rectangles.
- Search Products: With at least one product type selected and a point or AOI defined, click the Search Products button to the left. The application then displays a list of all products found. For each product instance, several options are subsequently offered, including display the footprint, display more information, zoom to, and download.
Map Layers
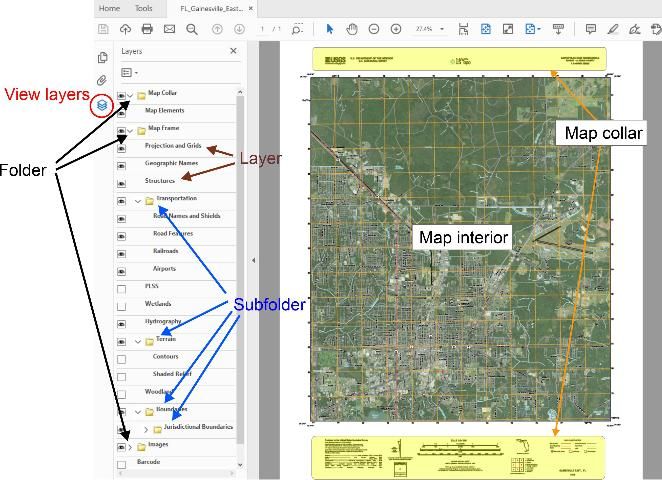
After downloading the PDF map, the US Topo quadrangle can be opened in any PDF viewer, such as Adobe Acrobat Reader or Adobe Acrobat Pro. It is recommended to use the latest version to display a PDF map. Figure 5 shows a screenshot of a US Topo quadrangle displayed in Adobe Acrobat Reader DC with the main components of the viewer annotated.
The right side features the main map elements: the map interior and the Map Collar elements (yellow highlighted).
The left side shows the table of contents (TOC) for all available layers. If the Layer panel is not visible, it can be turned on by clicking the Layers icon to the left (see Figure 5). Each US Topo TOC contains folders with subfolders and layers. The exact layer list will vary with the US Topo vintage and location. The top-level folders are as follows:
- Map Collar is the first top-level folder. It contains layers related to the area outside the projection line. This includes all text, diagrams, and other information that appears in this area, except for data related to cartographic coordinate systems (e.g., coordinate values next to grid lines).
- Map Frame is the second top-level folder. It contains all actual map content found in the map interior.
- Images is the third top-level folder. Layers in the Map Frame can be underlaid with an orthoimage basemap. Though source orthoimagery may be collected at a higher resolution, the US Topo product calls for an orthoimage with a ground sample distance (GSD) of ~1.5 meters. At a 1:24,000 scale, this GSD corresponds to a file size of ~30 MB for the US Topo product.
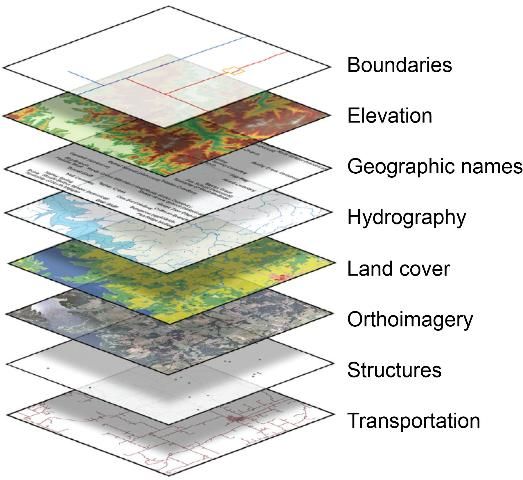
Map Frame and Image layers are based on data from The National Map and other sources. The National Map is a collaborative effort among the USGS and other federal, state, and local partners to improve and deliver topographic information for the United States. The majority of The National Map effort is devoted to acquiring and integrating medium-scale (nominally 1:24,000 scale) geospatial data for eight base layers shown in Figure 6. Within the Map Frame top-level folder, layer options include contours that show the shape of the earth's surface, hydrographic features (e.g., lakes, rivers), roads, boundaries, and geographic names. Additional data from the geographic data themes of transportation, structures (e.g., fire stations), and land cover (e.g., woodland area) are present in most maps as well. Data from The National Map can be downloaded free of charge from The National Map Download Client under the "Data" section (left side in Figure 4).
Credit: Modified from Sugarbaker and Carswell (2011)
Per US Topo Standard (Davis et al. 2019), the US Topo PDF contains at a minimum the following folders and layers:
- Map Collar: Map Elements
- Map Frame: Projection and Grids, Terrain
- Images: Orthoimage
- Barcode
Other folders and layers are only shown if the cartographic features are present in that particular US Topo quadrangle. For example, the "Airports" layer is present in the "Transportation" folder for the Gainesville East Quadrangle shown in Figure 5.
Elements in the Map Collar
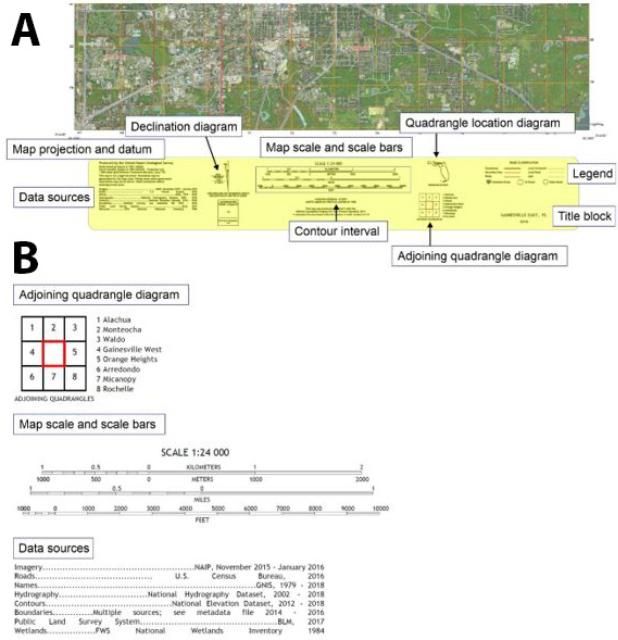
The Map Collar contains important metadata about a US Topo quadrangle (Figure 7A). Figure 7B provides a zoomed view into some of the elements in the Map Collar taken from the Gainesville East quadrangle.
Map Collar elements include:
- A map symbol key (legend), which explains the road-related map symbols, is shown on each individual US Topo map. A more comprehensive explanation of US Topo map symbols is available on the web.
- The quadrangle location diagram indicates the location of a quadrangle within the state. Meanwhile, the adjoining location diagram shows the quadrangles that are adjacent to the current map. In this example, the diagram lays out the eight quadrangles surrounding the Gainesville East quadrangle (Figure 7B).
- The contour interval denotes the elevation difference between adjacent contour lines. Contour intervals vary across US Topo maps due to terrain complexity within a given area (e.g., Rocky Mountains in Colorado versus the Everglades in south Florida). As an example, the Gainesville East Quadrangle has a 10-foot contour interval. Every fifth contour line is an "index contour," shown as a heavier brown line and labeled with the elevation it represents. The 100- and 150-foot contour lines in Figure 1 are examples of index contours.
- The map scale is expressed as a representative fraction (Figure 7B). In a US Topo quadrangle, one inch on the map in full resolution represents 24,000 inches (2,000 feet) on the ground. Scale bars are provided in metric and US units. Scale and scale bars are particularly useful for measuring distances and point coordinates on paper plots of US Topo maps.
- A list of data sources and currency dates is provided for the different thematic layers that are drawn from The National Map (Figure 7B). It shows that the layers are compiled from different agencies such as the US Census Bureau or the Bureau of Land Management (BLM).
- The next element provides information regarding map projection, horizontal geodetic datum, and grid information. All US Topo maps use the Transverse Mercator projection and UTM grid system. A more detailed description of geodetic datums and the UTM grid system is provided in the follow-up publication Spatial Measurements on US Topos (https://edis.ifas.ufl.edu/publication/fr433).
- The declination diagram shows three north directions visualized as north arrows. The directions represent different northings at the map center. These are:
- Geodetic north—direction towards the geographic north pole
- Grid north—north axis of the rectangular coordinate system associated with the UTM grid
- Magnetic north—direction towards the north pole of the earth's magnetic field.
Summary
US Topo maps provide current, high-quality, georeferenced data on various themes across the entire contiguous United States, Hawaii, and US Territories. Maps are portable and applicable in planning and analysis tasks for projects in natural resource management and related disciplines. The spatial data layers displayed in a US Topo quadrangle can also be downloaded separately from The National Map Download Client for further analysis in separate Geographic Information System (GIS) software. This publication focuses on US Topo quadrangle download procedures and layer structure. A related publication, Spatial Measurements on US Topos (https://edis.ifas.ufl.edu/publication/fr433), reviews in more detail the spatial measurement and coordinate readout tools available in Adobe Acrobat Pro and Adobe Reader in connection with US Topo PDFs.
Web Resources
National Map Download Client
https://apps.nationalmap.gov/downloader/
USGS Store Map Locator
USGS TopoView
https://ngmdb.usgs.gov/topoview/
US Topo Map Symbols
https://edrnet.com/wp-content/uploads/2014/08/US-Topo-Map-Symbols.pdf
US Topo Map Users Guide
Literature Cited
Davis, L. R., K. A. Fishburn, H. Lestinsky, L. R. Moore, and J. L. Walt. 2019. "US Topo Product Standard (Techniques and Methods 11–B2)." https://doi.org/10.3133/tm11B2
Sugarbaker, L. J., and W. J. Carswell, Jr. 2011. The National Map - Fact Sheet 2011–3042. https://doi.org/10.3133/fs20113042