Introduction
Vegetable production in Miami-Dade County, FL, provides a significant contribution to local and state economies. The total vegetable acreage in 2012 was 29,703 acres (USDA 2012). The market value of vegetable product was $87 million in 2017 (https://www.nass.usda.gov/Publications/AgCensus/2017/Online_Resources/County_Profiles/Florida/cp12086.pdf). Snap bean with pole bean, sweet corn, tomato, boniato (sweet potato), and squash are the major vegetables grown in this area (Table 1). In 2017, snap bean comprised the largest portion of the total acreage. This document explores weather conditions, basic soil properties, and fertilizer recommendations for snap bean in Miami-Dade County.
Weather
The ten-year average (January 2008–December 2017) air and soil temperatures were 73.9°F and 76.9°F, respectively, and average annual rainfall in Miami-Dade County, FL, was 54.3 inches (Table 2). The county has a subtropical climate: hot and wet summers from May to November and cool and dry winters from December to April. Frosts are recorded almost every winter and flooding occasionally occurs during the summer.
Soil
In Miami-Dade County, there are two types of calcareous soils: rocky or gravelly soils and marl soils (Li 2013). Both soils have porous limestone bedrock and a pH of 7.4 to 8.4. The rocky soils are well drained and contain less than 2% organic matter content (Li 2013). Marl soils form a 2- to 72-inch layer above the bedrock, contain 10–30% organic carbon, and can be prone to flooding (Li 2013). The 1996 USDA soil survey classified the typical rocky soil as Krome (loamy-skeletal, carbonatic, hypothermic Lithic Udorthents) and the typical marl soil as Biscayne (loamy, carbonatic, hyperthermic, shallow Typic Fluvaquents).
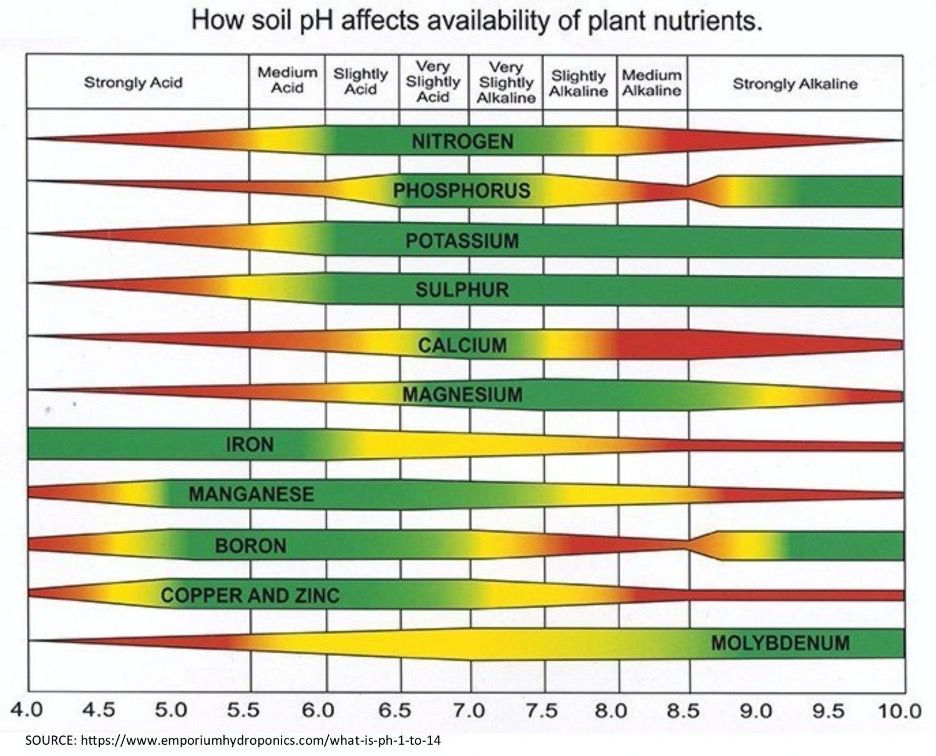
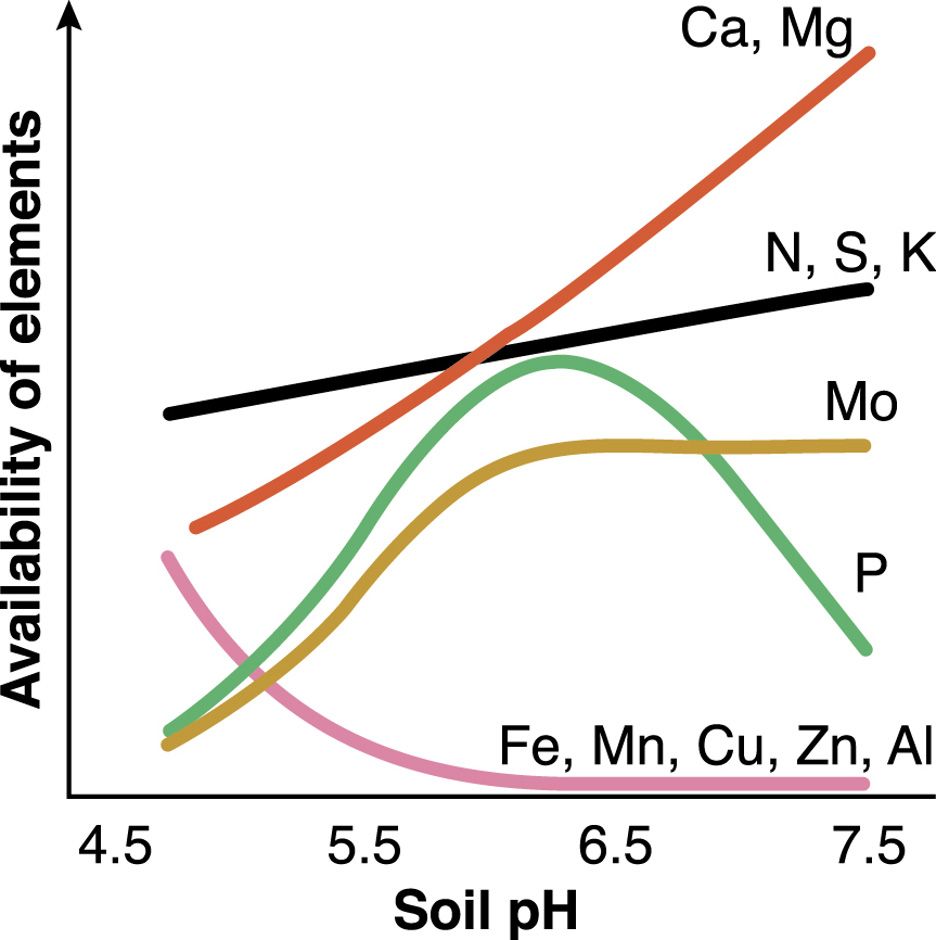
The high soil pH may result in considerable loss of nitrogen (N) through volatilization of ammonia. In these soils, the availability of phosphorus (P), iron (Fe), zinc (Zn), and manganese (Mn) is relatively low because of potential precipitation (Figures 1 and 2). The high calcium (Ca) concentration can reduce magnesium (Mg) uptake due to competition, and the high concentration of bicarbonates can prevent Fe uptake by the crop (Li 2013).

Credit: https://www.agrobest.com.au/news/How-Soil-pH-affects-availability-of-plant-nutrients-7.htm

Credit: https://www.agric.wa.gov.au/soil-acidity/effects-soil-acidity?page=0%2C1
Snap Bean Fertilizer Recommendations
Snap bean is a legume, so it can fix N, but in most soils (especially where soil organic matter is less than 3.0%), snap bean requires N fertilizers to maximize yields (Slaton, Golden, DeLong, and Massey 2007). For snap bean, the University of Florida Institute of Food and Agricultural Sciences (UF/IFAS) recommends 100 lb/acre N with a split application of 50% applied at planting and 50% banded on the side of the bed at first flower bud emergence (Simonne et al. 2012; Liu et al. 2021). Recent studies of snap beans in Homestead (southeast Miami-Dade County) found a range of optimum N rates between 70 to 100 lb/acre, which is within the UF/IFAS recommendations (Hochmuth and Hanlon 2016).
UF/IFAS phosphorous (P) recommendations in sandy soils (not applicable to Miami-Dade) are 80 to between 100 and120 lb/acre P2O5when Mehlich-3 (M-3) soil-extracted P concentrations are medium (26–45 ppm) to low (= 25 ppm), respectively (Liu et al. 2017). However, due to the lack of an official extractant for rocky or gravelly and marl soils, P and potassium (K) recommendations cannot be provided for vegetable production in Miami-Dade County. Efforts are still ongoing to identify an extractant for calcareous soils in Florida. Currently, UF/IFAS Extension Soil Testing Laboratory (ESTL) extracts P from calcareous soils using ammonium bicarbonate-diethylene triaminepentaacetic acid (AB-DTPA) with a critical value of 10 ppm. Previous field studies reported that most soils from vegetable fields in Miami-Dade County had AB-DTPA extractable P between 56 and 113 ppm and therefore no P was needed to grow the crop (Hochmuth and Hanlon 2016).
Potassium rates recommended by UF/IFAS in sandy soils (not applicable to Miami-Dade) are 80 to between 100 and120 lb/acre K2O for soils with medium (36–60 ppm) and low (= 35 ppm) M-3 soil-extracted K concentrations, respectively (Liu et al. 2017). Hochmuth and Hanlon (2016) suggested no K application was required for snap beans in Miami-Dade County when soil K concentrations determined by AB-DTPA extractant ranged from 71 to 281 ppm. This recommendation is not implemented by UF/IFAS-ESTL.
Since there is no recommended soil test extractant for Miami-Dade county soils, there are no official recommendations for applying P or K on vegetables. In the absence of a standard UF/IFAS recommendation for snap beans in Miami-Dade County, the typical bean fertilizer program used by growers in Miami-Dade is to broadcast 90%–100% of the P and band up to half the N and K at planting using preplant fertilizers such as 4-4-8, 5-5-8, 6-3-12, 6-12-12, or similar formulas. Growers use liquid or dry N and K fertilizer for side-dressing. Side-dressing with N and minors (Zn and Mn) is generally performed between the time the first true leaf has fully expanded and budbreak. Many growers will apply a low rate of P (such as 10 lb of a liquid 10-52-10) between budbreak and the pin bean stage and will also side-dress with K between the pin bean stage and harvest. Bean varieties bred under low N conditions tend to develop more problems with postharvest breakdown if levels of N are too high.
If a cover crop or organic soil amendment has been applied, then the amount of inorganic fertilizer can potentially be reduced by the amount of nutrients contributed by the organic matter content (Ozores-Hampton 2012). Foliar application of micronutrients in snap beans is recommended only if deficiency symptoms appear during the crop cycle (Zhang et al. 2017). The deficient values and adequate ranges of macronutrients and micronutrients for snap bean leaf are listed in Table 3.
References
Florida Automated Weather Network (FAWN). 2018. “Report Generator.” http://fawn.ifas.ufl.edu/data/reports (Accessed March 1, 2018)
Hochmuth, G., D. Maynard, C. Vavrina, E. Hanlon, and E. Simonne. 2015. Plant Tissue Analysis and Interpretation for Vegetable Crops in Florida. HS 964. Gainesville: University of Florida Institute of Food and Agricultural Sciences. https://edis.ifas.ufl.edu/ep081 (Accessed August 4. 2021)
Hochmuth, G., and E. Hanlon. 2016. A Summary of N, P, and K Research with Snap Bean in Florida. SL 331. Gainesville: University of Florida Institute of Food and Agricultural Sciences. https://edis.ifas.ufl.edu/cv234 (Accessed August 4. 2021)
Liu, G., E. H. Simonne, K. T. Morgan, G. J. Hochmuth, S. Agehara, and R. Mylavarapu. 2021. Fertilizer Management for Vegetable Production in Florida. CV 296. Gainesville: University of Florida Institute of Food and Agricultural Sciences. https://edis.ifas.ufl.edu/cv296 (Accessed August 4. 2021)
Ozores-Hampton, M. 2012. “Developing a Vegetable Fertility Program Using Organic Amendments and Inorganic Fertilizers.” 22: 743–750.
Ozores-Hampton, M., E. J. McAvoy, M. Lamberts, and D. Sui. 2010. “A Survey of the Effectiveness of Current Methods Used for the Freeze Protection of Vegetables in South Florida.” 123: 128–133.
Simonne, E., G. Liu, A. Gazula, B. Hochmuth, L. Landrum, D. Gast, L. L. Davis, et al. 2012. “Yield Response of Overhead Irrigated Snap Bean to Nitrogen Rates.” . 125: 174–181.
Slaton, N. A., B. R. Golden, R. E. DeLong, and C. G. Massey. 2007. “Green Bean Yield as Affected by Nitrogen Fertilization Strategy.” In , edited by N. A. Stalton. Fayetteville, AR: Arkansas Agricultural Experiment Station.
USDA, National Agricultural Statistics Service. 2012 Census of Agriculture-County Data. https://www.agcensus.usda.gov/Publications/2012/Full_Report/Volume_1,_Chapter_2_County_Level/Florida/st12_2_029_029.pdf (Accessed August 4. 2021)
Zhang, S., D. Seal, M. Ozores-Hampton, M. Lamberts, Y. C. Li, W. Klassen, and T. Olczyk. 2017. Snapbean Production in Miami-Dade County, Florida. HS853. Gainesville: University of Florida Institute of Food and Agricultural Sciences. https://edis.ifas.ufl.edu/tr005 (Accessed August 4. 2021)
Monthly minimum (Min.), average (Avg.), and maximum (Max.) air and soil temperature and rainfall from January 2008 to December 2017 in Miami-Dade County, FLz