Importance of Soil Water Distribution in Rocky Soils
In Miami-Dade County, approximately 304,000 acres of vegetables are grown on calcareous rocky soils. These soils are characterized by very low nutrient and water holding capacity, an alkaline pH in the 7.4–8.4 range, and levels of calcium carbonate (CaCO3) ranging from 30% to 94% (Li 2001). Soil profiles of rocky soils appear as an approximately 8-inch-thick layer of crushed limestone particles over the porous limestone bedrock. In shallow soils with high water table (2 to 4 ft depth), frequent applications of water and nutrients are needed to ensure rapid growth and economical yields of vegetable crops
Scheduling irrigation for vegetables typically consists of knowing when to irrigate and how much water to apply in a way that satisfies crop water needs, maintains soil water tension between field capacity and 15 kPa in the root zone, and prevents nutrient leaching (Simonne Dukes et al. 2009). Irrigation scheduling requires a target water amount adjusted to weather conditions and crop age, a measure of soil moisture, a method to account for rainfall contribution to soil moisture, and a rule for splitting irrigation. Tensiometers may be used to measure soil water tension in rocky soils (Olczyk et al. 2002). Splitting irrigation is needed when the volume of irrigation needed exceeds the amount of water that can be stored in the root zone (Clark and Smajstrla 1993). In practice, splitting irrigation has to be a compromise between two constraints. On one side, frequent and short irrigations are less likely to leach soluble nutrients below the root zone. On the other side, frequent and short irrigations can waste water and reduce irrigation uniformity due to a large portion of the irrigation cycle used for system charge and flush. Also, each irrigation cycle must deliver enough water to completely wet the soil between two adjacent emitters to maintain crop uniformity, especially when the plants are small. In this context, automatic irrigation systems based on soil moisture are a good alternative to traditional irrigation scheduling methods (Muñoz-Carpena and Dukes 2005).
The amount of water that can be stored in the root zone can be assessed by visualizing water movement in the soil using soluble dye (German-Heins and Flury 2000; Simonne et al. 2003). In this project, blue dye and controlled irrigation conditions were used to visualize and interpret water distribution, not chemical movement, of wetting patterns of different drip tapes on a rocky soil of south Miami-Dade county where vegetable crops are typically grown. The main objectives were to (1) describe the shape of the wetted zone for several water volumes applied through drip irrigation, (2) determine vertical, lateral and longitudinal movements of irrigation water for increasing water volumes, (3) quantify the relative volume of wetted soil in the raised bed, and (4) provide guidelines for splitting irrigation.
A New Way of Looking at Water Redistribution in the Field
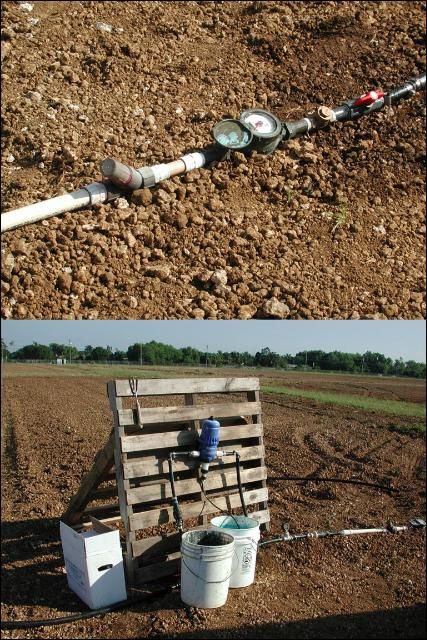
A dye test was conducted at the UF/IFAS Tropical Research and Education Center (TREC), in Homestead, on 14 Oct., 2003 on a 7- to 10-inch-deep Krome very gravelly loam soil. Before the day of the test, 150-ft-long raised beds were formed, and drip tape and polyethylene mulch were laid. Treatments were four drip-tape types (Table 1) and four irrigation durations (1, 2, 3, and 4 hrs). Each bed received a different drip tape. The irrigation system consisted of a well, pump, back-flow prevention device, fertilizer injector (model DI16-11, Dosatron, Clearwater, FL), 150-mesh screen filter, 10 psi pressure regulator, and drip tape (Figure 1).
The dye test consisted of injecting the dye, irrigating with a selected volume of water, digging longitudinal and transverse of the raised beds, and taking measurements. After pressurizing the irrigation system, a blue dye (Brilliant Blue CF, Terramark SPI High Concentrate, ProSource One, Memphis, TN) was injected at a 1:49 (v:v) dye:water dilution rate for the first 30 minutes, and at the 1:100 dilution rate thereafter. Diluted dye, instead of clear water, was injected after the initial dye injection to prevent losing the water front.
Digging was done immediately after completion of the test. For each treatment, a 4-ft-long and one transverse section were dug, which allowed measurements on several emitters. The shapes of the wetted zones were described qualitatively and quantitatively. Wetted zones were described as round (circular), elongated (true elliptic), rectangular (modified elliptic shapes due to the joining of the wetting patterns of two adjacent emitters), or irregular (when none of the above descriptions applied). For the quantitative description of the zone, depth, width and length were measured under each emitter as the longest vertical length from the drip tape to the bottom of the blue ring, the horizontal length perpendicular to bed axis at the widest point of the wetted zone, and the horizontal length parallel to the bed at the widest point of the wetted zone, respectively. Actual measurements were converted into relative wetted measurements based on the greatest possible wetted lengths by bed width for width (32 inches), soil depth for depth (7 to 10 inches in this field), and emitter spacing for length.
Soil Moisture and Redistribution Patterns Described For Rocky Soils Plastic Mulched Beds
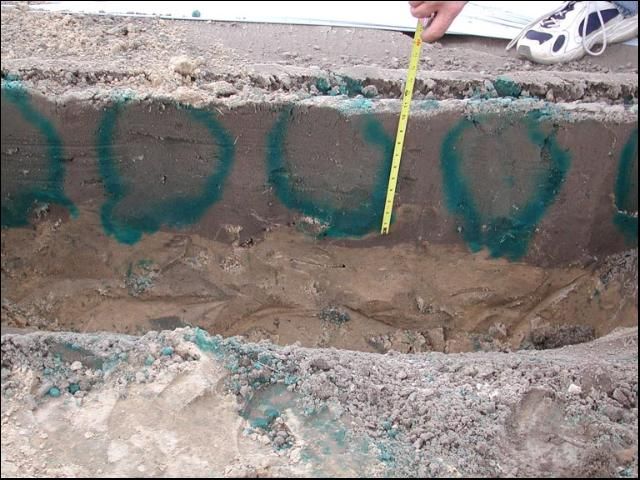
Because initially concentrated dye was injected followed by diluted dye, the dye patterns in the soil profile appeared as a 1-inch-thick blue ring surrounding a lightly colored section of soil. The dye was easily distinguished in the soil, but the contrast between the soil color and the blue ring was increased by allowing a 1- to 2-hr. drying period after digging.
All the wetted zones were irregular in shape for all flow rates and length of irrigation (Figure 2). Gravelly textured soils are difficult to pack during bed formation, and water may flow along soil particles. Irregular shapes such as the ones observed on the Krome very gravelly loamy soil are in contrast with those observed on sandy soils (Figure 3), which tended to be round to elongated in the absence of an impermeable layer (Simonne et al. 2003).
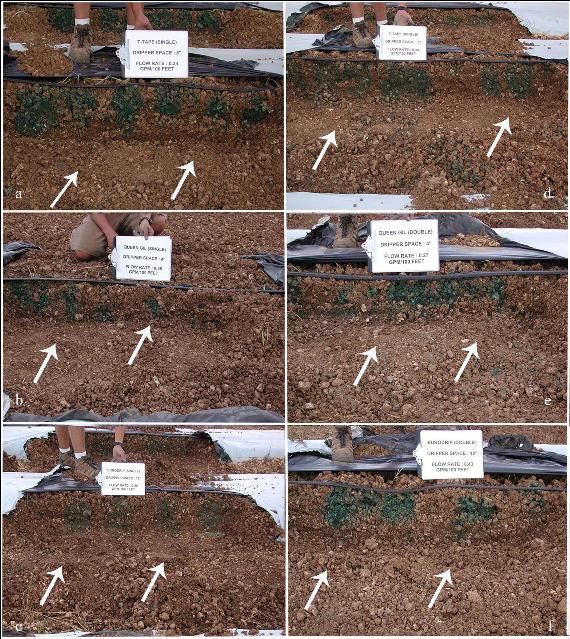
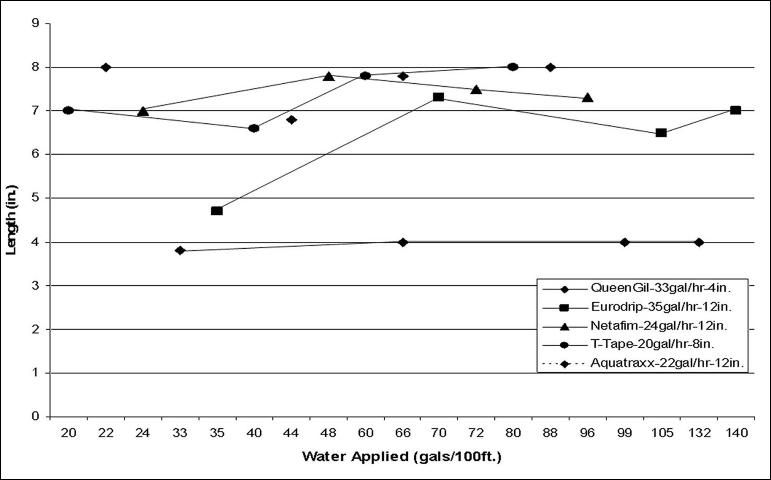
Increasing injection volume from 21 to 142 gal/100 ft did not have a practical effect on depth, and length of the wetted zone as all measurements ranged between 3.8 and 8.0 inches (Figures 4–6). For each drip tape, increasing injection volume significantly increased wetted width, only within the narrow 4- to 9-inch range. After 2 to 3 hr. of irrigation, the dye reached the calcium carbonate bedrock and moved into it thereafter.
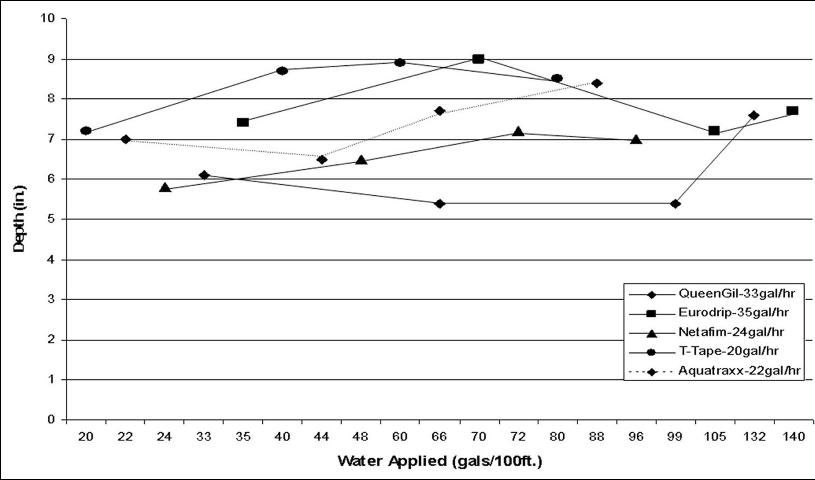
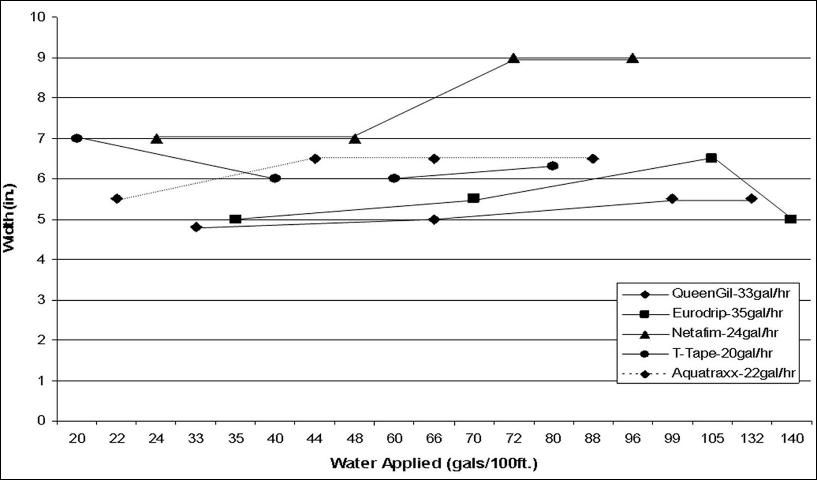
Once water reaches the bed rock, it becomes decreasingly available to the plant as roots poorly colonize the bedrock. Water and soluble nutrients are likely to decrease shallow ground water quality once they enter the bedrock. Hence, irrigation management should maintain water in the loose section of the profile and above the bedrock. Wetted bed width ranged only between 4.5 and 8 inches and illustrates poor lateral movement of water on coarse-textured soils in the absence of an impermeable layer. Poor lateral movement seldom affects crop water uptake since seeds or transplants are usually placed within inches of the drip tape. The most important implication of a limited lateral water movement is for fumigant application and distribution. Total bed wetting is necessary for the uniform application of fumigants that stay in the water phase such as potassium N-methyldithiocarbamate (K-Pam) or sodium N-methyldithiocarbamate (VaPam). These results support the need for narrow beds and/or double drip tapes per bed when complete bed wetting is needed (Table 2).
Complete emitter-to-emitter coverage was observed after one hour of irrigation for the tapes with 4- or 8-inch emitter spacing (Figures 4–6). The highest wetted length for the tapes with 12-inch emitters was 8 inches, suggesting incomplete coverage when 12-inch emitter spacing is used.
Summary and Implications for Irrigation
The drip tape flow rates selected in this study (20 to 35 gal/100ft/hr) cover the high- to medium-flow-rate range. Emitter spacings used by the vegetable industry were also similar to those used in this trial (4 to 12 inches). Based on our results, flow rate had no effect on the wetted zone of this rocky soil, possibly because of shallow soil depth (7 to 10 inches) and high soil heterogeneity. The soil depth used in this study (7 to 10 inches) is representative of depth in the area. In some fields, the root zone may be even smaller. These results support the practice of using short irrigation events (1 to 2 hrs.) for the application of water and fertilizer to vegetable crops grown on rocky soil.
References
Clark, G.A. and A.G. Smajstrla. 1993. Application Volumes and Wetting Patterns for Scheduling Drip Irrigation in Florida Vegetable Production. Circ. 1041. Gainesville: University of Florida Institute of Food and Agricultural Sciences.
German-Heins, J. and M. Flury. 2000. "Sorption of brilliant blue FCF in soils as affected by pH ionic strength." Geoderma 97:87–101.
Li, Y.C. 2001. Calcareous Soils in Miami-Dade County. SL183. Gainesville: University of Florida Institute of Food and Agricultural Sciences. https://edis.ifas.ufl.edu/tr004
Li, Y.C., H.H. Bryan, W. Klassen, M. Lamberts, and T. Olczyk. 2002. Tomato Production in County, Florida. HS-858. Gainesville: University of Florida Institute of Food and Agricultural Sciences. https://edis.ifas.ufl.edu/tr014
Muñoz-Carpena, R., M.D. Dukes. 2005. Automatic Irrigation Based on Soil Moisture for Crops. ABE356. Gainesville: University of Florida Institute of Food and Agricultural Sciences. https://edis.ifas.ufl.edu/ae354
Olczyk, T.W., Y. Li, and R. Munoz-Carpena. 2002. Using Tensiometer for Vegetable Irrigation in Miami-Dade County. ABE326. Gainesville: University of Florida Institute of Food and Agricultural Sciences. https://edis.ifas.ufl.edu/tr015
Simonne, E.H., and M.D. Dukes, and D.Z. Haman. 2009. "Principles and practices for irrigation." pp. 17–23 In: S.M. Olson and E. Simonne (Eds.) 2009–2010 Vegetable Production Handbook for Florida. Lenexa, KS: Vance Publishing.
Simonne, E.H., D.W. Studstill, R.C. Hochmuth, G. McAvoy, M.D. Dukes and S.M. Olson. 2003. of water movement in mulched beds with injections of dye with drip irrigation. Fla. State Hort. Soc. 116:88–91.
Tables
Selected drip tapes used for the dye test on a Krome very gravelly loam soil in Homestead, Florida.