MENU

AskIFAS Powered by EDIS

Sugarcane Plant Nutrient Diagnosis

J. Mabry McCray, Ronald W. Rice, Ike V. Ezenwa, Timothy A. Lang, and Les Baucum

Introduction

A consistent soil testing program is a valuable best management practice (BMP) that allows sugarcane growers to make sound economic fertilization decisions. However, soil testing in Florida has two limitations. First, soil tests are either not available or are not calibrated for nitrogen and micronutrients. Second, soil samples are routinely taken only before sugarcane is planted and rarely are soil samples collected for ratoon crops. Generally, soil samples are not routinely taken from fields with actively growing sugarcane plants since the practice of banding fertilizers in the furrow at planting, along with subsequent sidedress applications of fertilizer sources during the growing season, makes it very difficult to obtain a representative soil sample.

Use of leaf nutrient analysis in combination with visual evaluation of malnutrition symptoms can complement a grower's soil testing program and add additional information that will improve nutrient management decisions. Leaf analysis provides a picture of crop nutritional status at the time of sampling, while soil testing provides information about the continued supply of nutrients from the soil. Leaf analysis allows for early detection of nutritional problems and enables the grower to add supplemental fertilizer to the current year's crop or to adjust next year's fertilizer application. It is also used to help diagnose a nutritional problem in a particular field or localized area of a field where poor growth or other symptoms have been observed. Although specific fertilizer recommendations are not provided for a given leaf nutrient analysis, deficiencies or imbalances indicate where additions or changes in the fertility program are needed. Leaf analysis and knowledge of visual symptoms can be used along with soil-test values and fertilizer and crop records to make improved decisions regarding fertilization. Nutrient management for sugarcane using leaf analysis is discussed in a companion publication by McCray and Mylavarapu (2020) (https://edis.ifas.ufl.edu/ag345).

Leaf Analysis Evaluation Methods

There are two methods for evaluating the nutrient status of sugarcane, the Critical Nutrient Level (CNL) approach and the Diagnosis and Recommendation Integrated System (DRIS). Leaf sampling and preparation procedures are discussed in a companion EDIS publication by McCray et al. (2021) (https://edis.ifas.ufl.edu/sc076).

The CNL approach defines a nutrient concentration below which the nutrient is considered to limit production. It refers specifically to the concentration of a particular nutrient in a particular plant part at a specific stage of growth at which production losses reach 5%–10%. For Florida sugarcane, the top visible dewlap (TVD) leaf blade is sampled during the grand growth period of June to August. When using this approach, it is particularly important to collect leaf samples at the specified growth stage used for reference standards because nutrient contents change during the crop growth cycle. The CNL approach may also include using a nutrient's optimum range, defined as the range of concentration of a nutrient considered optimum for production. Within this range, there should be no deficiency or excess of a given nutrient. Sugarcane leaf nutrient critical values and optimum ranges are given in Table 1.

Table 1. 

Sugarcane leaf nutrient critical values and optimum ranges.

Nutrient

Critical Value

Optimum Range


%

%

Nitrogen (N)

1.80

2.00–2.60

Phosphorus (P)

0.19

0.22–0.30

Potassium (K)

0.90

1.00–1.60

Calcium (Ca)

0.20

0.20–0.45

Magnesium (Mg)

0.13

0.15–0.32

Sulfur (S)

0.13

0.13–0.18

Silicon (Si)

0.50

=0.60


mg/kg

mg/kg

Iron (Fe)

50

55–105

Manganese (Mn)

16

20–100

Zinc (Zn)

15

17–32

Copper (Cu)

3

4–8

Boron (B)

4

15–20

Molybdenum

0.05

-----

From Anderson and Bowen (1990) and McCray and Mylavarapu (2010). All values are from Florida except S and Mo, which are from Louisiana.

DRIS calculates indices relative to zero by comparing leaf nutrient ratios with those found in a high-yielding population. In the mid-1980s a DRIS application for Florida sugarcane was developed (Elwali and Gascho, 1983; 1984). DRIS requires a large number of observations of plant tissue nutrient concentrations and associated crop yields, which are used to define separate low-yielding and high-yielding populations and are also used to determine nutrient ratio means for the high-yielding population. A calibration formula uses the means and standard deviations of the nutrient ratios to calculate relative indices for individual nutrients that can range from negative to positive. When a relative index for a specific nutrient is equal to zero, then the associated nutrient ratios are similar to those of the high-yielding test population. The more negative an index for a given nutrient, the more likely the nutrient is present at insufficient levels relative to other nutrients. A positive index indicates the nutrient is present in excess relative to other nutrients. The Nutrient Balance Index (NBI) can be calculated by adding the absolute value of all individual indices together. As the NBI increases, the more out of balance a leaf analysis is considered to be. DRIS incorporates a measure of the balance between nutrients and can indicate problems that are not as obvious with the CNL approach. It also has the advantage of not being as sensitive to the stage of growth as the CNL approach, which allows a wider time frame in which to collect samples. It is important to note that the use of one approach does not exclude the use of the other. DRIS is simply another valuable tool that can be used to examine nutrient balance, and offers additional interpretations beyond the evaluation of leaf nutrient concentrations alone.

Because of the large number of calculations required to determine DRIS indices, a computer program is required. An Excel spreadsheet programmed for sugarcane DRIS calculations is available at the University of Florida/IFAS Everglades Research and Education Center (EREC) website (http://erec.ifas.ufl.edu/). At the UF/IFAS EREC website homepage, the Sugarcane DRIS Calculator is listed under the heading "Soil Testing Laboratory." Click on the DRIS Calculator and you will have the option of opening or saving the Excel spreadsheet programmed for the calculations. The nutrient concentrations required for the calculations are nitrogen, phosphorus, potassium, calcium, magnesium, iron, manganese, zinc, and copper. Questions about the DRIS spreadsheet can be directed to Mabry McCray (jmmccray@ufl.edu).

A cooperative research effort is being made between UF/IFAS scientists and Florida sugarcane growers to use leaf nutritional analysis to improve growers' fertility programs. Trials in grower fields indicated that there was not a consistent yield response to a mid-season summer fertilizer supplement based on spring leaf analysis (McCray et al. 2010). A more cost-effective use of leaf analysis appears to be with the adjustment of the next amendment or fertilizer application, generally for next year's crop or at the next sugarcane planting, rather than adding an additional fertilizer supplement to the current crop. As improvements are made in our ability to use sugarcane leaf nutritional data, updates will be made available in EDIS.

Field Identification of Nutritional Problems

Visual symptoms of nutrient deficiencies and toxicities can often be the first sign that a particular field or location within a field has a nutritional problem. Recognizing these visual symptoms is an important step when designing corrective action. Further evaluations can be pursued with detailed leaf and soil sampling. The pictures of visual symptoms included in this document can also be found in the publication "Sugarcane Nutrition," by D. L. Anderson and J. E. Bowen (1990). These photographs are from various researchers from sugarcane growing areas around the world. The elements included are arranged alphabetically.

Aluminum (Al)
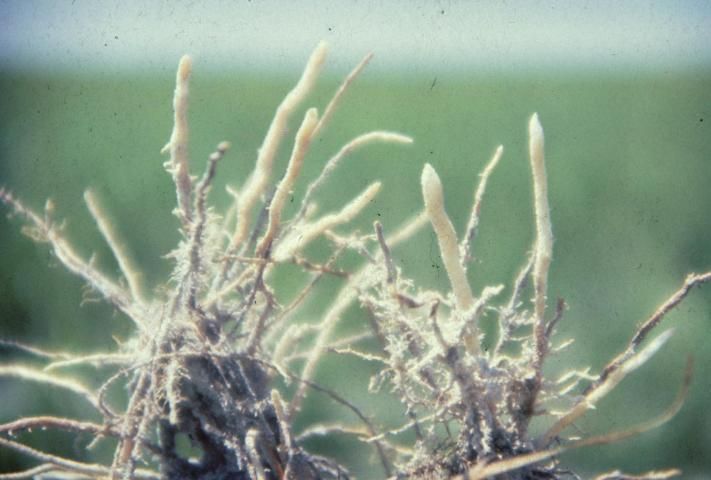
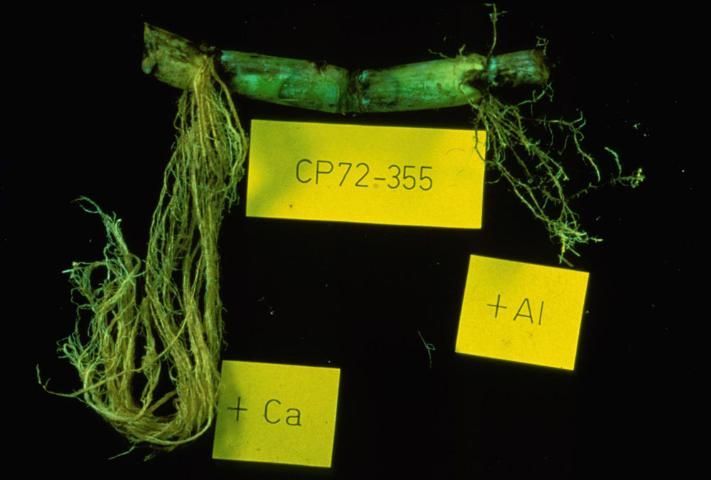
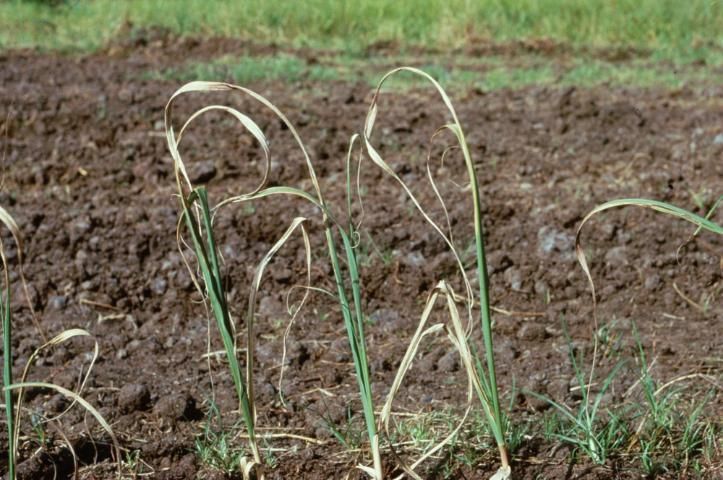
Figure 1. Aluminum toxicity does not directly show up on the leaves, but in the root system. Damage to the root system by Al toxicity resembles injury symptoms caused by nematodes. Few lateral roots form and those roots that are present have abnormally thickened tips. Plants become highly susceptible to moisture stress. On acid soils, land-forming operations or erosion can expose acid subsoils. Aluminum toxicity might be found with soil pH less than 5.2 and can be alleviated by liming, which increases soil pH and adds calcium.
Figure 1.  Aluminum toxicity does not directly show up on the leaves, but in the root system. Damage to the root system by Al toxicity resembles injury symptoms caused by nematodes. Few lateral roots form and those roots that are present have abnormally thickened tips. Plants become highly susceptible to moisture stress. On acid soils, land-forming operations or erosion can expose acid subsoils. Aluminum toxicity might be found with soil pH less than 5.2 and can be alleviated by liming, which increases soil pH and adds calcium.
Credit: D. L. Anderson


Figure 2. Calcium added to the soil helps to alleviate the effects of Al toxicity, particularly if accompanied by an appropriate pH increase.
Figure 2.  Calcium added to the soil helps to alleviate the effects of Al toxicity, particularly if accompanied by an appropriate pH increase.
Credit: D. L. Anderson

Boron (B)

Figure 3. The symptoms of B deficiency appear on young leaves of sugarcane. Apical meristem may or may not remain alive. Immature leaves have varying degrees of chlorosis, but they do not wilt.
Figure 3.  The symptoms of B deficiency appear on young leaves of sugarcane. Apical meristem may or may not remain alive. Immature leaves have varying degrees of chlorosis, but they do not wilt.
Credit: D. L. Anderson


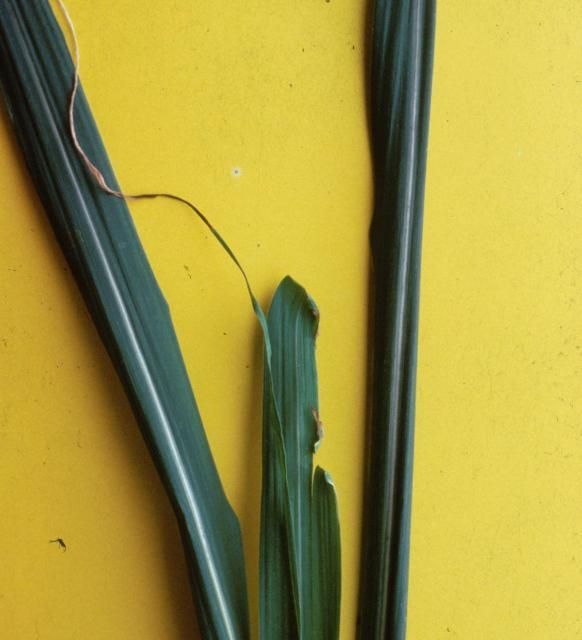
Figure 4. Boron-deficient plants have distorted leaves, particularly along the leaf margins on immature leaves. Immature leaves may not unfurl from the whorl when B deficiency is severe.
Figure 4.  Boron-deficient plants have distorted leaves, particularly along the leaf margins on immature leaves. Immature leaves may not unfurl from the whorl when B deficiency is severe.
Credit: J. Orlando Filho


Figure 5. In B deficiency, the apical meristem may die.
Figure 5.  In B deficiency, the apical meristem may die.
Credit: J. E. Bowen
 
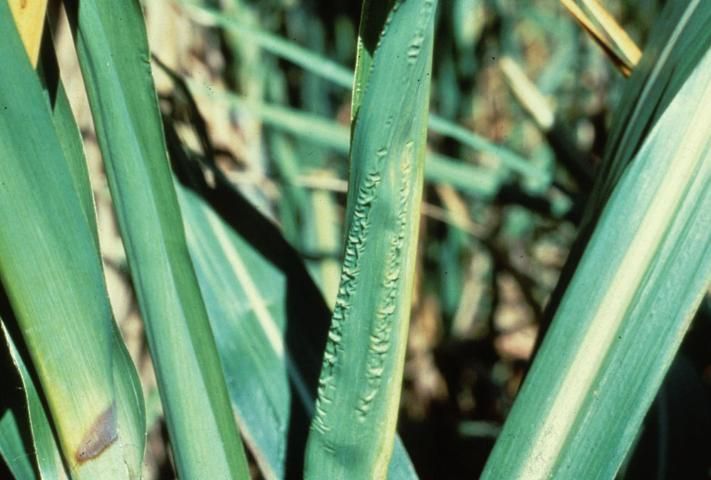
Translucent lesions (“water sacks”) along leaf margins may occur as B deficiency progresses.
Figure 6. Translucent lesions (“water sacks”) along leaf margins may occur as B deficiency progresses.
Credit: J. E. Bowen
Figure 7. In cases of severe B deficiency, young sugarcane plants tend to be brittle and bunched with many tillers.
Figure 7.  In cases of severe B deficiency, young sugarcane plants tend to be brittle and bunched with many tillers.
Credit: G. J. Gascho


Figure 8. Leaf margins become chlorotic with B toxicity.
Figure 8.  Leaf margins become chlorotic with B toxicity.
Credit: J. E. Bowen


Calcium (Ca)

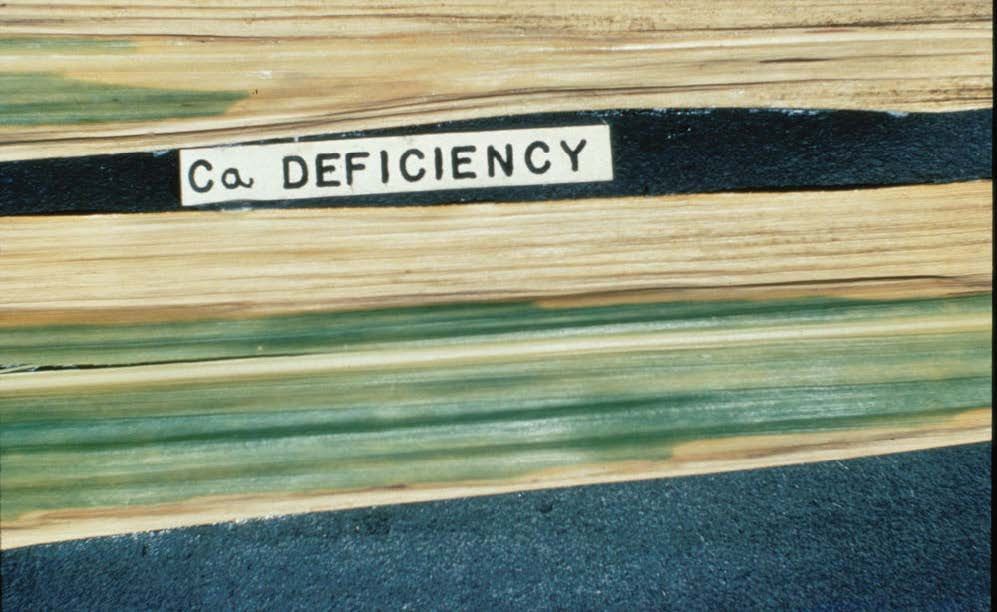
The effects of Ca deficiency on older leaves are localized with mottling and chlorosis. Older leaves may have a “rusty” appearance and may die prematurely.
Figure 9. The effects of Ca deficiency on older leaves are localized with mottling and chlorosis. Older leaves may have a “rusty” appearance and may die prematurely.
Credit: G. Samuels
Figure 10. Spindles often become necrotic at the leaf tip and along margins when Ca deficiency is acute. Immature leaves are distorted and necrotic. However, Ca deficiency is uncommon.
Figure 10.  Spindles often become necrotic at the leaf tip and along margins when Ca deficiency is acute. Immature leaves are distorted and necrotic. However, Ca deficiency is uncommon.
Credit: G. Samuels


Chlorine (Cl)

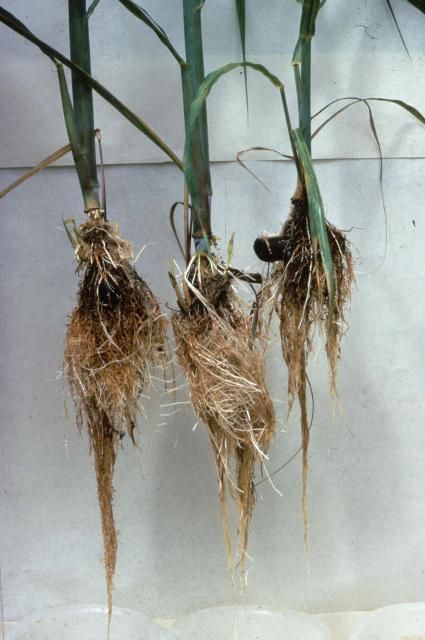
Figure 11. Chlorine deficiency and toxicity are hard to identify in the field. Chlorine deficiency causes abnormally short roots and increases the number of lateral roots. Chlorine toxicity will also cause abnormally short roots with very little lateral branching (from left to right: 0, 1, and 100 ppm Cl). Neither Cl deficiency nor toxicity are likely in commercially-grown sugarcane in Florida.
Figure 11.  Chlorine deficiency and toxicity are hard to identify in the field. Chlorine deficiency causes abnormally short roots and increases the number of lateral roots. Chlorine toxicity will also cause abnormally short roots with very little lateral branching (from left to right: 0, 1, and 100 ppm Cl). Neither Cl deficiency nor toxicity are likely in commercially-grown sugarcane in Florida.
Credit: J. E. Bowen


Figure 12. Chlorine deficiency and toxicity in young leaves (from left to right: 0 and 100 ppm Cl).
Figure 12.  Chlorine deficiency and toxicity in young leaves (from left to right: 0 and 100 ppm Cl).
Credit: J. E. Bowen


Copper (Cu)

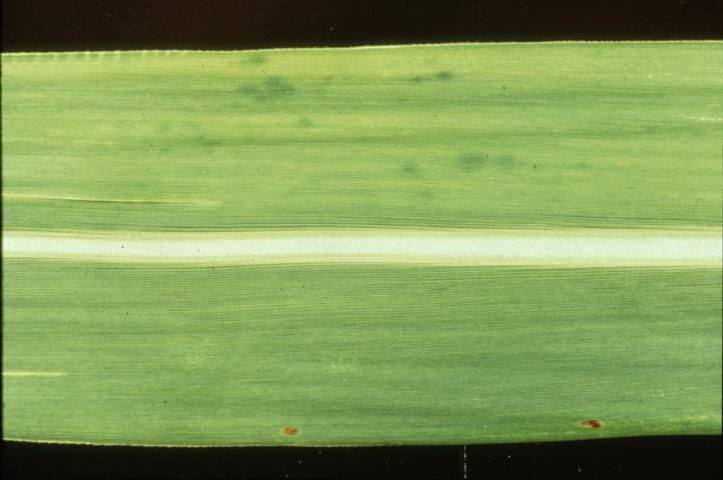
Figure 13. Copper deficiency generally appears first in young leaves. Green splotches are an early symptom.
Figure 13.  Copper deficiency generally appears first in young leaves. Green splotches are an early symptom.
Credit: G. J. Gascho


Figure 14. Apical meristems remain alive, but internode elongation will be greatly reduced when Cu deficiency is severe.
Figure 14.  Apical meristems remain alive, but internode elongation will be greatly reduced when Cu deficiency is severe.
Credit: D. L. Anderson


Figure 15. General vigor and tillering are reduced under Cu deficiency.
Figure 15.  General vigor and tillering are reduced under Cu deficiency.
Credit: J. Orlando Filho

Iron (Fe)

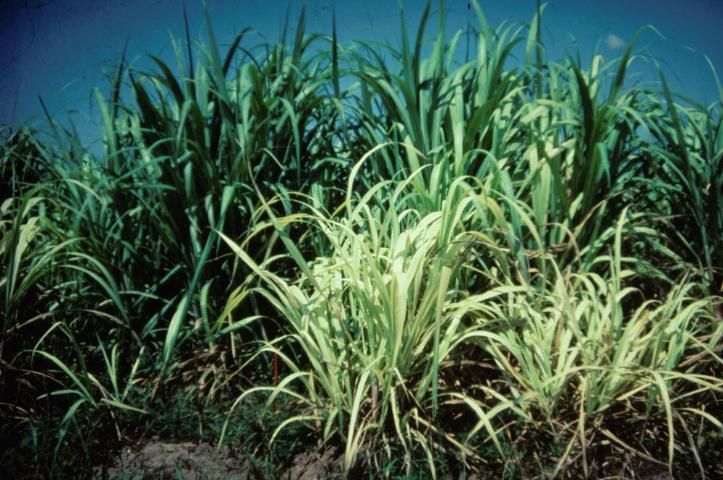
Figure 16. Iron deficiency is first evident on young leaves. Symptoms of Fe deficiency often occur adjacent to unaffected plants. Young plants may overcome symptoms as the plant matures and the root system develops.
Figure 16.  Iron deficiency is first evident on young leaves. Symptoms of Fe deficiency often occur adjacent to unaffected plants. Young plants may overcome symptoms as the plant matures and the root system develops.
Credit: D. L. Anderson


Figure 17. Iron deficiency occurs on high pH calcareous soils found in Brazil.
Figure 17.  Iron deficiency occurs on high pH calcareous soils found in Brazil.
Credit: J. Orlando Filho


Figure 18. On high pH calcareous soils found in Barbados, Fe deficiency is found adjacent to healthy maturing cane plants. Damage to the root system due to insects or adverse soil conditions (i.e., salts) give this deficiency unusual spatial characteristics.
Figure 18.  On high pH calcareous soils found in Barbados, Fe deficiency is found adjacent to healthy maturing cane plants. Damage to the root system due to insects or adverse soil conditions (i.e., salts) give this deficiency unusual spatial characteristics.
Credit: D. L. Anderson


Magnesium (Mg)
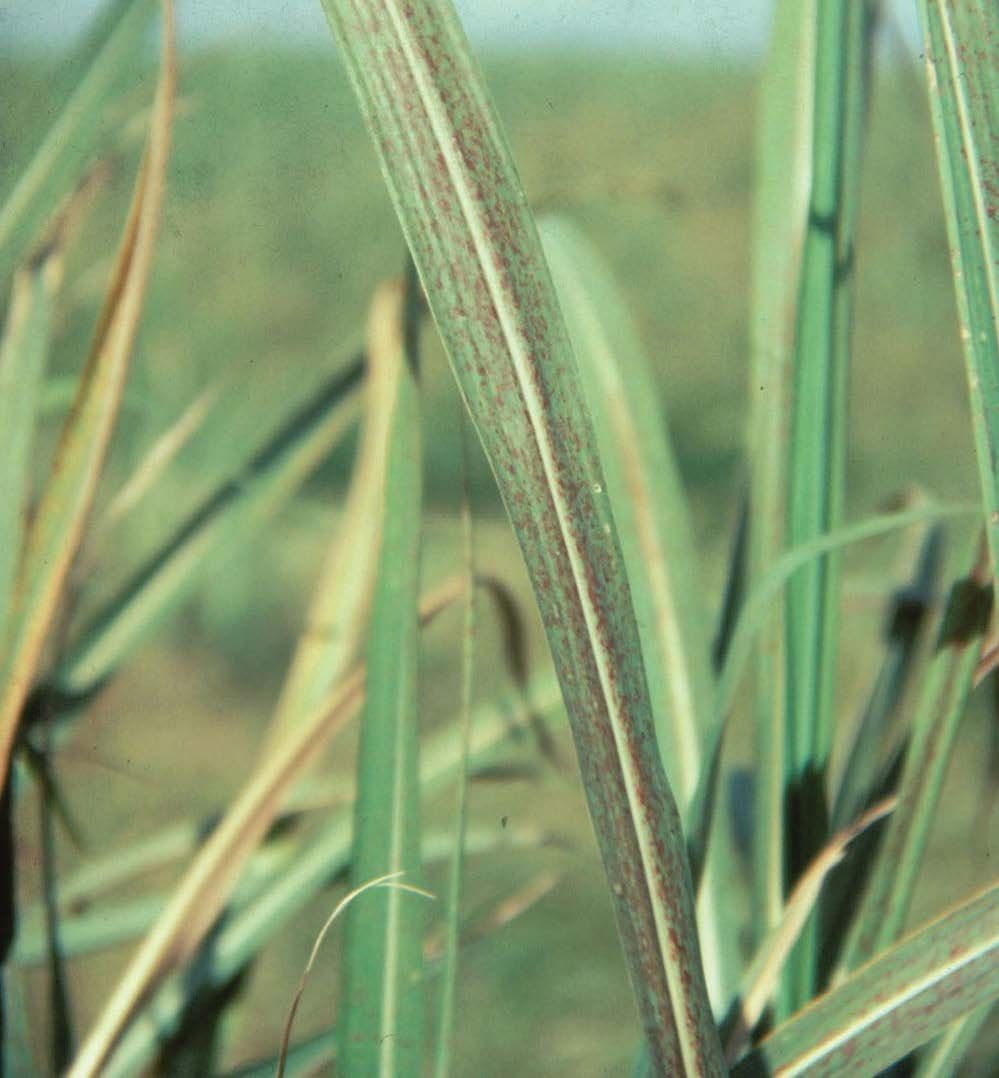
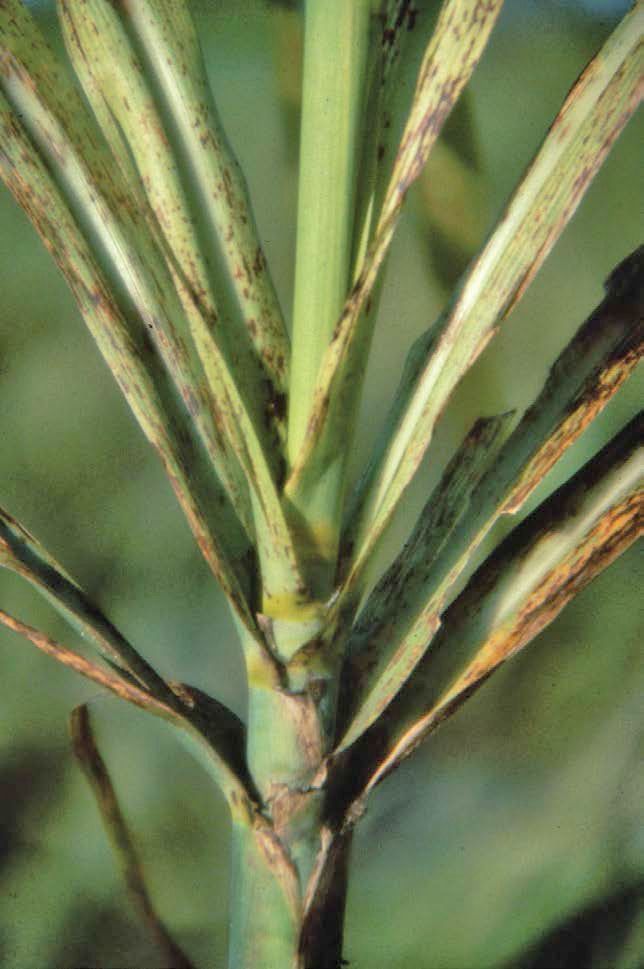
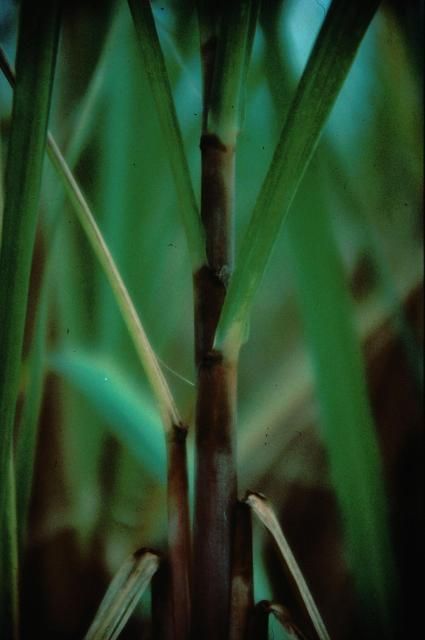
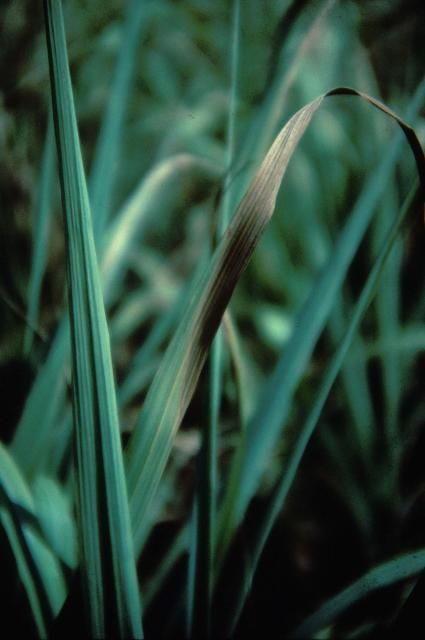
Magnesium deficiency is first evident on older leaves. Red necrotic lesions result in a “rusty” appearance.
Figure 19. Magnesium deficiency is first evident on older leaves. Red necrotic lesions result in a “rusty” appearance.
Credit: D. L. Anderson
The “rusty” appearance can spread across all leaves and may also result in premature dropping of older leaves.
Figure 20. The “rusty” appearance can spread across all leaves and may also result in premature dropping of older leaves.
Credit: D. L. Anderson
Under severe Mg deficiency, the stalk may become stunted and severely “rusted” and brown. Internal browning of the stalk may also occur.
Figure 21. Under severe Mg deficiency, the stalk may become stunted and severely “rusted” and brown. Internal browning of the stalk may also occur.
Credit: D. L. Anderson

Manganese (Mn)
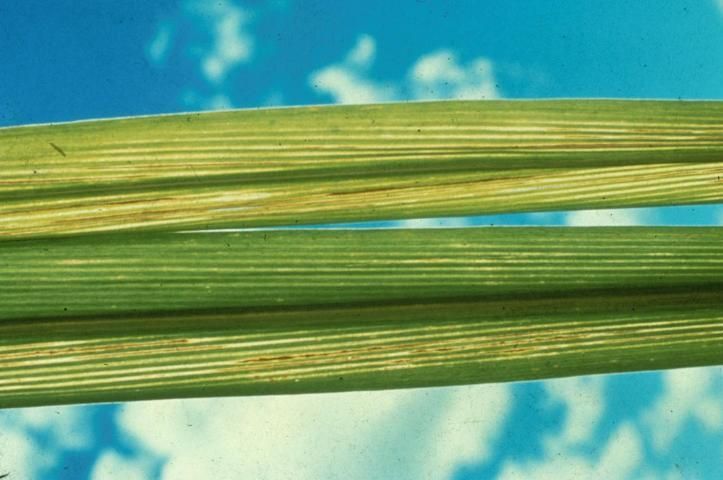
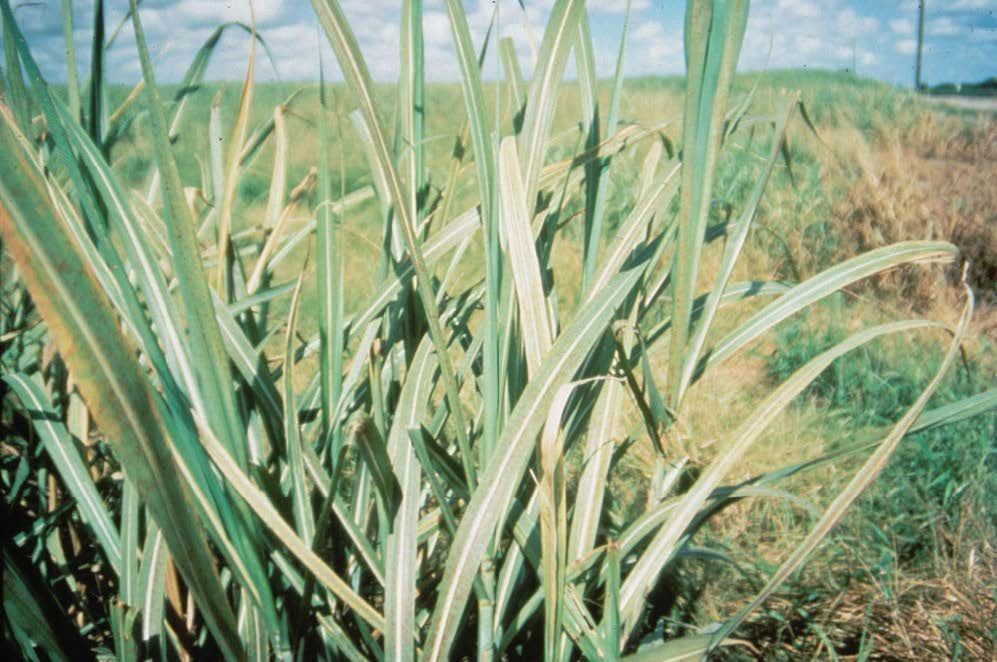
Figure 22. Manganese deficiency first appears on younger leaves. Interveinal chlorosis occurs from the leaf tip toward the middle of the leaf.
Figure 22.  Manganese deficiency first appears on younger leaves. Interveinal chlorosis occurs from the leaf tip toward the middle of the leaf.
Credit: J. Orlando Filho


Figure 23. Under severe Mn deficiency, the entire leaf becomes bleached.
Figure 23.  Under severe Mn deficiency, the entire leaf becomes bleached.
Credit: D. L. Anderson


Molybdenum (Mo)
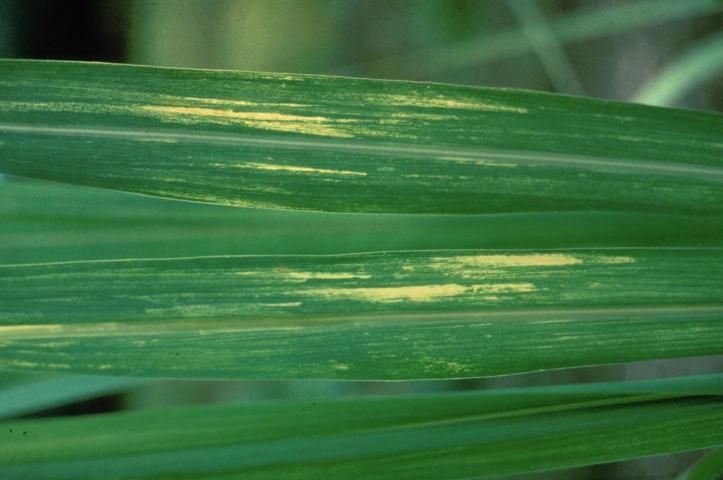
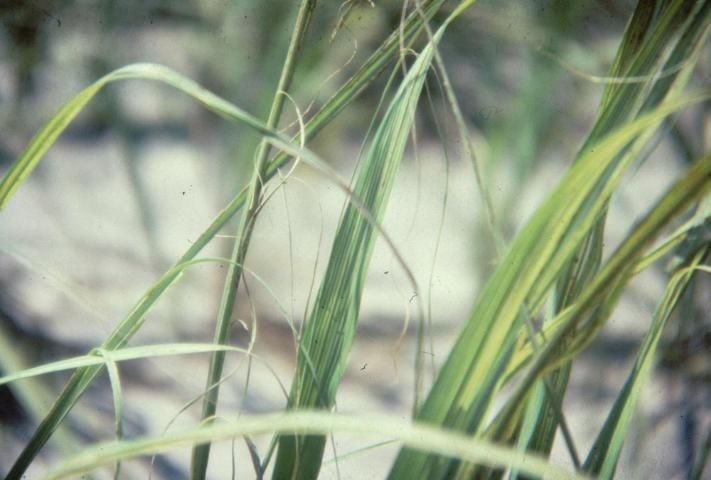
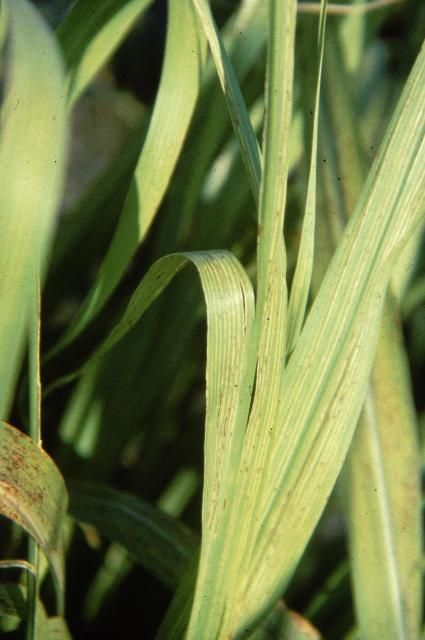
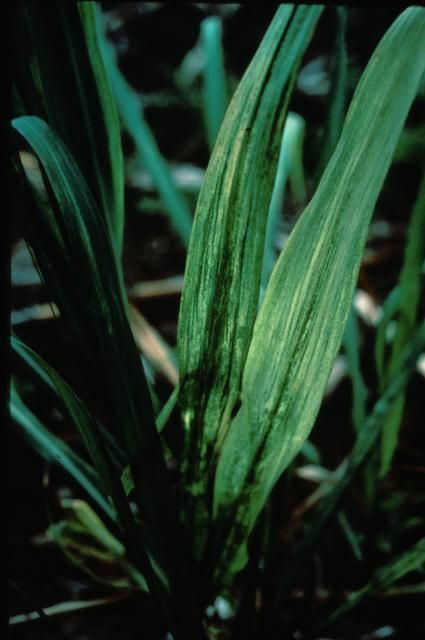
Figure 24. Molybdenum deficiency is seen on older leaves. Short longitudinal chlorotic streaks on the apical one-third of the leaf. Symptoms are similar to mild infections of Pokkah Boeng disease (https://edis.ifas.ufl.edu/sc004).
Figure 24.  Molybdenum deficiency is seen on older leaves. Short longitudinal chlorotic streaks on the apical one-third of the leaf. Symptoms are similar to mild infections of Pokkah Boeng disease (https://edis.ifas.ufl.edu/sc004).
Credit: J. E. Bowen


Nitrogen (N)

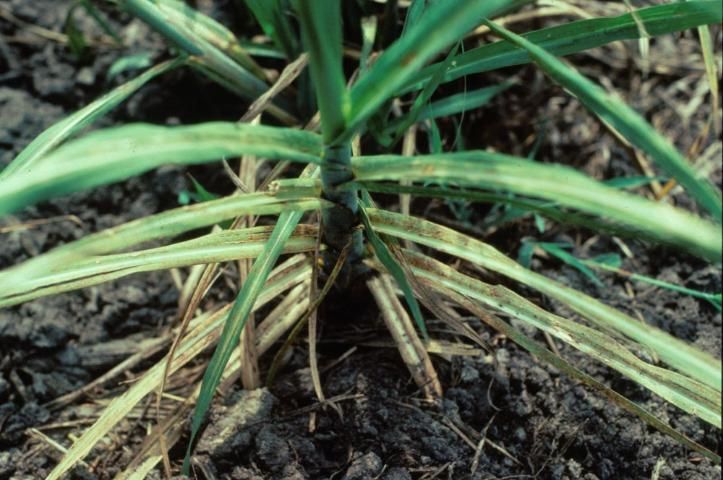
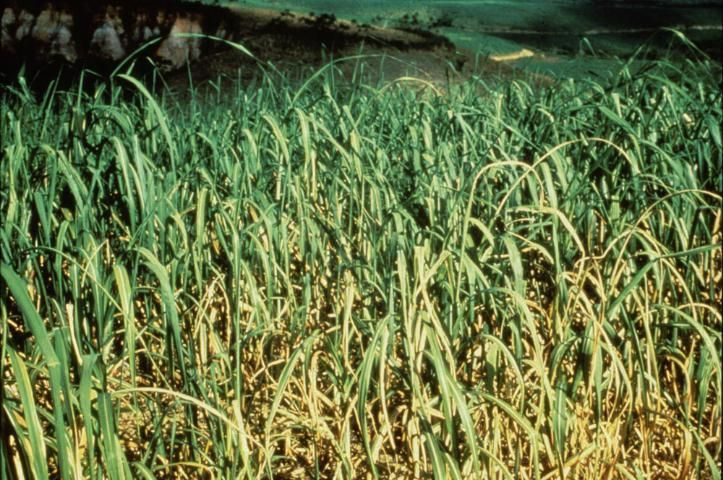
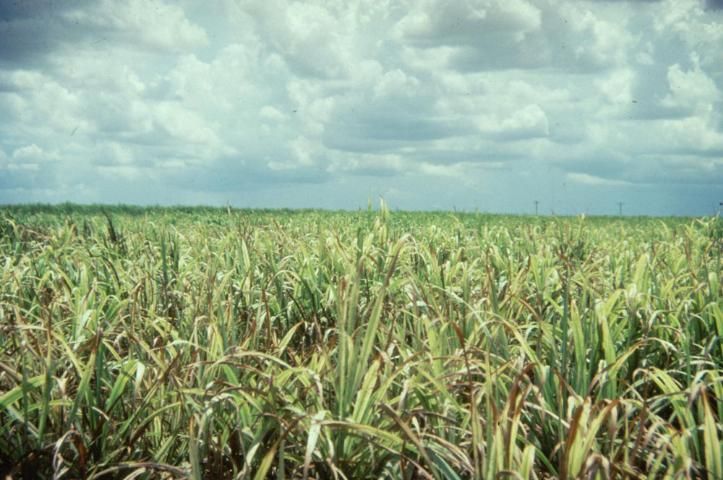
Figure 25. Older leaves first show N deficiency. Symptoms become generalized over the whole plant and older leaves die back. Young leaves are pale-green and stalks are slender when under long-term N deficiency stress.
Figure 25.  Older leaves first show N deficiency. Symptoms become generalized over the whole plant and older leaves die back. Young leaves are pale-green and stalks are slender when under long-term N deficiency stress.
Credit: D. L. Anderson


Figure 26. Internode growth is reduced with N deficiency.
Figure 26.  Internode growth is reduced with N deficiency.
Credit: J. E. Bowen


Figure 27. With N deficiency, leaf sheaths prematurely separate from the stalk. Note pale-green to yellow color.
Figure 27.  With N deficiency, leaf sheaths prematurely separate from the stalk. Note pale-green to yellow color.
Credit: P. Bosshart


Phosphorus (P)

Figure 28. Older leaves first show symptoms of P deficiency. Leaf reddening usually occurs with P deficiency when the plant is young and when growing temperatures are <10°C (50°F).
Figure 28.  Older leaves first show symptoms of P deficiency. Leaf reddening usually occurs with P deficiency when the plant is young and when growing temperatures are <10°C (50°F).
Credit: D. L. Anderson


Figure 29. Phosphorus deficiency causes short and slender stalks. Older leaves prematurely die back (note leaf sheaths).
Figure 29.  Phosphorus deficiency causes short and slender stalks. Older leaves prematurely die back (note leaf sheaths).
Credit: D. L. Anderson


Potassium (K)

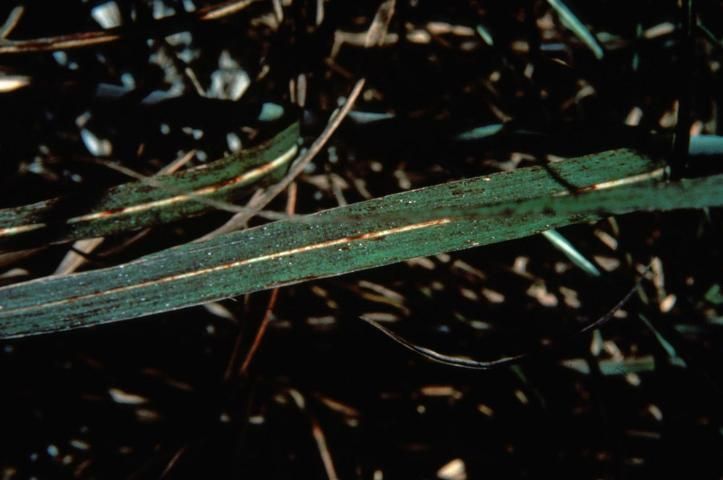
Figure 30. Older leaves first show symptoms of K deficiency. The symptoms appear as localized mottling or chlorosis.
Figure 30.  Older leaves first show symptoms of K deficiency. The symptoms appear as localized mottling or chlorosis.
Credit: D. L. Anderson


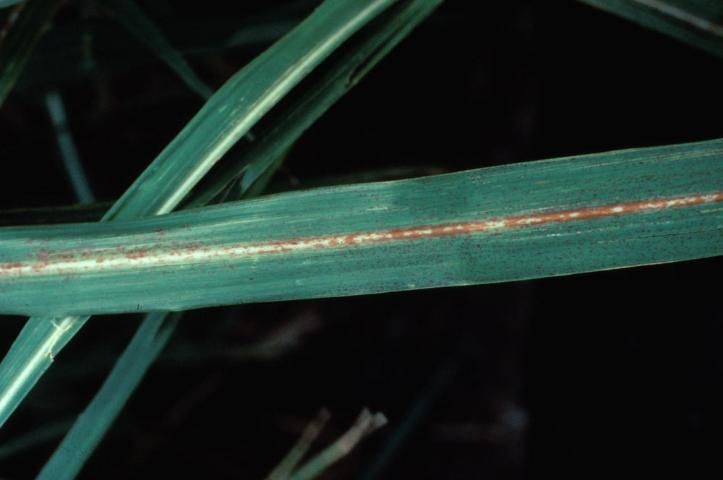
Figure 31. Red discoloration of upper surfaces of the midrib is characteristic of K deficiency. Insect feeding damage on the midrib may be misconstrued as K deficiency.
Figure 31.  Red discoloration of upper surfaces of the midrib is characteristic of K deficiency. Insect feeding damage on the midrib may be misconstrued as K deficiency.
Credit: D. L. Anderson


Figure 32. Under moderate K deficiency, young leaves remain dark green and stalks become slender.
Figure 32.  Under moderate K deficiency, young leaves remain dark green and stalks become slender.
Credit: D. L. Anderson
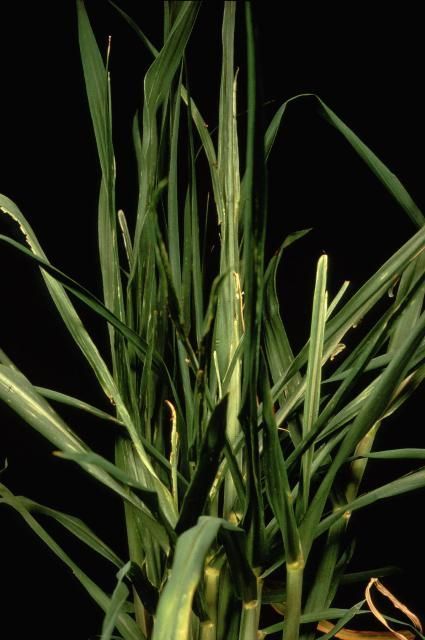
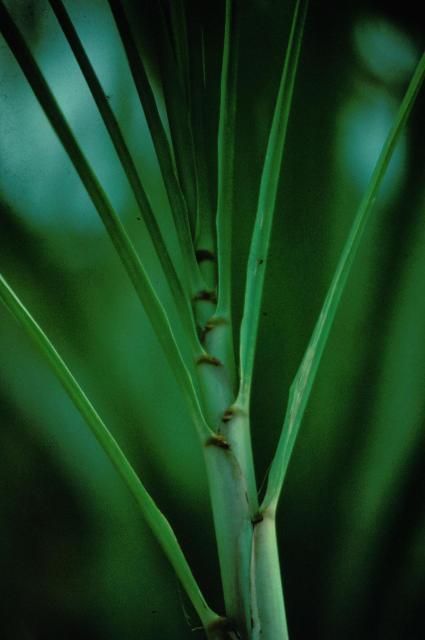
Long-term K deficiency stress may affect meristem development indicated by spindle distortion and a “bunched top” or “fan” appearance.
Figure 33. Long-term K deficiency stress may affect meristem development indicated by spindle distortion and a “bunched top” or “fan” appearance.
Credit: D. L. Anderson

Sodium (Na)

Figure 34. High concentration of Na+ in the soil and resulting accumulation in the plant adversely affects root and shoot growth. Leaf tips and margins will dry out and have a scorched appearance. Excessive Na levels in soil or plants would not be expected in commercial sugarcane growing areas in Florida.
Figure 34.  High concentration of Na+ in the soil and resulting accumulation in the plant adversely affects root and shoot growth. Leaf tips and margins will dry out and have a scorched appearance. Excessive Na levels in soil or plants would not be expected in commercial sugarcane growing areas in Florida.
Credit: D. L. Anderson


Figure 35. With high Na, sugarcane leaves may be broad, but under excessively high concentrations the chlorophyll content decreases, lowering the net photosynthesis per unit leaf area. Under these conditions, leaves may have a pale-green to yellowish-green appearance. High Na is associated with high Cl levels.
Figure 35.  With high Na, sugarcane leaves may be broad, but under excessively high concentrations the chlorophyll content decreases, lowering the net photosynthesis per unit leaf area. Under these conditions, leaves may have a pale-green to yellowish-green appearance. High Na is associated with high Cl levels.
Credit: M. K. Schon


Silicon (Si)

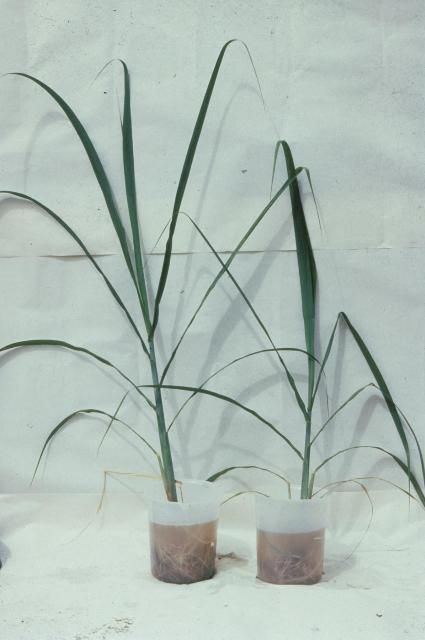
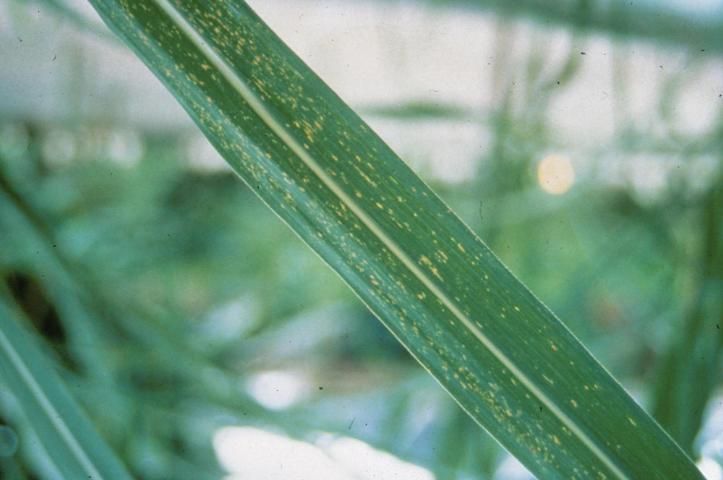
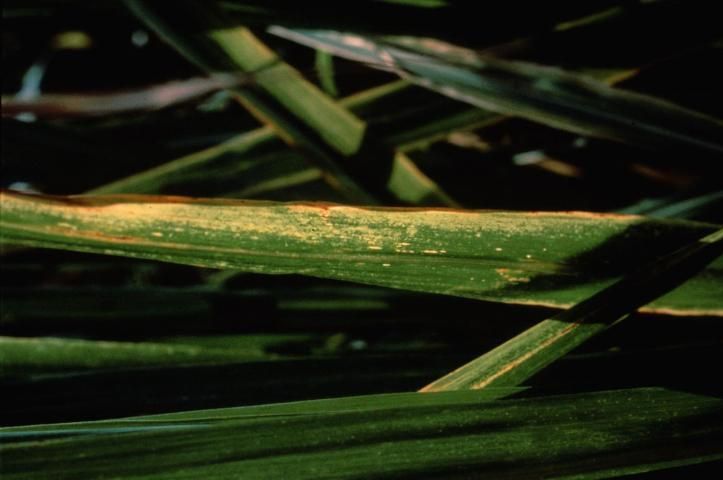
Figure 36. Silicon deficiency symptoms of cane grown on sand media under drip-irrigation. In the field, symptoms appear as minute circular white leaf spots (freckles) and are more severe on older leaves.
Figure 36.  Silicon deficiency symptoms of cane grown on sand media under drip-irrigation. In the field, symptoms appear as minute circular white leaf spots (freckles) and are more severe on older leaves.
Credit: J. E. Bowen


Sulfur (S)

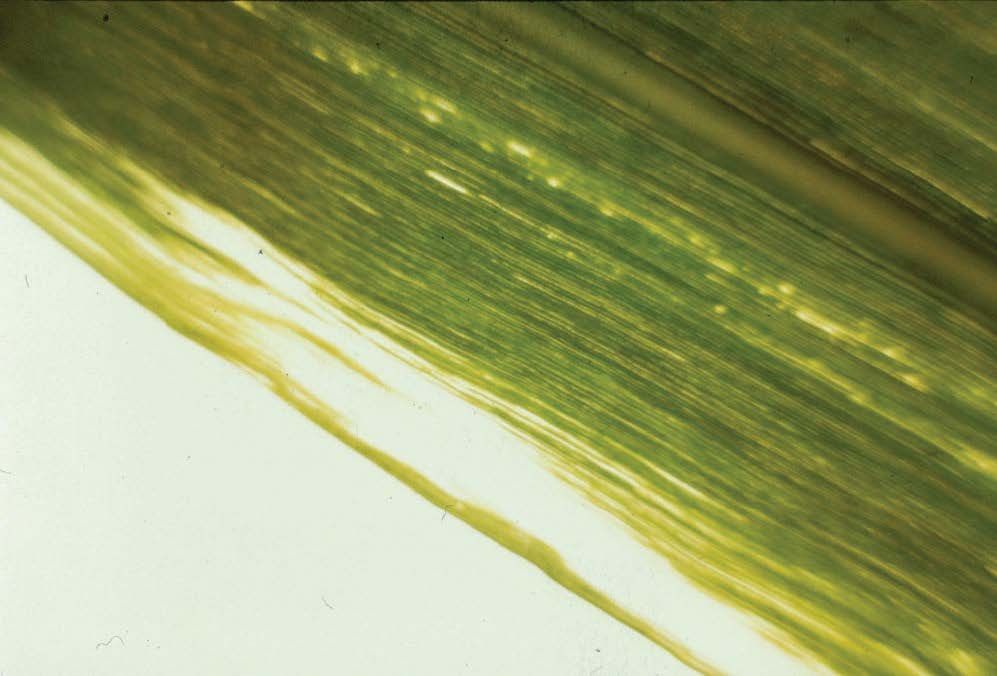
Figure 37. Young leaves affected by SO2 toxicity. Symptoms are mottled chlorotic streaks running the full length of the leaf blade. Toxicity occurs in active volcanic regions of the world.
Figure 37.  Young leaves affected by SO2 toxicity. Symptoms are mottled chlorotic streaks running the full length of the leaf blade. Toxicity occurs in active volcanic regions of the world.
Credit: J. E. Bowen


Figure 38. Leaf tips and margins may become necrotic within 3–7 days after SO2 exposure.
Figure 38.  Leaf tips and margins may become necrotic within 3–7 days after SO2 exposure.
Credit: J. E. Bowen


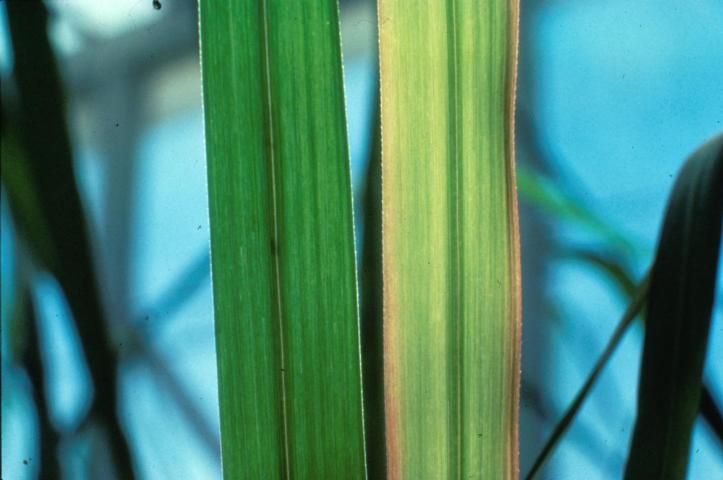
Figure 39. Sulfur-deficient leaf (right), with symptoms of chlorosis and purple leaf margins contrasted with a healthy leaf (left) treated with ammonium sulfate.
Figure 39.  Sulfur-deficient leaf (right), with symptoms of chlorosis and purple leaf margins contrasted with a healthy leaf (left) treated with ammonium sulfate.
Credit: A. Hurney


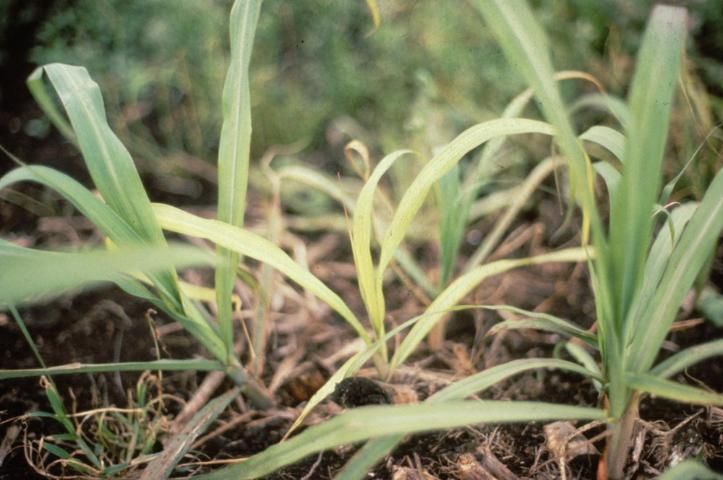
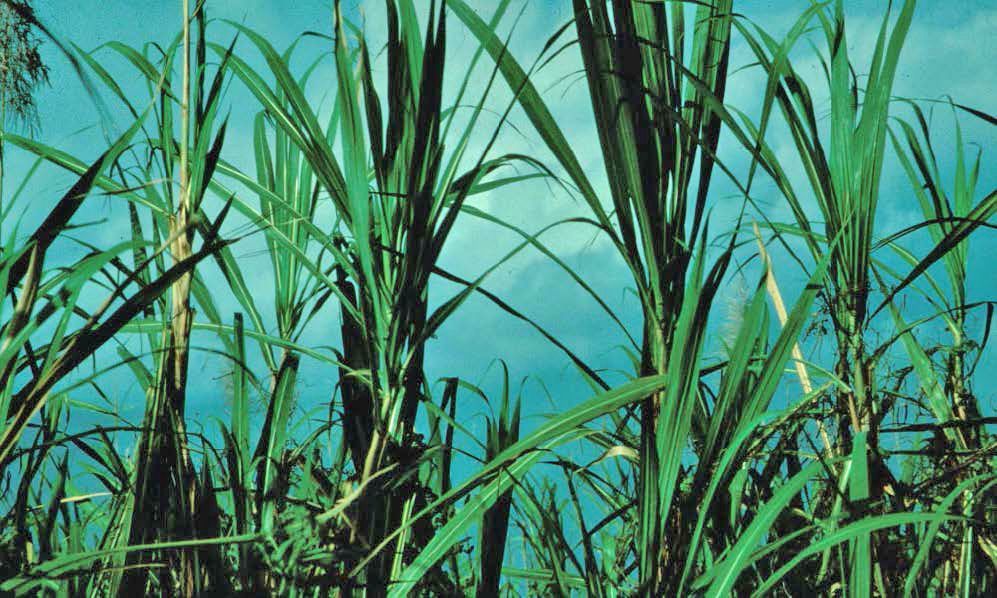
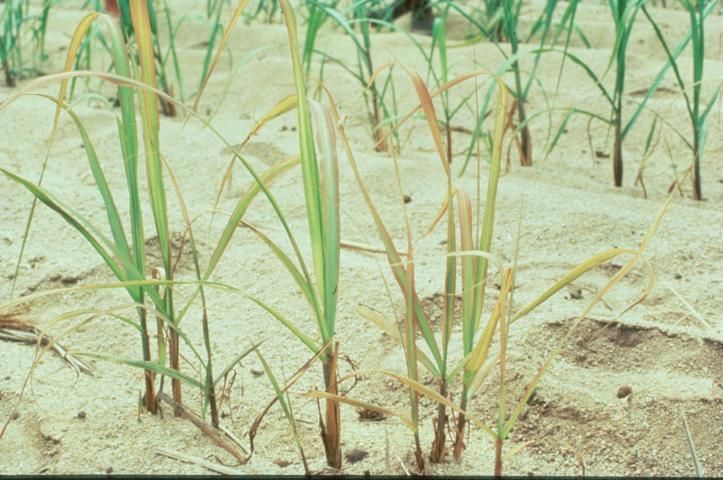
Figure 40. Sulfur deficiency in a sandy soil in North Queensland, Australia. Leaves are narrower and shorter than normal; stalks are slender.
Figure 40.  Sulfur deficiency in a sandy soil in North Queensland, Australia. Leaves are narrower and shorter than normal; stalks are slender.
Credit: A. Hurney


Zinc (Zn)

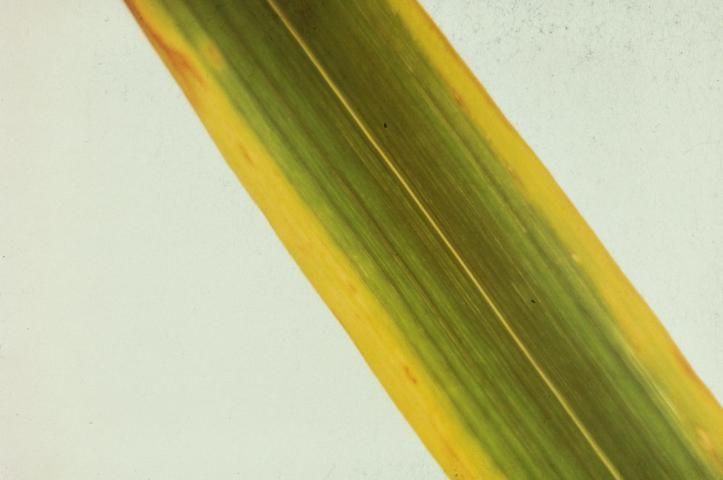
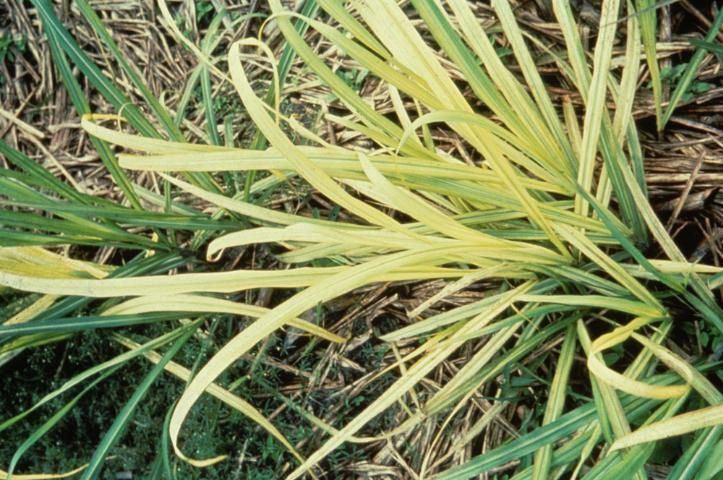
Figure 41. Zinc deficiency is first evident on the younger leaves. A broad band of yellowing in the leaf margin occurs. The midrib and leaf margins remain green except when the deficiency is severe.
Figure 41.  Zinc deficiency is first evident on the younger leaves. A broad band of yellowing in the leaf margin occurs. The midrib and leaf margins remain green except when the deficiency is severe.
Credit: J. Reghenzani


Figure 42. Red lesions are often noticed. The lesions may be associated with a fungus that prefers to grow in Zn-deficient tissues.
Figure 42.  Red lesions are often noticed. The lesions may be associated with a fungus that prefers to grow in Zn-deficient tissues.
Credit: J. Reghenzani


Figure 43. The severity of Zn deficiency can be highly variable. Symptoms are increased with liming and when low Zn subsoils are exposed to the surface.
Figure 43.  The severity of Zn deficiency can be highly variable. Symptoms are increased with liming and when low Zn subsoils are exposed to the surface.
Credit: J. Reghenzani


References and Further Reading

Anderson, D. L. and J. E. Bowen. (1990). Sugarcane Nutrition. Potash and Phosphate Institute, Atlanta, GA.

Beaufils, E. R. (1973). Diagnosis and Recommendation Integrated System (DRIS). A general scheme of experimentation based on principles developed from research in plant nutrition. Soil Sci. Bull. 1, Univ. of Natal, Pietermaritzburg, South Africa. 132 pp.

Elwali, A. M. O. and G. J. Gascho. (1983). Sugarcane response to P, K, and DRIS corrective treatments on Florida Histosols. Agron. J. 75: 79–83. https://doi.org/10.2134/agronj1983.00021962007500010020x

Elwali, A. M. O. and G. J. Gascho. (1984). Soil testing, foliar analysis, and DRIS as guides for sugarcane fertilization. Agron. J. 76: 466–470. https://doi.org/10.2134/agronj1984.00021962007600030024x

McCray, J. M., P. R. Newman, R. W. Rice, and I. V. Ezenwa. (2021). Sugarcane leaf tissue sample preparation for diagnostic analysis. Gainesville: University of Florida Institute of Food and Agricultural Sciences. SS-AGR-259. https://edis.ifas.ufl.edu/sc076

McCray, J. M., S. Ji, G. Powell, G. Montes, and R. Perdomo. (2010). Sugarcane response to DRIS-based fertilizer supplements in Florida. J. Agronomy and Crop Sci. 196: 66–75. https://doi.org/10.1111/j.1439-037x.2009.00395.x

McCray, J. M., and R. Mylavarapu. (2020). Sugarcane nutrient management using leaf analysis. Gainesville: University of Florida Institute of Food and Agricultural Sciences. SS-AGR-335. https://edis.ifas.ufl.edu/ag345

Publication #SS-AGR-128

Release Date:May 16th, 2022

Related Experts

McCray, J. Mabry

Specialist/SSA/RSA

University of Florida

Baucum, Leslie E

external

University of Florida

Lang, Timothy Albert

Specialist/SSA/RSA

University of Florida

Rice, Ronald W.

County agent

University of Florida

Related Units

  • Critical Issue: Agricultural and Food Systems
Fact Sheet

About this Publication

This document is SS-AGR-128, one of a series of the Agronomy Department, UF/IFAS Extension. Original publication date August 2006. Revised December 2009, May 2013, March 2019, and May 2022. Visit the EDIS website at https://edis.ifas.ufl.edu for the currently supported version of this publication.

About the Authors

J. Mabry McCray, scientist, Agronomy Department, Everglades Research and Education Center; Ronald W. Rice, extension director, UF/IFAS Extension Palm Beach County; Ike V. Ezenwa, former assistant professor, Agronomy Department, Southwest Florida REC; Timothy A. Lang, former research associate, Everglades REC; and Les Baucum, sugarcane agronomist, US Sugar Corporation, Clewiston, FL; UF/IFAS Extension, Gainesville, FL 32611.

Contacts

  • James McCray