Introduction
Sugarcane is grown on approximately 90,000 acres of mineral soils in south Florida either in or adjacent to the Everglades Agricultural Area (EAA). This sandland sugarcane acreage accounts for about 26% of sugarcane grown in Florida, with about 320,000 acres being grown on organic soils in the EAA (VanWeelden et al. 2018). Nitrogen (N) fertilizer is not recommended for sugarcane production on these organic soils because adequate N for the crop is available in the soil through mineralization of organic matter. There are also small areas of transition between sands and organic soils. Sugarcane grown on these transitional soils requires N fertilizer, with 30 lb N/acre recommended for sandy muck soils (13 to 20% organic matter) and 110 lb N/acre recommended for mucky sands (6 to 12% organic matter) (VanWeelden et al. 2018).
Sands used in sugarcane production in Florida have low levels of organic matter, silt, and clay, and they provide little N through mineralization of organic matter and possess a low capacity for N retention as a result. Because these soils are highly leachable, N must be managed well to ensure adequate nutrition for the crop as well as protection of groundwater. Management of N applications is especially critical because of high rainfall during the grand period of growth between June and mid-October.
Previous N recommendations for sand soils in Florida were based on research from the 1970's and earlier. In 1974, Gascho and Freeman recommended an N rate for sands of 150 lb N/acre in four split applications for plant and ratoon crops. In 1994, the recommendation was increased to 180 lb N/acre. Obreza et al. (1998) demonstrated the importance of split N applications on Florida sands, determining that annual cane and sugar yields were significantly increased with five split applications (compared to three splits) for first-year plant cane crops, and with four split applications (compared to two splits) for ratoon crops.
At a workshop in 2006, growers expressed concern that the 180 lb N/acre rate was not adequate for all situations on sands. A study was conducted to determine sugarcane yield response to N on south Florida sand soils (McCray et al. 2014). The data analysis focused on sugar yield instead of biomass because sugar is the economic product. Results of the study were used to revise the UF/IFAS N recommendations for sugarcane grown on sand soils.
Sugar Yield Response to Nitrogen
Four small-plot trials were established in grower fields with soils representative of mineral soils in south Florida (McCray et al. 2014). Sugarcane variety CP 78-1628 was grown at Sites 1, 2, and 4, and variety CL 88-4730 was grown at Site 3. Soil organic matter content ranged from 0.72 to 1.69% at these locations. At Sites 1 through 3, N rates were 140, 180, 220, 260, and 300 lb N/acre/yr. At Site 4, N rates were 0, 60, 120, 180, and 240 lb N/acre/yr. Average yield for each annual sugarcane crop at each location is shown in Tables 1 and 2, measured in tons sugar/acre (TSA).
Linear and nonlinear regressions were used to relate relative sugar yield to N rate. To determine relative yield, TSA for each N rate at each location and crop year was divided by the highest treatment TSA for that location and crop year, giving the highest TSA for that location and crop year a relative yield of 1.0 (vertical Y-axis on the following graphs). Relative yield was used in this analysis to allow comparison among crop years and locations. Regression analysis was done separately for plant cane crops and ratoon cane crops (first and second ratoon crops combined) due to the differences in the duration of their growth periods.
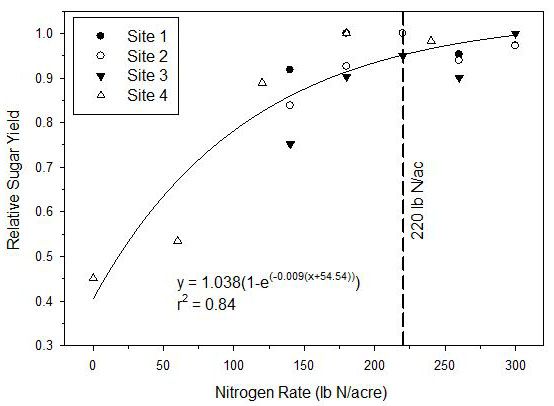
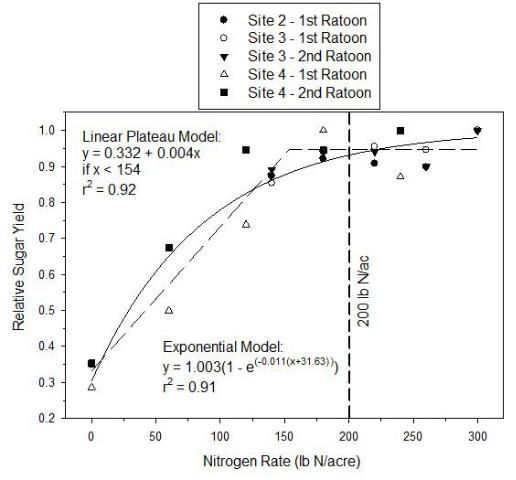
For plant cane, an exponential model was the most effective way to relate relative sugar yield with N rate (Figure 1). This model predicted 95% (Y-axis value of 0.95) of the maximum relative sugar yield was produced with N application rates of 214 to 223 lb N/acre. This includes the 220 lb N/acre rate used at Sites 1 through 3. For ratoon cane, two models indicated strong relationships between relative sugar yield and N rate. The linear plateau model for ratoon cane predicted that maximum relative yield was achieved through a minimum rate of 154 lb N/acre. The exponential model for ratoon cane predicted 95% of the maximum relative sugar yield was produced with rates between 196 and 205 lb N/acre (Figure 2). N fertilizer rates required to achieve 95% relative sugar yield in exponential models for plant and ratoon crops were higher than the previous UF/IFAS recommendation of 180 lb N/acre.

Credit: McCray et al. (2014)

Credit: McCray et al. 2014
In comparisons of split N applications, there were no differences in TSA between treatments of four or five applications each year for plant cane. One of the two ratoon crops had increased TSA with four split applications instead of three. Although rainfall data were not recorded in this study, rainfall patterns in individual years can be expected to be an important factor affecting N availability and yield as the number of split applications is varied.
Revised Nitrogen Recommendations
The soils selected for this study were representative of low organic matter values in sandland sugarcane in Florida. N recommendations for these soils were determined using the N rate required to achieve 0.95 relative yield in each exponential model for plant and ratoon crops. The minimum N rate required to reach the plateau in the linear plateau model for ratoon crops was not used because of the sharp reduction in yield as N rate fell below 154 lb N/acre. It would be economically impractical to select an N rate associated with a major yield reduction. N rates based on 0.95 relative yield values from the exponential models should provide optimum yields without excessive fertilizer application. The UF/IFAS recommendations for N application to sandland sugarcane are 220 lb N/acre for plant cane and 200 lb N/acre for ratoon crops (Table 3).
Based on this study and previous research by Obreza et al. (1998), five split applications are recommended for plant cane and four split applications are recommended for ratoon crops (Table 3). These numbers of split applications can be used to keep each application below the 62.5 lb N/acre rate suggested by Muchovej and Newman (2004) in order to prevent enrichment of nitrate as nitrogen in groundwater. This study only examined soluble N sources, but growers should also consider a combination of controlled-release N and water-soluble N fertilizers to support reduced N rates and fewer split applications.
These recommendations are based on a field study conducted over the course of six years, but they may not reflect all rainfall situations in relation to N applications. Because there can be situations of leaching rainfall soon after N applications, an allowance of an additional 30 lb N/acre is included for specifically defined rainfall events. This allowance is restricted to specific locations with rainfall amounts equal to or greater than 4 inches in two days and within 20 days after a soluble N application (Table 3).
References
Gascho, G. J., and C. E. Freeman. 1974. Fertilizer Recommendations for Sugarcane. Belle Glade AREC Research Report EV-1974-18. Gainesville: Florida Cooperative Extension Service, University of Florida.
McCray, J. M., K. T. Morgan, L. Baucum, and S. Ji. 2014. "Sugarcane yield response to nitrogen on sand soils." Agronomy Journal 106: 1461–1469. https://doi.org/10.2134/agronj13.0513
Muchovej, R. M., and P. R. Newman. 2004. "Nitrogen fertilization on a sandy soil: II. Soil and groundwater analyses." Journal of American Society of Sugarcane Technologists 24: 225–240.
Obreza, T. A., D. L. Anderson, and D. J. Pitts. 1998. "Water and nitrogen management of sugarcane grown on sandy, high-water-table soil." Soil Science Society of America Journal 62: 992–999. https://doi.org/10.2136/sssaj1998.03615995006200040021x
VanWeelden, M., S. Swanson, W. Davidson, and R. Rice. 2018. Sugarcane variety census: Florida 2017. Sugar J. 81(2):10-19.
Effects of N rate and number of split N applications on tons sugar/acre for each crop year at Sites 1-3 in the sugarcane N study (McCray et al. 2014).
Effects of N rate on tons sugar/acre for each crop year at Site 4 in the sugarcane N study (McCray et al. 2014).