Introduction
This publication is intended primarily for Florida sugarcane (Saccharum spp.) growers, but it may also be useful to researchers and others interested in sugarcane nutrition or best management practices (BMPs). It presents phosphorus (P) fertilizer recommendations for sugarcane produced for sugar on Florida mineral soils along with supporting information.
Sugarcane has the largest acreage of row crops in Florida (http://quickstats.nass.usda.gov/), with approximately 29% of the crop now grown on mineral soils in and adjacent to the Everglades Agricultural Area (EAA) in southern Florida (VanWeelden et al. 2021). Most of the crop is grown on organic soils in the EAA, but because all available land in the EAA is in crop production, any expansion of sugarcane acreage will be on mineral soils. Mineral soils in sugarcane production in Florida are sands with low organic matter content (typically 1.0%–2.5%) and low water- and nutrient-holding capacities.
Phosphorus is a primary plant essential nutrient. It is required in lower amounts by sugarcane than many other crops, including most vegetables (Liu et al. 2015). Phosphorus removed from the field with sugarcane harvest ranges from 0.32 to 0.44 lb P/ton cane (0.73–1.01 lb P2O5/ton cane), which translates to 36–50 lb P2O5/acre for a 50 ton/acre crop. Phosphorus removal at harvest was determined to be about 63% of total crop accumulation in aboveground biomass accumulation on an organic soil (Coale et al. 1993). The remaining 37% of P accumulation would be returned to the soil in decomposing leaves and other unharvested material, or removed in ash from the field by preharvest burning. Phosphorus mineralization from organic matter is a major contributor of P available for crop growth in organic soils in the EAA. However, in low-organic matter soils, mineralization is not a major source of P for crop growth.
Phosphorus is an element of environmental concern in southern Florida due to potential impacts on water quality. Therefore, following BMPs regarding P fertilizer application in this region is essential. Soil testing is a BMP that is critical for economic and environmental reasons. Previous P recommendations for sugarcane on mineral soils date back to the mid-1970s. Changes in cultivation practices (e.g., new sugarcane varieties and improved use of soil amendments such as calcium silicate and dolomite) in recent years point to the need to develop new P fertilizer recommendations for sugarcane on sand soils. A study examining sugarcane yield response to P fertilizer was conducted at seven locations (Table 1). All seven test sites were on mineral soils in or adjacent to the EAA, either east, west, or southwest of Lake Okeechobee in south Florida. Sites 1, 3, and 4 were Immokalee sands; Site 2 was a Holopaw fine sand; Site 5 was a Pinellas fine sand; Site 6 was a Myakka sand; and Site 7 was a mix of Basinger sand and Immokalee sand (McCray et al. 2022). Sugarcane P fertilizer recommendations for Florida mineral soils were developed based on that study.
Sugarcane Yield Response to P Fertilizer
Sugarcane varieties, planting dates, and initial soil characteristics are given in Table 1 for the seven locations of the P rate trials. Initial soil test P values for the Mehlich 3, ammonium acetate, and water extractants are shown for each site. The Mehlich 3 extractant was chosen for calibration in the study (McCray et al. 2022), and P fertilizer recommendations are based on soil test units expressed as g/m3.
Table 1. Sugarcane cultivar, planting date, number of crops, soil organic matter (SOM) concentration, soil pH, air-dry soil density, and initial soil-extractable P using Mehlich 3 (M3P), ammonium acetate (AmP), and water (Pw) for each site of the P rate study.
Yield response to P fertilizer was analyzed separately for Site 1 because the P rates were different compared to those at the other six locations (Tables 2 and 3). After the establishment of Site 1, the decision was made to set up P fertilizer rates with an even distribution of rates up to 125 lb P2O5/acre to cover the most realistic range of potential responses for Sites 2–7. At Site 1, rates ranged from 19–150 lb P2O5/acre, in addition to the control (zero rate). There were significant increases at this site in tons cane/acre and tons sugar/acre with application of P fertilizer compared to the zero P treatment (Table 2). These yield increases were attributable to increases in stalk weight and stalk population with P fertilizer application. Phosphorus fertilizer application did not influence sucrose concentration (lb sugar/ton cane). There was no yield increase beyond the 75 lb P2O5/acre rate at Site 1 (Table 2).
Table 2. Harvest data means for the P rate study at Site 1 including tons cane/acre (TCA), tons sugar/acre (TSA), lb sugar/ton cane, stalk weight, and stalks/ft row.
Table 3. Harvest data means for the P rate study at Sites 2-7 including tons cane/acre (TCA), tons sugar/acre (TSA), lb sugar/ton cane, stalk weight, and stalks/ft row.
In the overall analysis for Sites 2–7, P fertilizer rate did not significantly influence sugarcane yield (Table 3). However, in the analysis of each crop year at each site, in the second ratoon crop at Site 4, there were significant increases in tons cane/acre and tons sugar/acre with P fertilizer application.
Soil P, Leaf P, and Sugarcane Yield
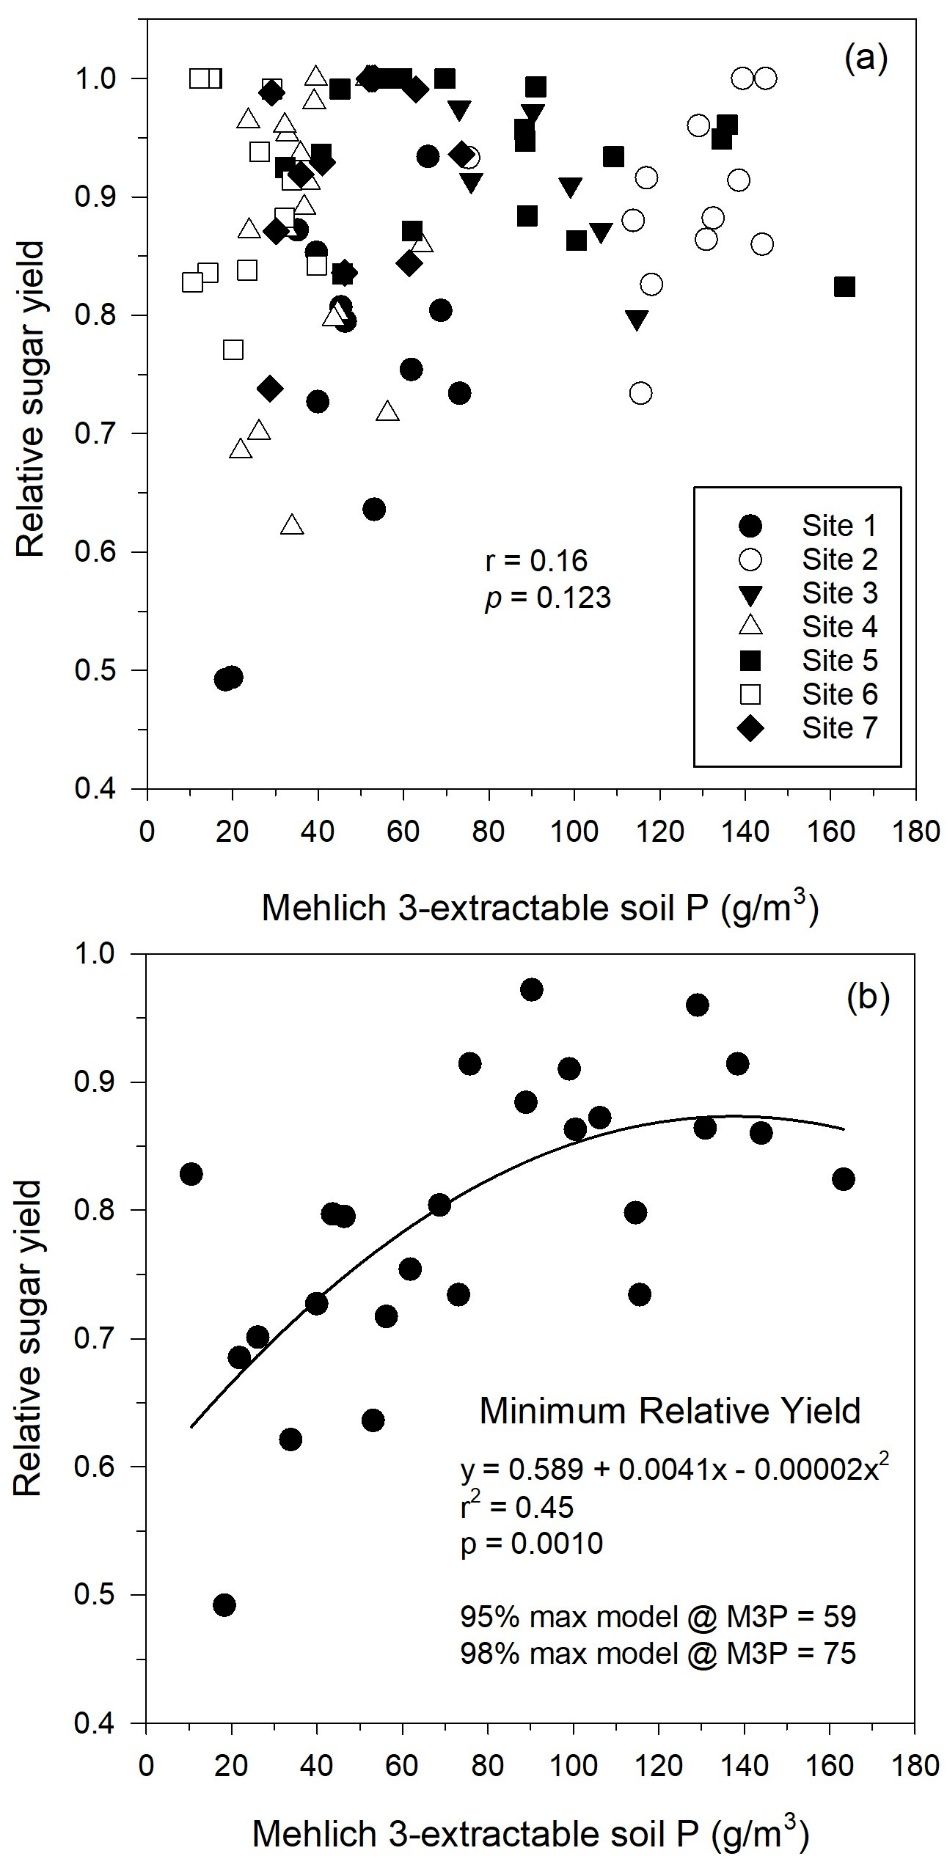
Figure 1 uses relative sugar yield as the measure of sugarcane yield. Relative sugar yield was determined by dividing tons sugar/acre for each plot by the tons sugar/acre of the highest-yielding plot in that replication for each crop year at each site. The maximum relative yield in this graph is 1.0. When evaluating zero P treatments as in Figure 1, relative yield between 0.9 and 1.0 indicate that there was little response to P fertilizer. Lower relative yield for zero P treatments is associated with stronger responses to P fertilizer. Relative yield is used because it allows comparison of yield response across different years and locations.

Credit: McCray et al. (2022)
Figure 1 shows the relationship between pre-crop Mehlich 3-extractable P (M3P) for zero P plots (no fertilizer P) and relative sugar yield. The correlation between M3P and relative sugar yield (Figure 1a) was not significant for all individual zero P plots, but the graph indicates that there were plots at Sites 1, 4, 6, and 7 with relative yield less than 0.8.
At relatively low soil test values (M3P), there was a wide range in relative yield without added P fertilizer (Figure 1a). Relative sugar yield at lower M3P values (< 30 g P/m3) ranged from 0.49 to 1.00. At higher soil P levels, there was a smaller range in relative yield, and generally higher relative yield. The wide range of relative yield at low soil test P values may be attributable to inherent field variability in these mineral soils (Muchovej et al. 2000) and other growth factors that may be limiting growth in addition to P. When other growth factors are limiting, these can mask potential yield responses to P fertilizer. These other growth-limiting factors could include weeds, water availability, availability of nutrients other than P, or any other factor limiting growth across one of the study sites.
Because relative sugar yield for zero P plots could be as low as 0.49 at low M3P (Figure 1a), the relationship of minimum relative sugar yield with M3P was determined (Figure 1b). Figure 1b was developed by graphing the lowest relative sugar yield for each 5 g/m3 M3P increment with the associated M3P value. The quadratic model was the best-fitting model evaluated for the resulting data set. The relationship of minimum relative sugar yield with M3P is useful for ensuring that adequate P is available across the range of growing conditions for sugarcane on mineral soils in Florida. For the quadratic model in Figure 1b, 98% of the maximum relative yield predicted by the model was achieved with an M3P value of 75 g P/m3.
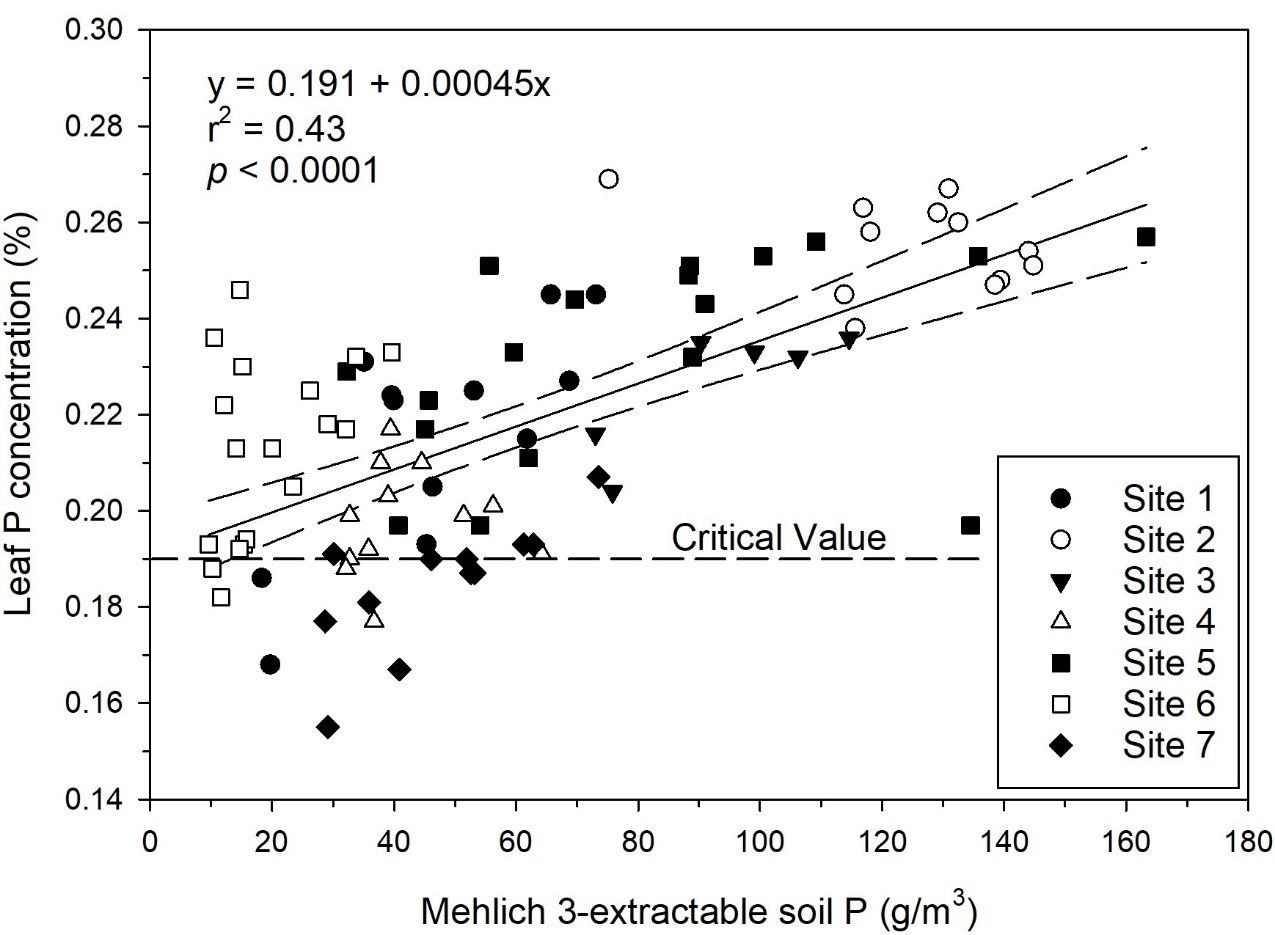
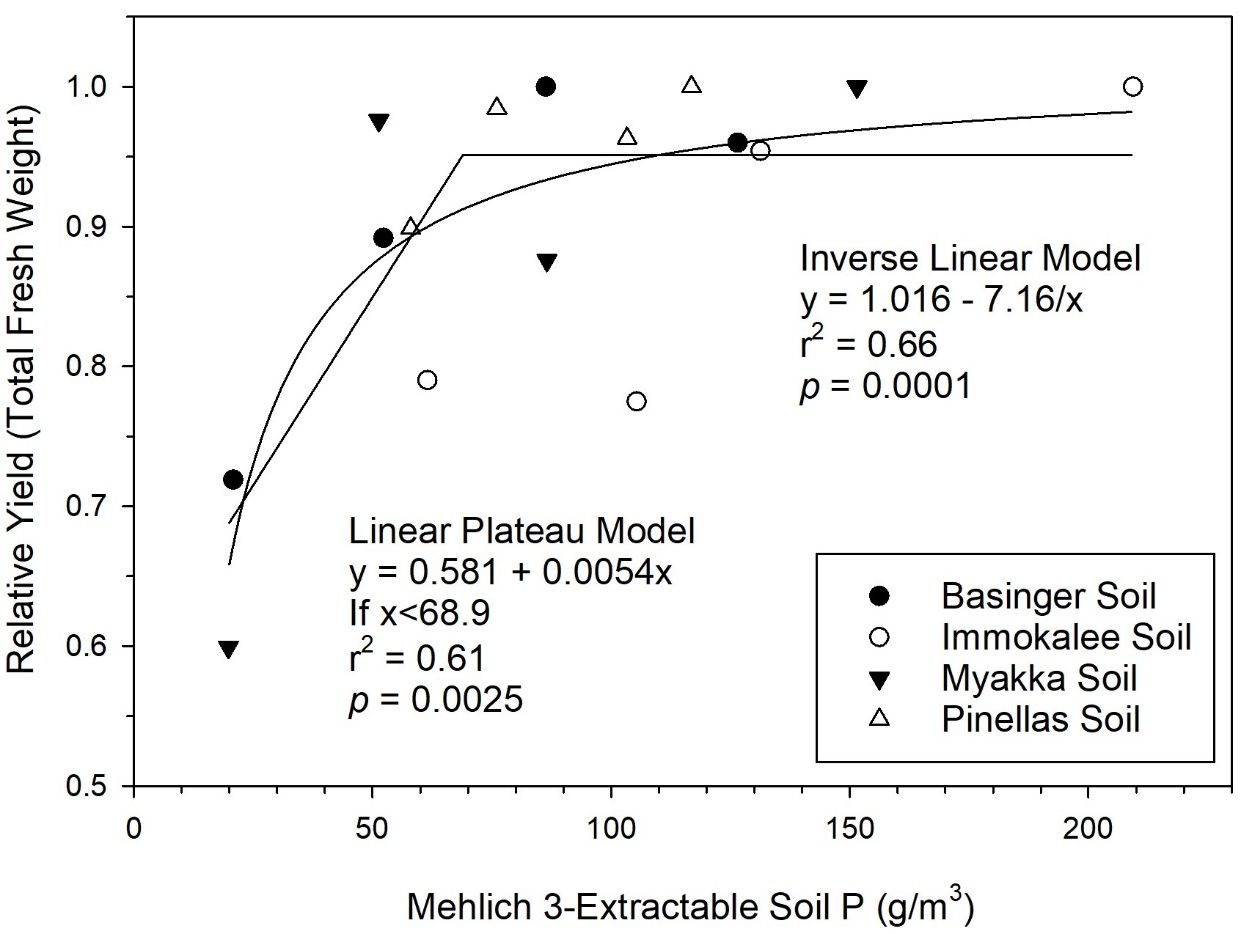
In addition to relations with relative yield, relationships of soil test P with leaf P concentration can be used to determine sufficiency of soil P. Although leaf P concentrations did not have strong positive correlations with sugarcane yield in this study, leaf P critical value (0.19%) and optimum range (0.22%–0.30%) are well-defined (McCray and Mylavarapu 2020). In a linear regression of M3P and leaf P concentration for zero P plots (Figure 2), a minimum M3P value of 78 g P/m3 was required for the lower confidence limit to achieve 0.22% leaf P concentration. Also, there were individual zero P plots with leaf P concentration below the critical value at Sites 1, 4, 6, and 7. This indicates that soil P was insufficient for optimum crop growth at those locations without P fertilizer. A recent pot study with similar soils determined that there was a sugarcane biomass yield response up to an M3P value of 69 g P/m3 (Figure 3) (Alvarado et al. 2019). The sugarcane growth response under more controlled conditions in the pot study demonstrates that P fertilizer is required when soil test P is limiting in these soils.

Credit: McCray et al. (2022)

Credit: Alvarado et al. (2019)
Soil Test P Calibration
Based on yield responses determined in this study, a maximum P fertilizer rate of 75 lb P2O5/acre should be adequate for sugarcane growth on mineral soils. This P rate matches the previous maximum rate for sugarcane on mineral soils and the maximum rate for sugarcane on organic soils in Florida (McCray et al. 2018). Based on achieving 98% of maximum relative yield with an M3P value of 75 g P/m3 in a relationship of minimum relative yield and M3P (Figure 1b) and achieving 0.22% leaf P (lower end of optimum range) with a minimum M3P value of 78 g/m3 (Figure 2), a break point of 80 g/m3 for M3P is set, above which no P is recommended for plant cane (Table 4). Three soil test categories were defined to receive P fertilizer for plant cane up to 80 g P/m3.
Banding P fertilizer is a BMP in Florida. After fertilizer is banded, collecting representative soil samples for ratoon crops is difficult, so fertilizer recommendations are made for plant and ratoon crops based on samples from a disked field before planting. Results from this study indicate that without P fertilizer there is an average reduction in M3P values of 20% annually. This has been used to adjust P recommendations for ratoon crops (Table 4). Slightly lower P fertilizer rates were included for lower soil test values in older ratoon crops to allow for lower nutrient removal with lower sugarcane yields later in the crop cycle.
Table 4. Recommended phosphorus fertilizer for each sugarcane crop based on pre-plant Mehlich 3-extractable soil phosphorus.
References
Alvarado, J. S., J. M. McCray, J. E. Erickson, H. S. Sandhu, and J. H. Bhadha. 2019. “Sugarcane Biomass Yield Response to Phosphorus Fertilizer on Four Mineral Soils as Related to Extractable Soil Phosphorus.” Communications in Soil Science and Plant Analysis 50:2960–2970. doi:10.1080/00103624.2019.1689260.
Coale, F. J., C. A. Sanchez, F. T. Izuno, and A. B. Bottcher. 1993. “Nutrient Accumulation and Removal by Sugarcane Grown on Everglades Histosols.” Agronomy Journal 85:310–315. doi:10.2134/agronj1993.00021962008500020028x.
Liu, G. D., E. H. Simonne, K. T. Morgan, and G. J. Hochmuth. 2015. “Soil and Fertilizer Management for Vegetable Production in Florida.” HS711. Gainesville: University of Florida Institute of Food and Agricultural Sciences. https://edis.ifas.ufl.edu/publication/CV101
McCray, J. M., S. Ji, and J. S. Alvarado. 2022. “Sugarcane Yield Response to Phosphorus Fertilizer as Related to Extractable Soil Phosphorus on Florida Mineral Soils.” Communications in Soil Science and Plant Analysis 53:1942–1959. doi:10.1080/00103624.2022.2070188.
McCray, J. M., and R. Mylavarapu. 2020. “Sugarcane Nutrient Management Using Leaf Analysis.” SS-AGR-335. Gainesville: University of Florida Institute of Food and Agricultural Sciences. https://edis.ifas.ufl.edu/publication/AG345
McCray, J. M., R. W. Rice, and A. L. Wright. 2018. “Phosphorus Fertilizer Recommendations for Sugarcane Production on Florida Organic Soils.” SS-AGR-348. Gainesville: University of Florida Institute of Food and Agricultural Sciences. https://edis.ifas.ufl.edu/publication/SC091
Muchovej, R. M., Y. Luo, J. M. Shine Jr., and J. C. Jones. 2000. “Nutritional Problems Associated with Low Yield of Sugarcane on Mineral Soils.” Proceedings of the Soil and Crop Science Society of Florida 59:146–150.
VanWeelden, M., S. Swanson, W. Davidson, M. Baltazar, and R. Rice. 2021. “Sugarcane Variety Census: Florida 2020.” Sugar Journal 84(2): 6–15.