Introduction
Soil testing is a multistep process starting with the collection of a sample that adequately represents the area or field to be tested. Once the sample is received, the laboratory begins a three-step process: (1) nutrient extraction from the soil sample and analysis; (2) interpretation of test results; and (3) nutrient recommendations (Mylavarapu 2009). Each step's procedures are specific to the inherent soil characteristics and the location of the soil, and are subject to a wide variety of factors, such as crops being grown, prior soil and nutrient management, and the soil's physical and chemical properties. Therefore, it becomes important to consider all of these factors carefully when choosing an appropriate chemical extractant for soils in a region. Due to wide-ranging soil conditions across Florida and the United States, multiple soil test methods exist.
Extractants
Extracting potential plant-available nutrients from soil prior to planting is accomplished with specific reagents that mimic the extraction of nutrients from the soil by plant roots using similar pH ranges found near crop roots. The amount of nutrients removed by a particular extraction procedure is not a direct measure of actual supply of those nutrients. Rather, it is an index that can be used to field-calibrate the test for nutrient availability (Alva 1993).
During the 1970s, Florida along with several other southeastern US states adopted Mehlich-1 (M1) as the official extractant for acidic soils. This adoption was a result of the continued search for improved methods, accuracy, low cost, and quick turnaround time that are critical for the labs (Mylavarapu et al. 2002; Mylavarapu 2009). The advent of Inductively Coupled Plasma Spectrophotometers (ICPs) has rapidly enhanced laboratory throughput from a few dozen to a few hundred samples per day.
Dr. Adolf Mehlich—while working as a consultant at the North Carolina Department of Agriculture during the 1950s and 1970s—developed the Mehlich-1, Mehlich-2, and Mehlich-3 series of soil extractants for the acidic soils of the United States, each one as an improvement over the previous in the sequence. While Mehlich-2 failed completely at the outset, Mehlich-1 and Mehlich-3 soil extractants were found effective. Therefore, only Mehlich-1 and -3 are discussed below.
Mehlich-1 (Dilute Double Acid)
Mehlich-1, or the dilute double-acid extractant, is one of the earliest versions of "universal" soil extractants (single chemical reagent that can extract all the essential plant nutrients), and is especially suited for the acidic, low organic matter, mineral soils of the southeastern United States. Adopting the M1 procedure enabled universal extraction of all standard plant nutrients in the soil sample, including P, K, Ca, Mg, Zn, Cu, Mn, and B. The M1 extractant is composed of two dilute acids: 0.05M HCl and 0.0125M H2SO4 (Table 1). Mehlich-1 was the soil extractant used as the standard method by the UF/IFAS Extension Soil Testing Laboratory for acidic-mineral soils in the state. This extractant is well designed for soils in the acidic pH range with low CEC (Mylavarapu and Miller 2014).
However, M1 should not be used to extract neutral or alkaline soils. When exposed to a neutral or alkaline pH soil, M1 rapidly loses effectiveness because the dilute acids are effectively neutralized. M1 is also rendered ineffective in soils with high cation exchange capacity (CEC), high Al and Fe accumulation, and high organic matter (>5%) content.
Mehlich-3 (M3)
In order to overcome the limitations of M1, Mehlich improved the chemistry and developed the Mehlich-3 (M3) extraction solution (Mehlich 1984). In the M3 extractant, the two dilute double acids used in M1 have been replaced with 0.2M CH3COOH, 0.015M NH4F, 0.013M HN03, 0.001M EDTA, and 0.25M NH4N03. Presence of 0.001M EDTA essentially enhanced the extraction of micronutrients, particularly Cu. It was expected that this extractant would also make the extraction of Mn and Zn consistent and result in a better correlation with plant uptake. In the M3 development process, emphasis was placed on detection of micronutrient deficiencies compared with toxicities. Soil sample pH in the acidic range of pH ~ 2.5 (accomplished through the addition of 0.2M CH3COOH) was required during the M3 extraction process to take advantage of the fluoride component. A pH of 2.5 helped prevent reaction of Ca and F to form a CaF2 precipitate. The fluoride facilitated the extraction of phosphates associated with Fe and Al while ammonium nitrate (NH4NO3) effectively extracted exchangeable cations. State extension laboratories in several southern US states have since moved to the M3 extraction procedure because of its improved efficiency (particularly for micronutrients) and its broad range of applicability (slightly beyond neutral pH) (Zhang et al. 2014). Also, the M3 procedure has been the only soil test extraction method that has been validated through interlaboratory studies for extraction of plant-available phosphorus and used as a reference method for testing soil materials for extractable P (Zhang et al. 2009).
Standardized Soil Test Procedures
The North American Proficiency Testing program is instrumental in facilitating the soil testing process by regular sample exchange among nearly 150 state and commercial labs currently enrolled, with about six labs using M1 and over 50 labs using M3 (NAPT 2014). Therefore, it becomes important for agricultural extension personnel and crop professionals to know how the M3 soil test results relate to crop performance and current nutrient recommendations. Extensive field calibration and verification studies are required for implementing a specific extraction procedure in any state (Eckert and Watson 1996). However, the cost and the required length of time are usually prohibitive, and therefore calibration equations based on laboratory analyses are necessary interim measures for most soil testing laboratories (Sims 1989).
Based on this information, a study was conducted with the objective of developing conversion data between M1 and M3 for acid-mineral soils of Florida. Development of such conversion equations for soil nutrients provides a close approximation of data from various soil testing laboratories using different extractants.
Agronomic Crop Nutrient Requirement
Multiple soil and edaphic factors dynamically influence the availability of soil nutrients to plants, particularly P. The first ever attempt in soil testing was, therefore, made to estimate P availability among all other nutrients. Unique P extracting reagents were developed and used for predictive soil testing, primarily to estimate availability of soil P to crops for agronomic sustainability. With the advent of universal extractants such as M1 and M3 plus the ICP technology, other macro- and micro-nutrients are now being simultaneously determined using a single extractant.
Interpretation of the nutrient concentrations determined in a soil sample must be matched with the crop nutrient requirement. This aspect is accomplished through correlation and field calibration work by the soil fertility specialists. By definition, once the soil concentration of nutrients exceeds the Medium interpretation category, positive response to added fertilizer is not expected by agricultural crops, landscape plants, or turf, and therefore no recommendation for application of that particular nutrient is made. It is important that the methods employed best reflect the dynamic factors that contribute to the nutrient availability. M1 has worked well for more than 20 years when used with acidic mineral soils of Florida.
With time, in southwest Florida and at other Florida locations, the pH of the native acidic mineral soils has increased to 7.0 or higher in agriculturally managed fields that have received long-term overapplication of lime and liming materials (Morgan 2010). This increase in pH has rendered the M1 extractant ineffective. The weak double-acid mixture in the M1 extractant is neutralized once the soil pH is 7.0 or higher. Similar trends are being observed in home landscapes around the state. For example, soil samples analyzed from 48 home landscapes in a Sarasota County residential community had a mean soil pH of 7.5 with an overall range from 6.5 to 8.1. Comparison of soil extractant data on these landscapes showed that that M1 overestimated the P availability for the majority of the sites (Shober and Pearson 2010). This inability of the M1 soil test to predict crop response will impact areas subjected to fertilizer restrictions that call for soil test evidence of potential for plant response before application. Also, a similar survey of soils from new residential developments in the Orlando metro area (no landscapes established) showed that soils had a mean pH of 5.95 but a maximum soil pH of 8.71 (Shober and Pearson 2010). Increase in soil pH is also related to the increased use of irrigation with water from the limestone aquifer. As pH increased, most vegetable farmers stopped liming, so the continued increase in pH was probably more due to irrigation with high pH water and its liming effect.
Due to these new data, it is imperative that a more reliable extraction technique be adopted for mineral soils in Florida. Based on the results from multiple field calibrations in Iowa, Mallarino and Sawyer (1999) concluded that the capacity of the M3 soil test to predict crop responses to added P across soils of varying pH is much better compared with the Bray soil test, the P extraction method previously adopted by Iowa. The Bray extraction is similar to the M1 extractant used in Florida.
Research data have revealed that the M3 extractant (Mehlich 1984) has a better promise as a soil extractant for the soils in the United States, particularly in the South. M3 has the advantage of potentially being used for extraction of other macro- and micronutrients (Mehlich 1984) and has been determined to be useful as a P extractant on a wide range of soil types (Hanlon and Johnson 1984; Tran et al. 1990). Studies on multiple field sites in Iowa showed that the M3-P results were much better in many high-pH soils and M3 is possibly well suited for several other soils in neighboring states (Mallarino and Sawyer 1999). M3 extraction procedure is being increasingly used in several states in the southern region (SERA-IEG-6 2009) because of its improved efficiency in nutrient extraction (particularly micronutrients) and its broad range applicability to soils with pH >7.0 (Mylavarapu 2002; Zhang et al. 2014). In anticipation of adopting M3 as the extractant for Florida soils, Mylavarapu et al. (2002) developed conversion equations between M1 and M3 for 519 samples from several counties in the state. Depending on the resources available, field calibration data can be developed for M3 in the future. M3-based interpretations have been estimated for citrus (Obreza and Morgan 2011). Recently, M3 has been adopted as the extractant solution for all sugarcane grown on Histosols (McCray et al. 2012).
Mehlich-3 for Environmental Assessments
Soil test results are also being integrated into water quality assessment tools. Therefore, it is critical that a diagnostic tool adopted for a particular soil category is technically adequate and effective. Inappropriate techniques can lead to unnecessary rates of nutrient applications leading to avoidable and negative water quality impacts. Mehlich-3 has been shown to be a more effective extractant than M1 for metals that determine environmental risk of P loss from soils.
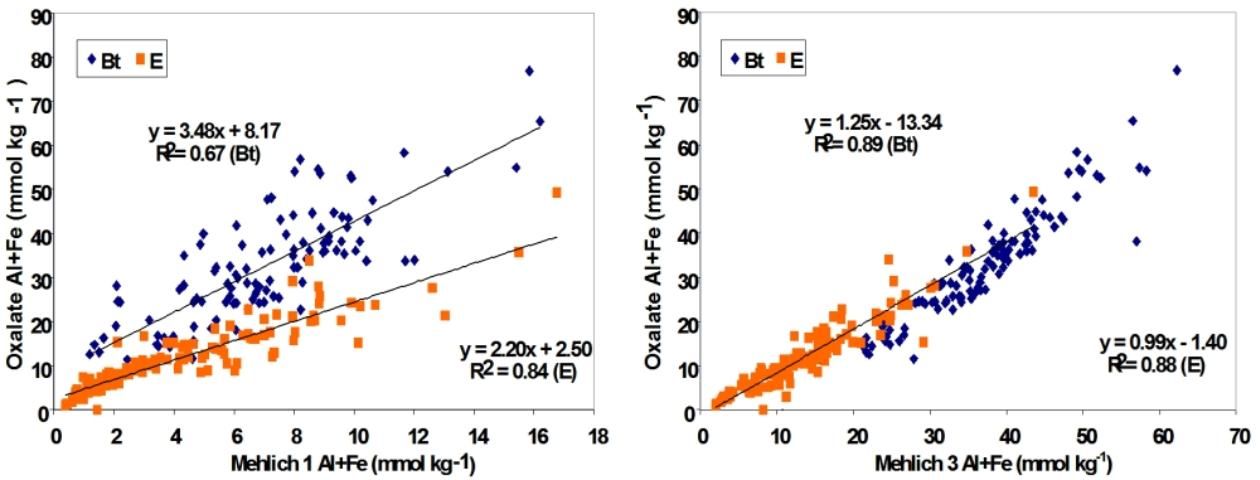
For extraction of soil-bound phosphorus in a high Al and Fe environment, the ideal extraction reagent is ammonium oxalate, which is used for research purposes. However, due to the length of time and reaction conditions required, the oxalate procedure is not compatible for routine laboratory testing and speed. Harris et al. (2004) developed correlations with Mehlich extractants and found that M3 had the best correlation with oxalate extraction method compared to M1 extractant (Figure 1). Use of M3 as a soil extractant also showed significant advantage in predicting P movement through different horizons in the soil profile, enhancing the validity of the Florida Phosphorus Index (PI), a crucial tool for assessing the vulnerability of various soils for P losses to the environment. One of the factors computed for the PI is the ratio of a soil test P to extractable Fe and Al, followed by a calculation of the Capacity Index (or Capacity Factor; Nair and Harris 2004; Nair et al. 2010; Chakraborty et al. 2011). Based on data that showed M3 as a more effective extractant for Fe and Al, it was recommended that M3 be used instead of M1 for calculation of the Capacity Index to determine environmental risk of P loss from soils. Also, the tool will estimate how much P can be safely added to the soil, which requires a thorough extraction of Fe and Al oxides.

Credit: Harris et al. (2004)
Adoption of M3 for Florida
Due to the stated reasons, the UF/IFAS Plant Nutrient Oversight Committee approved the change from M1 to M3 in 2010. Consequently, a technical committee was constituted within the Department of Soil and Water Science to develop interpretations for M3. The committee looked at a large data set from a more recent comparative study of more than 280 samples from many soil series and most counties in Florida. The samples were analyzed for plant nutrients using both M1 and M3 extractants and showed enhanced correlations for phosphorus, potassium, and magnesium.
The committee initially looked at the data summarized in the following Tables—2a, 2b, and 2c—and determined that interpretations could be drawn as the first approximation. The rounded-off values derived from the normalized values in Tables 2a, 2b, and 2c were used as the basis to develop the interpretation (Table 3), and the interpretation categories are not based on the correlation models. The committee discussed the interpretation categories and determined that Very Low and Very High categories were redundant. Since no recommendations for nutrient application are made once the test result is High, the committee concluded that the Very High category did not serve any purpose. Similarly, because very few agriculturally managed soils tested in the Very Low category for P, the Very Low category did not effectively serve any useful purpose. Also, most vegetable crops have the same nutrient recommendation for both Very Low and Low categories. Therefore, in the M3 interpretation, Very Low and Very High categories were not included. This approach also helped dispel any misperceptions that these categorizations somehow related to negative environmental impacts. These categories purely demonstrate only the agronomic crop requirements of nutrients and, therefore, do not have any implications on water quality. Based on this approach, interpretations for M3 were adopted (Table 3) in August 2013.
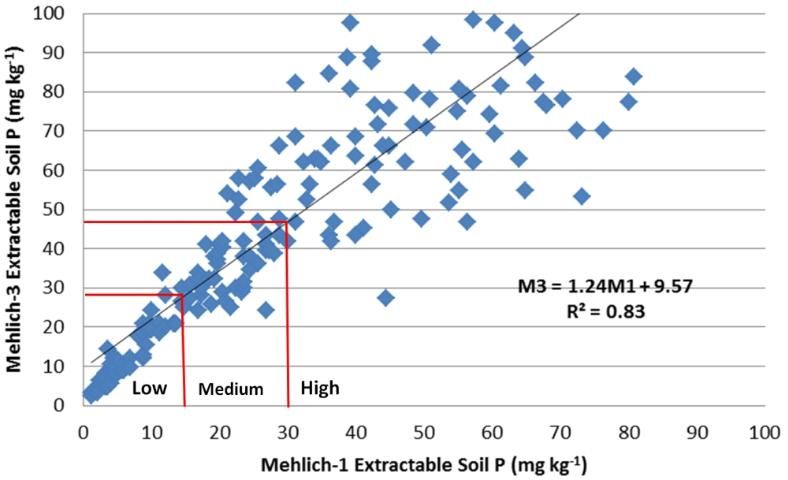
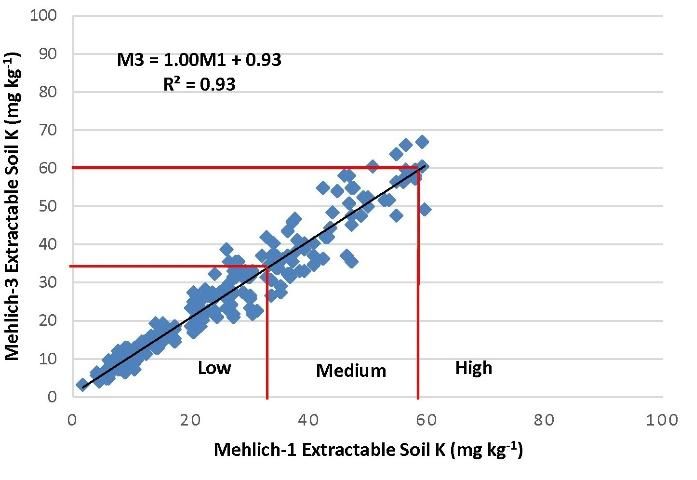
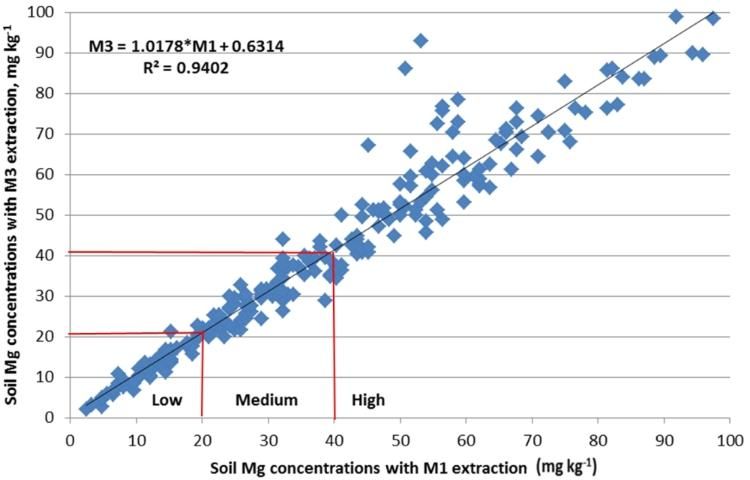
In March of 2014, the committee reassessed the interpretations and examined the adequacy of the correlations (Figures 2–4). It was noted that M3 extracted more phosphorus in many soils with a wide range of pH and organic matter content, because the fluoride in M3 increased the extractability of P from aluminum and iron phosphates. Figure 2 illustrated the increased M3 value compared with M1. The correlation equation in Figure 2 indicated a greater slope of 1.35 with larger M3 extractable soil P concentration than the extractable P from the same soil by M1. Thus, the low P index of 15 mg kg-1 for M1 equates to an M3 concentration of 27 mg kg-1 (Table 2). Likewise, the high P index increases from 30 mg/kg to 47 mg/kg. Unlike P, soil extractable K and Mg are nearly identical between M1 and M3 (Figures 2 and 3).
Based on these observations, the technical committee revised the M3 interpretation in March 2014 (Table 4). The new interpretations have been correlated with the M1 interpretations, as closely and realistically as possible, so the actual nutrient recommendations are not changed.


References
Alva, A.K. 1993. "Comparison of Mehlich 3, Mehlich 1, Ammonium Bicarbonate-DTPA, l.OM Ammonium Acetate, and O.2M Ammonium Chloride for Extraction of Calcium, Magnesium, Phosphorus, and Potassium for a Wide Range of Soils." Comm. Soil Sci. Plant Anal. 24 (7–8), 603–612.
Eckert, D.G., and Watson, M.E. 1996. "Integrating the Mehlich-3 Extractant into Existing Soil Test Interpretation Schemes." Commun. Soil Sci. Plant Anal. 27 (5–8), 1237–1249.
Harris, W., V. Nair, R. Rhue, D. Graetz, R. Mylavarapu and G. Kidder. 2004. Unpublished data from USDA-IFAFS project entitled Manure Phosphorus Management in the Suwannee River Basin. 2000–2004.
Korndorfer, G. H., D. L. Anderson, K. M. Portier, and E. A. Hanlon. 1995. "Phosphorus soil test correlation to sugarcane grown on Histosols in the Everglades." Soil Sci. Soc. Am. J. 59: 1655–1661.
Mallarino, A. and J. Sawyer. 1999. Interpreting Mehlich-3 soil test results. p. 11–14. In Integrated Crop Management Newsletter, IC-482(2). Iowa State University, Ames, IA.
McCray, J.M., R.W. Rice, and A.L. Wright. 2012. Phosphorus Fertilizer Recommendations for Sugarcane Production in Florida Organic Soils. Gainesville: University of Florida Institute of Food and Agricultural Sciences. https://edis.ifas.ufl.edu/sc091.
Mehlich, A. 1984. "Mehlich 3 Soil Test Extractant: A Modification of Mehlich 2 Extractant." Comm. Soil Sci. Plant Anal. 15 (12): 1409–1416.
Morgan, K. Increasing Soil pH in agricultural soils of south Florida. Personal Communication. Southwest Florida Research and Education Center, IFAS, Immokalee, FL 34142.
Mylavarapu, R.S. 2009. "Diagnostic Nutrient Testing." HortTech. 20: 19–22.
Mylavarapu, R.S., J.F. Sanchez, J.H Nguyen, and J. M. Bartos. 2002. "Evaluation of Mehlich-1 and Mehlich-3 extraction procedures for plant nutrients in acid mineral soils of Florida." Comm. Soil Sci. Plant Anal. 33: 807–820.
NAPT. 2014. North American Proficiency Testing, Soil Science Society of America, WI, USA. https://www.naptprogram.org/.
Obreza, T.A., M. Zekri and K. Morgan. 2011. Soil and Leaf Tissue Testing. In Nutrition of Florida Citrus Trees. ed. T. Obreza and K. Morgan. Gainesville: University of Florida Institute of Food and Agricultural Sciences. https://edis.ifas.ufl.edu/ss478.
Shober, A.L. and B. Pearson. 2010. "Evaluation of soil physical and chemical properties at newly constructed residential home sites to improve plant growth and environmental quality." Final report. Gainesville: University of Florida. p. 7.
Sims, J.T. 1989. "Comparison of Mehlich 1 and Mehlich 3 Extractants for P, K, Ca, Mg, Cu and Zn in Atlantic Coastal Plain Soils." Comm. Soil Sci. Plant Anal. 20: 1707–1726.
Zhang, H., D.H. Hardy, R. Mylavarapu, and J.J. Wang. 2014. "Mehlich-3." In Soil Test Methods from the Southeastern United States. Southern Cooperative Series Bulletin No. 419. USDA-SERA-IEG-6. ISBN 1-58161-419-5. https://aesl.ces.uga.edu/sera6/PUB/MethodsManualFinalSERA6.pdf.
Zhang H, Kaiuki S, Schroder JL, Payton ME, Focht C. 2009. "Interlaboratory validation of the Mehlich 3 method for extraction of plant-available phosphorus." J AOAC Int. 92: 91–102.