Introduction
Soil-forming factors are well known, and soil properties are measurable, but the current emphasis on soil health requires an integrative assessment of how intrinsic soil properties are affected by soil management (Doran and Zeiss 2000). From a grower's perspective, this means considering not only how soil management decisions affect the chemical health of a soil (pH, nutrient content) but also the soil's biological and physical health, such as its organic matter content and water-holding capacity. Evaluating changes in soil properties associated with flooded fields during the summer months in the Everglades Agricultural Area (EAA) provides us an opportunity to assess the effect of soil management associated with flooded versus dry-fallow field conditions on Histosols. The information will be beneficial not just to growers in south Florida who currently farm flooded rice but also to those who are planning to do so in the future. In addition, this information will be useful for our Extension agents who work on rice and for soil conservation agencies such as the USDA Natural Resources Conservation Service (NRCS).
Rice has been commercially grown in the EAA since 1977 after it was demonstrated that rice could be successfully grown in rotation with sugarcane during the summer fallow period. During the summer period, more than 55,000 ac of fallow sugarcane land is available for rice production. In 2018, approximately 25,000 ac of rice was planted in the EAA (Bhadha et al. 2019). The net value of growing rice in the EAA as a rotation crop far exceeds its monetary return. In addition to rice being a food crop, production of flooded rice provides several benefits to the agroecosystem. In the EAA, flooding fields greatly reduces the negative impacts from issues related to soil subsidence (Bhadha et al. 2020), nutrient depletion, and insect pests (Cherry et al. 2015). This, in turn, enhances the subsequent sugarcane crop and maximizes the longevity of the soil by reducing soil loss caused by oxidation. In addition, incorporating rice as a rotation crop in the EAA during the summer months provides local employment (Schueneman et al. 2008).
Studies have shown that soil loss due to oxidation is directly related to the redox condition of the soil. Generally, well-drained soils oxidize at a faster rate than those under flooded or poorly drained conditions. Implementation of Best Management Practices (BMPs) in the mid-1990s has led to more water storage on EAA fields, which helps to reduce organic matter decomposition and decrease soil oxidation rate (Bhadha and Schroeder 2017). Another commonly implemented BMP in the EAA is to rotate sugarcane with rice and leafy winter vegetables. If sugarcane after second ratoon is harvested in spring, chances are the growers would consider directly cultivating rice afterward. However, if sugarcane after second ratoon is harvested in early fall or winter, then growers may plant either sweetcorn or lettuce until it is hot enough to plant rice (late spring–early summer). Because rice in the EAA is typically grown under flooded conditions, it is an optimal rotational crop planted in late spring–early summer, which helps reduce soil oxidation. Continuation of BMP implementation by growers, development of flood-tolerant crops such as rice, reduced tillage, and adoption of crop rotations have the potential to minimize subsidence and increase the longevity of the soil for agricultural use.
The objectives of this study were to evaluate soil health response of flooded-fallow versus dry-fallow conditions in the EAA compared to cultivating flooded rice (Figure 1). Six different farming practices were evaluated using a set of soil health indicators. The six farming practices covered the most common rotation programs in the region: (1) sugarcane followed by ratoon rice (two successive rice crops); (2) sugarcane followed by a single rice crop; (3) sweetcorn followed by rice; (4) lettuce followed by rice; (5) sugarcane followed by flooded fallow; and (6) sugarcane followed by fallow (Figure 2). These farming practices are typical to the EAA during the summer period. Soil health indicators tested include (i) pH, (ii) bulk density (BD), (iii) organic matter content (OM), (iv) maximum water-holding capacity (MWHC), (v) cation exchange capacity (CEC), and (vi) active carbon (AC) (Table 1).

Credit: Jehangir H. Bhadha, UF/IFAS

Response to Soil Health Indicators under Flooded versus Dry-Fallow Conditions
pH
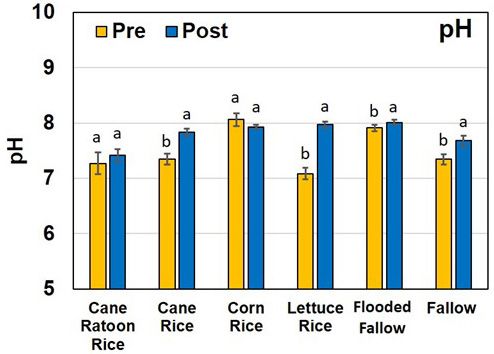
The pH values for all soil samples were neutral to alkaline and ranged from 7.08 to 8.06. The high pH values of the soils are a result of years of mixing of underlying limestone (calcium carbonate) bedrock with the top soil (Figure 3). As these soils get shallower, the mineral fraction comprised of Ca- and Mg-based minerals increases the soil pH. Increase in soil pH is a major concern for growers in the EAA because it can potentially lower the bioavailability of P and micronutrients from the soils. Increase in soil pH was observed both in flooded conditions and under fallow practices.
Bulk Density
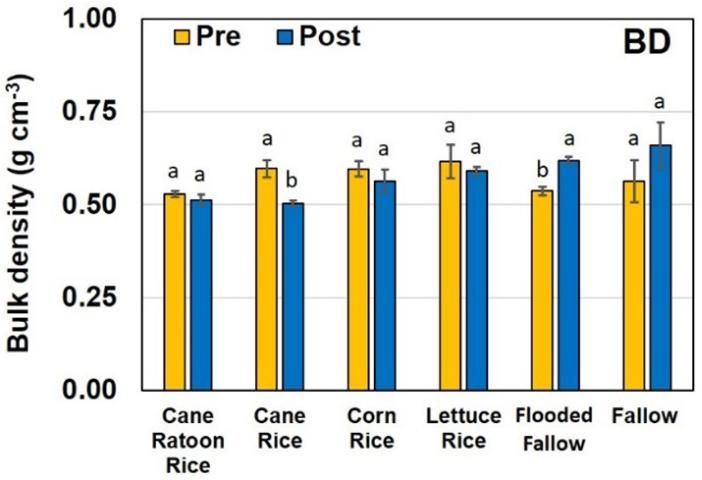
Bulk density of the soils ranged from 0.50 to 0.66 g cm-3 (Figure 4). Significant decrease in soil BD was observed between pre and post soil of the cane rice farming practice. Decrease in BD observed between the pre and post soil samples may be due to the increase in organic matter content associated with the rice root density in the top soil (Figure 3). Once rice gets harvested, the roots and a few inches of the stalks remain in the soil and are tilled prior to planting the subsequent crop. This lowering of soil BD is preferred because it facilitates aeration, improves tilth, and limits root constriction. The significant increase observed in soil BD in the flooded fallow fields is due to compaction of the soil and lack of root density associated with rice cultivation.
Organic Matter
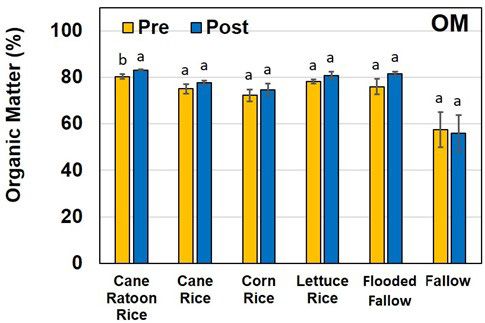
Organic matter content of the soils ranged from 72%–83%, except for fallow treatments, which had 56%–57% OM (Figure 5). Increasing soil OM is key to improving soil health (Doran and Zeiss 2000). Soils with high OM and aggregates can have higher water-holding capacity that can be delivered to plants during dry spells (Bhadha et al. 2017). Water is increasingly becoming the most limited natural resource supporting agriculture, but growers in the EAA can improve their water-storage capacity by raising their soil's OM content. Due to the inherent high (greater than 60%) OM content of "muck" soils, small increases in OM content do not have the same effect as in mineral soils containing less than 2% OM.
Maximum Water-Holding Capacity
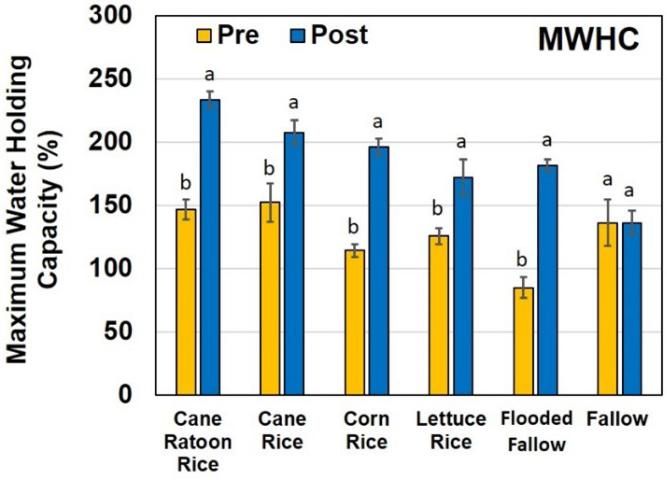
There was a significant increase in soil MWHC of soils that were flooded, including all four treatments of rice cultivation and the flooded fallow fields (Figure 6). This increase in MWHC is probably related to the increase in finer-sized material in the form of silt and clay that gets delivered to the flooded fields with the irrigation water. Daroub et al. (2018) showed that at time of irrigation, the finer high-organic-mass-fraction matter tends to be light and flocculent, with high phosphorus mass fractions. It has low bulk density and is readily transportable. The finer material has greater surface area, allowing the soils to retain a greater amount of water. Bhadha et al. (2017) were able to demonstrate that by adopting farming methods that increase soil OM, growers can increase the MWHC of their soils.
According to the USDA-NRCS, the most conservative estimates suggest that every 1% increase in soil OM will help soils hold up to 20,000 gallons more water per acre.
Cation Exchange Capacity
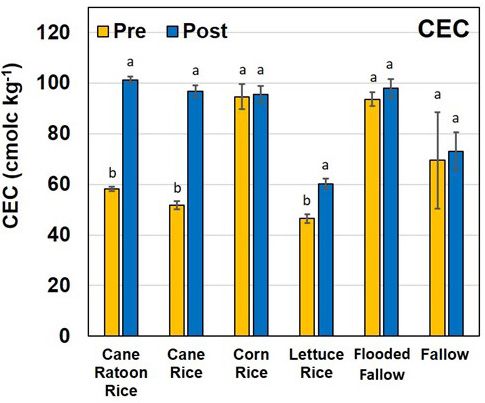
Cation exchange capacity (CEC) significantly increased between the pre and post soils for the cane ratoon rice, cane rice, and lettuce rice farming practices (Figure 7). The CEC of soils is primarily controlled by the carbon content and clay-sized-particle fraction of soils. The Histosols within the EAA inherently have a very high carbon content (>70%) (Anderson et al. 1990), and hence the CEC values are higher than 50 cmolc kg-1. An increase in soil CEC between the pre and post soils is considered a positive change because it can potentially retain nonfoliar fertilizer and pesticides longer in the soil matrix. Pal and Vanjara (2001) were able to demonstrate that malathion (insecticide) and butachlor (herbicide) had greater affinity for soils composed of minerals like bentonite with higher CEC and higher surface area compared to kaolinite. Also, as the pH increases, so does the CEC of organic matter as well as some clay minerals. Because hydrogen (H+) on humus is neutralized by liming, the site where it was attached now has a negative charge and can hold Ca++, Mg++, K+, etc. This could explain why cane ratoon rice, cane rice, and lettuce rice increased in soil CEC between pre- and post-sampling.
Active Carbon
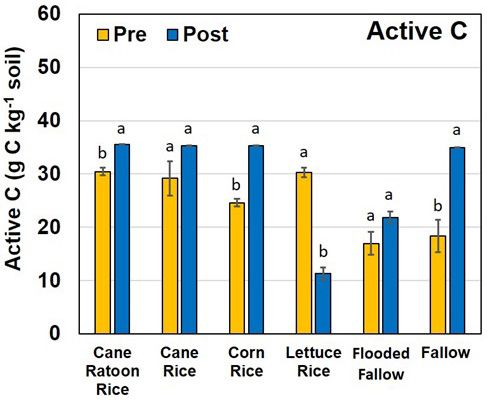
The amount of active C content in a soil is a measure of the C that is susceptible to being mineralized to CO2 under ambient conditions over a short period of time. Active C was one of the three most important indicators of soil health that was positively correlated with crop yields; Roper et al. (2017) showed that active C present in soils was increased with reduced tillage and often with organic amendments. Soil loss via oxidation is a concern in the EAA, so an increase in active C is not necessarily perceived as an ideal situation. When comparing flooded rice cultivation farming practices to fallow fields, almost 16 g kg-1 of active C was generated during summer when the fields were left fallow, whereas no more than 8 g kg-1 of active C was generated under flooded practices (Figure 8). From a soil sustainability point of view, this is beneficial because it demonstrates that cultivating flooded rice during summer in the EAA can lower the soil carbon oxidation rates.
Conclusions
The MWHC increased significantly under all "flooded" land practices compared to dry-fallow fields; from a soil health perspective this is advantageous, especially for water storage during dry spells. This increase in MWHC is probably related to the increase in finer-sized material in the form of silt and clay that that gets delivered to the flooded fields with the irrigation water. The finer material has greater surface area, allowing the soils to retain a greater amount of water. More research is needed to verify these changes and to define a mechanism that causes these changes. In terms of soil loss, left fallow, soils within the EAA generate more active C that is highly susceptible to oxidation during the hot summer months in south Florida, compared to soils that are either flooded or planted with rice. From a soil sustainability point of view, this should encourage growers to consider planting more acreage of rice during summer months that will lower the rate of active C loss via oxidation and ultimately improve quality and sustainability of the soils in the region.
References
Anderson, D. L. 1990. "A Review: Soils, Nutrition, and Fertility Practices of the Florida Sugarcane Industry." Soil and Crop Science Society of Florida 4:78–87.
Bhadha, J. H., J. M. Capasso, R. Khatiwada, S. Swanson, and C. LaBorde. 2017. Raising Soil Organic Matter Content to Improve Water Holding Capacity. SL447. Gainesville: University of Florida Institute of Food and Agricultural Sciences. https://edis.ifas.ufl.edu/ss661
Bhadha, J. H., and B. L. Schroeder. 2017. "Best Management Practices for Maintaining Water Quality in Sugarcane Cultivation." In Achieving Sustainable Cultivation of Sugarcane Volume 1: Cultivation Techniques, Quality and Sustainability, edited by P. Rott. Cambridge, UK: Burleigh Dodds Science Publishing.
Bhadha, J. H., L. Trotta, and M. VanWeelden. 2019. Trends in Rice Production and Varieties in the Everglades Agricultural Area. SL439. Gainesville: University of Florida Institute of Food and Agricultural Sciences. https://edis.ifas.ufl.edu/ss653
Bhadha J. H., A. L. Wright, and G. Snyder. 2020. Everglades Agricultural Area Soil Subsidence and Sustainability. SL311. Gainesville: University of Florida Institute of Food and Agricultural Sciences. https://edis.ifas.ufl.edu/ss523
Cherry, R., M. Tootoonchi, J. Bhadha, T. Lang, M. Karounos, and S. Daroub. 2015. "Effect of Flood Depth on Rice Water Weevil (Coleoptera: Curculionidae) Populations in Florida Rice Fields." Journal of Entomological Science 50 (4): 311–317. https://doi.org/10.18474/JES15-05.1
Daroub, S. H., J. D. Stuck, T. A. Lang, and O. A. Diaz. 2018. Particulate Phosphorus in the Everglades Agricultural Area: II—Transport Mechanisms. SL198. Gainesville: University of Florida Institute of Food and Agricultural Sciences. https://edis.ifas.ufl.edu/ss417
Doran, J. W., and M. R. Zeiss. 2000. "Soil Health and Sustainability: Managing the Biotic Component of Soil Quality." Applied Soil Ecology 15:3–11. https://doi.org/10.1016/S0929-1393(00)00067-6
Jenkinson, D. S., and D. S. Powlson. 1976. "Effects of Biocidal Treatments on Metabolism in Soil—V: A Method for Measuring Soil Biomass." Soil Biology & Biochemistry 8 (3): 209–213. https://doi.org/10.1016/0038-0717(76)90005-5
Pal, O. R., and A. K. Vanjara. 2001. "Removal of Malathion and Butachlor from Aqueous Solution by Clays and Organoclays." Separation and Purification Technology 24 (1–2): 167–172. https://doi.org/10.1016/S1383-5866(00)00226-4
Roper, W. R., D. L. Osmond, J. L. Heitman, M. G. Wagger, and S. C. Reberg-Horton. 2017. "Soil Health Indicators Do Not Differentiate among Agronomic Management Systems in North Carolina Soils." Soil Science Society of America Journal 81 (4): 828–843. https://doi.org/10.2136/sssaj2016.12.0400
Schueneman, T., C. Rainbolt, and R. Gilbert. 2008. Rice in the Crop Rotation. SS-AGR-23. Gainesville: University of Florida Institute of Food and Agricultural Sciences. https://ufdc.ufl.edu/IR00001556/00001
Sumner, M. E., and W. P. Miller. 1996. "Cation Exchange Capacity and Exchange Coefficient." In Methods of Soil Analysis, Part 3: Chemical Methods, edited by D. L. Sparks, A. L. Page, P. A. Helmke, R. H. Loeppert, P. N. Soltanpour, M. A. Tabatabai, C. T. Johnston, and M. E. Sumner, 1201–1230. Madison, WI: Soil Science Society of America, Inc., American Society of Agronomy, Inc.