Applying optical sensing technology in agriculture has become increasingly prevalent for assessing corn grain production. However, comprehensive research endeavors notably remain limited in addressing the efficacy of employing the Normalized Difference Vegetation Index (NDVI) as a predictive tool for corn grain yield in the specific context of Florida. A dedicated study focusing on nitrogen (N) rates was meticulously designed in 2022 to address this knowledge gap. The primary objective of this study was to provide critical insights and empirical evidence to our Extension agents and the community of corn farmers. Its overarching aim is to elucidate the practical utility of NDVI sensors in forecasting crop output and facilitating precise estimations of N requirements.
Detail of the Experiment
In 2022, a comprehensive study on N rates was conducted at the UF/IFAS North Florida Research and Education Center-Suwannee Valley (NFREC-SV) located in Live Oak, Florida. This study encompassed two distinct crop history sites, designated Site 1 (S1) and Site 2 (S2). The two sites were chosen due to their distinct backgrounds. S1 had a short cultivation history (~5 years), and S2 had a long-term cultivation history (more than 40 years). In addition, S1 had higher organic matter compared to S2.
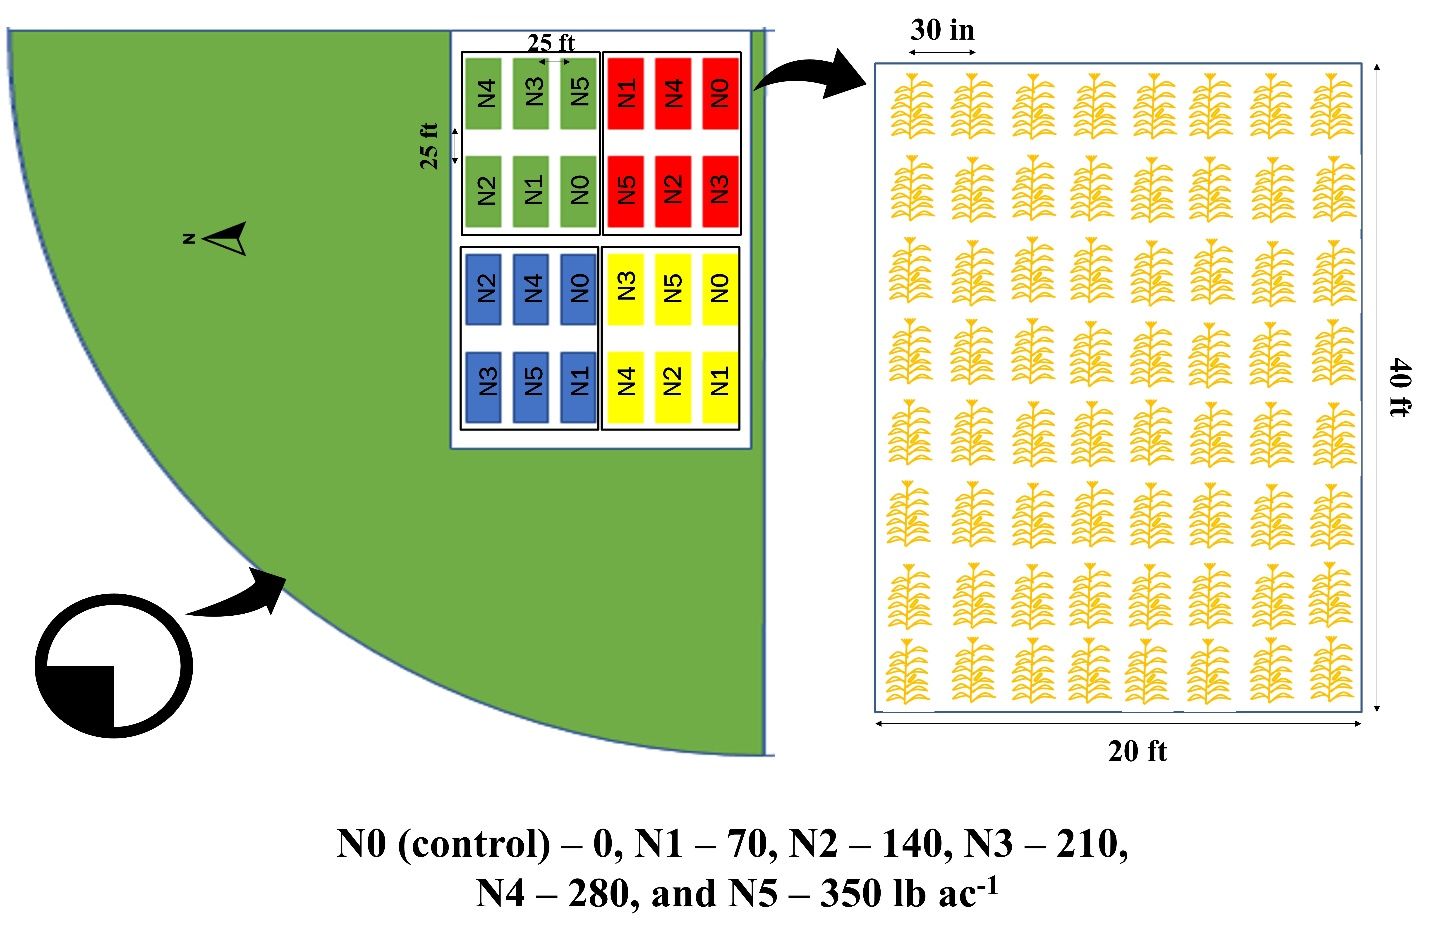
The corn variety utilized for this research was 'Pioneer 1870', and it was uniformly planted on both sites on April 1, 2022, with a specific target plant population of 34,000 plants per acre (ac-1). Each of the two sites included 24 distinct plots serving as experimental units. These plots were subjected to six different N rates, ranging from 0 to 350 pounds of N per acre (lb N ac-1), with four replications for each rate (Table 1). The individual plots were characterized by dimensions of 20 feet in width and 40 feet in length, containing eight corn rows spaced 30 inches apart (Figure 1). To ensure the prevention of any potential cross-contamination of N rates, strategically positioned corridors measuring 25 feet in the north–south direction and 15 feet in the east–west direction were erected between the plots and blocks.
Except for the control plot, all N sources employed in this study consisted of urea (46-0-0) and were manually applied in seven separate splits, as detailed in Table 1. All other macronutrients were applied in adequate doses for the development of corn.
Table 1. This table shows the split N (urea, 46-0-0) rates used on separate experimental plots of novel hybrid 'Pioneer 1870' corn cultivated at the North Florida Research and Education Center in Live Oak, Florida.

Credit: Diego A. H. S. Leitão, UF/IFAS
In the course of our trials, one handheld sensor was utilized to gather sensing data at specific growth stages: 17 (V4 stage), 32 (V6 stage), 39 (V8 stage), 60 (V12 stage), 74 (VT stage), and 82 (R1 stage) days after planting (DAP).
For the acquisition of NDVI readings, this study employed a Crop Circle ACS-435 active crop canopy sensor from Holland Scientific, Lincoln, Nebraska. These readings were recorded subsequently by a GeoSCOUTX datalogger. The sensor detects crop reflectance in three wavelength bands using three photodetectors: red (660–680 nm), red edge (720–740 nm), and near-infrared (770–780 nm). The NDVI is calculated as a ratio of the difference between near-infrared and red reflectance and the sum of both reflectance wavelengths. Continuous NDVI scans were conducted while walking at a consistent speed along the entire length (40 feet) of each plot's central row. The average of 80 scan results was calculated during each scanning session to represent each plot. The NDVI data were collected at 25 (NDVI25), 32 (NDVI32), 39 (NDVI39), 60 (NDVI60), 74 (NDVI74), and 82 (NDVI82) DAP.
Results
NDVI Response Curve Over Time (DAP)
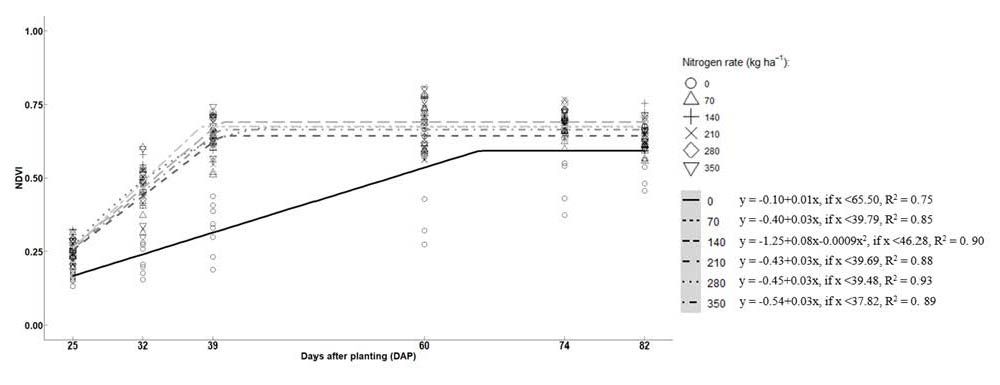
Figures 2 and 3 show the trend of NDVI over time (i.e., days after planting, DAP) using comparable response curves. During the growth season, linear plateau and quadratic plateau models (for 140 lb N ac-1) best described NDVI behavior. For N-treated plots, similar trend lines were found throughout time, with NDVI rising from 25 to 39 DAP and then staying steady from 39 to 90 DAP. However, control (0 lb N ac-1) plots clearly indicated a distinct trend line, with generally lower NDVI, and the plateau was noted after 66 DAP (Figure 2). These results show that NDVI is useful early, estimated before reaching the V8 leaf stage, which is the key growth stage for corn to start N uptake from the soil (Sharma and Bali 2017). Corn absorbs more than 75% of the total required N after the V8 leaf stage. Therefore, sensor applicability in Florida is promising.

Credit: Diego A. H. S. Leitão, UF/IFAS
NDVI Relationship with Yield

Credit: Diego A. H. S. Leitão, UF/FIAS
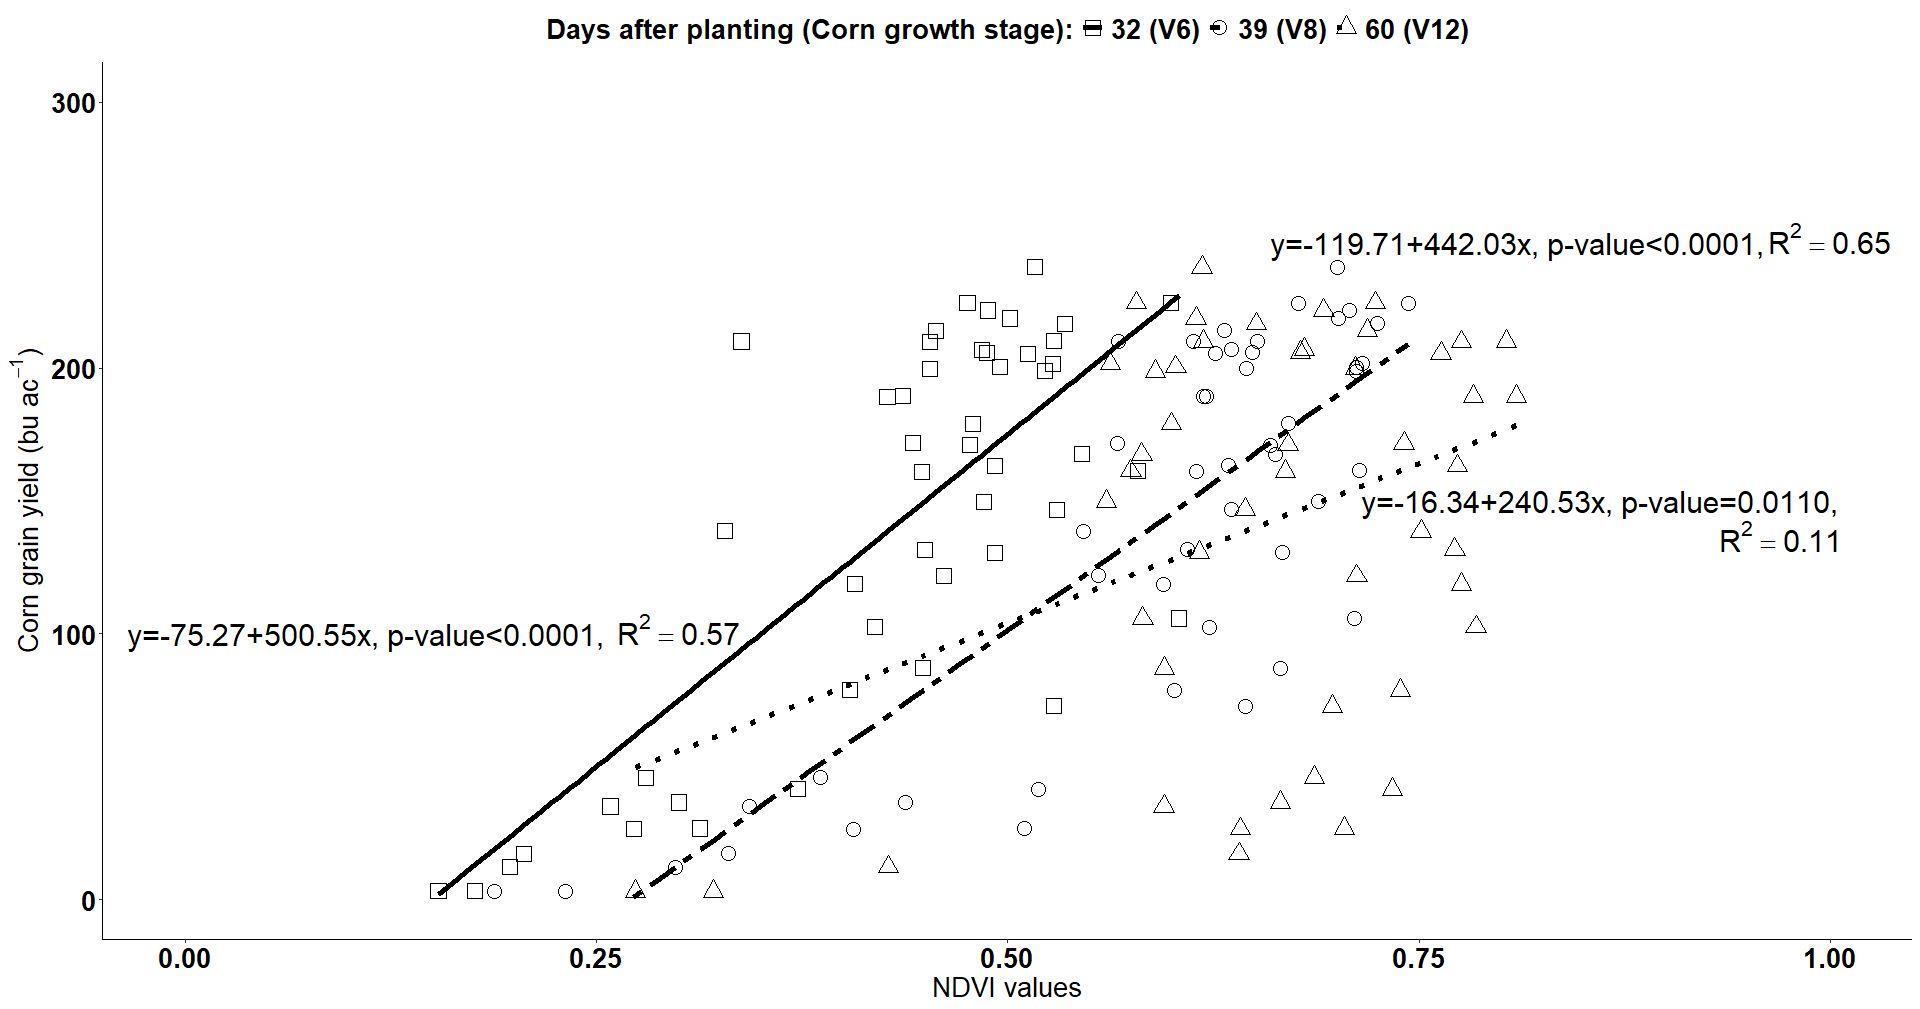
The relationship between NDVI and yield was strongest at 39 DAP with an R2 value of 0.65. This result is invaluable for determining the N requirement through a linear equation. The study also revealed that sensing at stages beyond this point did not yield a strong correlation between NDVI and yield. However, relationships detected before 39 DAP were still more robust than those observed at later stages. Typically, 39 DAP aligns with the V6–V8 leaf stage of corn when the plant absorbs approximately 75% of its total N requirement. Thus, gauging the N requirement using the NDVI sensor at this stage could be innovative.
Discussion
Early detection of N deficiencies in corn before the tassel stage can significantly impact a grower's ability to address these deficiencies, ultimately affecting corn grain yield (Varvel et al. 2007). Similarly, if growers can predict corn grain yield early in the season, they can make more informed decisions about applying late-split N to achieve their desired outcomes. Hence, the development of a predictive model using variables derived from early-season data holds economic benefits, particularly if it is straightforward and user-friendly, making it more appealing to growers (Leitão et al. 2023).
It is worth noting that there is conflicting empirical evidence regarding annual variations in optimal N rates, which may be influenced by spatial and temporal variations in weather conditions (e.g., wet vs. dry years) and crop characteristics (e.g., different hybrids planted each year). Modern corn hybrids accumulate more total N, especially after silking, which reflects their improved stress resistance (Mueller and Vyn 2017). Furthermore, variations in estimating corn grain yield using NDVI data may also be influenced by spatial and temporal factors. Therefore, conducting long-term studies is essential to gather more evidence on these variations.
Regarding the relative importance of predictors for corn grain yield, the N application rate emerged as the most influential variable in all selected models. This aligns with the global trend of increased fertilizer use, which has contributed significantly to yield gains over the years (Nelson and Congdon 2016). The global consumption of N fertilizer has risen substantially and is projected to continue increasing, thus indicating potential yield improvements in the future. However, further research is needed to fully understand how new corn hybrids will respond to higher N rates. The NDVI and plant height were the second most influential variables for Model 15.
In summary, NDVI handheld sensors are potential tools for identifying early-season N deficiency. The observed behavior of NDVI in our study may be attributed to the rapid N uptake by corn leaves during early growth stages (Panek and Gozdowski 2020).
Conclusions
Our experiment was anchored on a robust statistical research design and factored in multiple locations. As such, our results highlight the promising potential of using remote sensing data, particularly NDVI measurements, as essential tools for estimating corn grain yield in Florida. It is important to note that more accurate corn grain yield predictions can be made by examining various corn characteristics, encompassing both physical and spectral traits, throughout the growth cycle. Our research identified a notably robust relationship between corn grain yield and early-season NDVI (e.g., at 39 DAP), which is especially significant for early yield predictions in Florida. This provides growers an opportunity for timely interventions to address N deficiencies before the V8 growth stage. However, it is vital to underline the need for more expansive studies across different soil and climatic conditions over several years to validate and expand upon our findings. Further, in-depth research is urgently needed to understand the post-silking N uptake by modern corn hybrids. This would shed light on their reaction to late-season N applications, potentially guiding best management practices.
Take-Home Message
The NDVI can predict yield and estimate the N requirement as early as between V6–V8 (39 DAP).
After approximately 39 days after corn planting, the NDVI became saturated, and their accuracy in estimating the N requirement weakened.
The initial strong correlation between NDVI and N rates is a significant finding. Even though growers administer N throughout the corn's growth from the time of planting, early N estimation can aid in more informed decision-making for growers.
References
Leitão, D. A. H. S., S. Sidhu, W. Griffin, U. Ahmad, and L. Sharma. 2023. “Irrigated Corn Grain Yield Prediction in Florida Using Active Sensors and Plant Height.” Smart Agricultural Technology 5: 100276. https://doi.org/10.1016/j.atech.2023.100276
Mueller, S. M., and T. J. Vyn. 2017. “Indiana Soil and Water: The Effects of Late-Season Nitrogen Applications in Corn.” AY-364-W. Purdue Extension. https://www.extension.purdue.edu/extmedia/AY/AY-364-W.pdf
Nelson, E., and C. B. Congdon. 2016. “Measuring the Relative Importance of Different Agricultural Inputs to Global and Regional Crop Yield Growth Since 1975.” F1000Research 5: 2930. https://doi.org/10.12688/f1000research.10419.1
Panek, E., and D. Gozdowski. 2020. “Analysis of Relationship Between Cereal Yield and NDVI for Selected Regions of Europe Based on MODIS Satellite Data.” Remote Sensing Applications: Society and Environment 17: 100286. https://doi.org/10.1016/j.rsase.2019.100286
Sharma, L. K., and S. K. Bali. 2017. “A Review of Methods to Improve Nitrogen Use Efficiency in Agriculture.” Sustainability 10 (1): 51. https://doi.org/10.3390/su10010051
Varvel, G. E., W. Wilhelm, J. F. Shanahan, and J. S. Schepers. 2007. “An Algorithm for Corn Nitrogen Recommendations Using a Chlorophyll Meter Based Sufficiency Index.” Agronomy Journal 99 (3): 701–706. https://doi.org/10.2134/agronj2006.0190