Introduction
This EDIS publication focuses on methods and tools for evaluating the success of your social media engagement. It is part of a series on using social media for engaging with the public about research, titled Using Social Media to Engage Communities with Research (https://edis.ifas.ufl.edu/topic_social_media).
Why evaluate your social media?
When you developed your social media plan (https://edis.ifas.ufl.edu/wc362), you determined your goals for using social media to share research with broader communities. To determine if you are reaching those goals, you must evaluate your social media activities. Ongoing evaluation will help determine what you are doing well, what can be improved, and how you might adjust your content to better reach your goals and your desired community.
While scientists increasingly report expectations that they engage with the public as part of their job duties (Hamlyn et al., 2015), they often struggle with finding ways to translate this work into a format usable for job performance reviews so that they can be credited for this work. Evaluating your social media activities can provide you with tangible, quantitative information about your activities, your impacts, and/or your reach. This can be used to strengthen your CV, your job evaluations, and the broader impacts section of your grant proposals. Evaluation information can even become peer-reviewed publication if done as part of a rigorous methodology, especially when working with knowledgeable partners in education, communication, or public engagement research.
Basic Metrics
Although social media metrics are commonly used for social media marketing for products and services, metrics can also be used to determine success of scientific engagement online. Many types of metrics can be used to evaluate the success of your social media activities. To get started, one must understand the specific meanings of different social media metric types and how these can be used to avoid misuse or misinterpretation, just as with any data. Understanding different types of metrics is vital if you intend to do any research relating to social media impact. Exact definitions and usages can also vary by platform, so be sure to look into specifics for your needs, tools, and platforms.
In this section, we will introduce generally accepted understandings of the following basic social media metrics and how they might be used in evaluation: followers, reach, impressions, engagement, and influence. Once you have mastered these basics, you may wish to consider more advanced metric frameworks (Peters et al., 2013). The specific metric or mix of metrics you choose to use should be catered to your social media goals. It may also be helpful to monitor several or all goals simultaneously, because correlations between them may pinpoint specific problems or successes. For example, if you have a large number of followers but little engagement, there could be problems in several areas. By keeping track of the other metrics, you will have a better idea of what you need to focus on to improve your engagement. Remember that determining your success also requires commitment to monitoring these metrics over time, because it generally takes time and effort to build your social media presence.
Followers
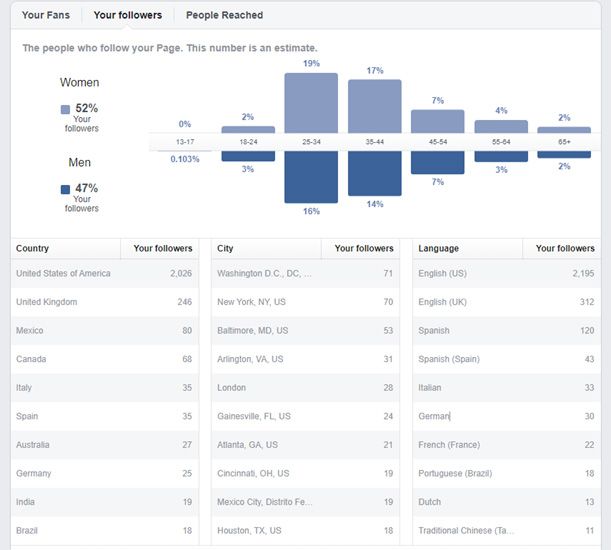
At the most basic level, this metric refers to the number of people who like or follow a page, essentially equivalent to an email signup list. Number of followers (Figure 1) is often the most used growth metric among those new to evaluating their social media because of its availability, clarity, and ease of tracking. However, using followers alone can limit understanding of how successful your social media activities are. Because of the way social media works, an account can have a large number of followers who rarely or never see or read your content, limiting the impact of your work (Baym, 2013). As with email, or even a traditional newspaper, one can subscribe without ever reading. While it is wise to keep track of this number, track followers along with additional metrics that relate more specifically to your goals. Also, do not get discouraged if it takes you longer to grow than you anticipated. Remember that bigger does not always mean better, and you can create quality, engaging content that meets your goals even with a relatively small number of followers.
At a more detailed level, you can learn more specific insights about your followers to help you determine whether you are reaching your intended community and whether your content is as accessible as it could be. Availability of certain metrics can vary by platform due to regulations and privacy restrictions. Some examples include standard demographics for any community such as gender, race, nationality, language, income level, and even what times or days your community is active on a platform. Sometimes you may find you are not reaching your intended community. In this case, it may be time to rethink your platform or content to either reach your intended community or rework your goals around the actual community you have built. For examples of platforms and associated audiences, see the Basics document in this series (https://edis.ifas.ufl.edu/wc361), and for goal-setting, see Smart Social Media—Planning for Success (https://edis.ifas.ufl.edu/wc362).

Impressions
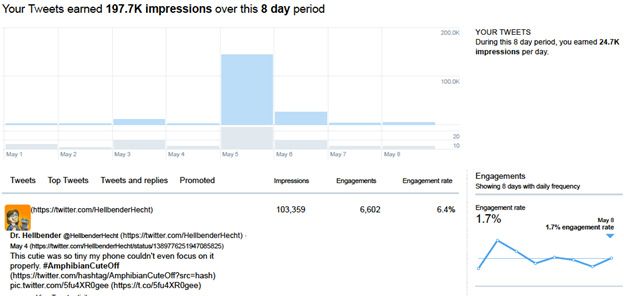
Impressions refers to how many times content is placed on a particular platform, such as in users’ feeds or timelines. In some platforms, especially when you have a closed or private group or account, this may correlate with your members or followers. On more public accounts and platforms, these numbers may not correlate at all. It is possible to have fewer impressions than followers, and vice versa. This is because many social media algorithms tend to reward engaging content (see below) by showing it to more people, even those that may not be part of your built community. Platforms may also place content into a single user’s feed multiple times or count things such as a reply shown along with the original post as a separate impression from the original post by itself. One thing to keep in mind is that the number of impressions does not tell you how many people have actually read or interacted with your content.
Reach
While the impressions metric refers to how many times a platform places a specific piece of content in front of a user, reach generally refers to how many specific people could potentially see your content. When used along with impression metrics, reach can help you determine whether your content is shown to a few people many times, that is, just your established community, or whether you have potential to reach a much larger network beyond your followers.
Engagement
Engagement refers to actions that social media users take directly on your content, such as clicking previews or links, watching videos, and liking and sharing content (Hint—remember to build these interactive elements into your content to increase chances of engagement. See Smart Social Media—Planning for Success [https://edis.ifas.ufl.edu/wc362] for more details on designing content). Engagement is the best indicator to determine whether people are actually reading and interacting with your social media content. You can even gain insight into what type of content your community prefers, based on the topics or types of posts that users are engaging with the most. Engagement can also increase your impressions and/or reach, as more engaging content is more likely to be shared to users outside your established community, either through your current users liking or sharing the content directly or through platform algorithms boosting visibility indirectly. You can also determine an engagement rate per post by dividing your engagement metrics (such as all engagement types combined or just a specific type such as views or likes) by your impressions or reach (engagements per post/impressions per post).
Influence
While there is often buzz about social media influencers, influence goes beyond engagement and number of followers. More followers and higher engagement doesn’t necessarily mean greater influence, making influence far more difficult to measure than the previously discussed metrics. Influence refers to your ability to get people to take an action, generally beyond interacting with your message. (The now defunct Klout tool and current replacements of which we are aware in November 2021 only measure online message sharing, not the broader behaviors that we refer to here.) For marketing, this might be buying a specific product or signing a petition. For science engagement, influence might be useful to focus on if you are interested in seeing a specific personal behavioral change or change in attitude or belief related to science. Measuring this can be quite difficult in an online environment with a diffuse community and no direct contact information. Obtaining the least biased results possible requires working with researchers or practitioners with expertise in social science methods such as surveys or interviews. If you want to consider your influence for personal use, you may be able to post a poll, but remember the limitations of social media and sampling people. Results will likely only sample a small portion of your total community and will likely be highly biased toward those with strong opinions and individuals who are the most regular engagers of your content, so use the results with caution.
Evaluation Tools
There are a number of software tools you can use to gather metrics easily over time and determine how you compare to your goals as well as general tips to contextualize your numbers more broadly. Some of the more sophisticated tools need to be set up in advance of collecting data; these do not collect retrospectively. For some emerging platforms, such as TikTok and Instagram, users need a professional but free account to collect basic metrics. In contrast, as of this publication, Snapchat limits insight tools to brand accounts or creator accounts reserved for profiles that have acquired at least 100 followers.

To collect your metrics:
- Facebook, Twitter, and most widely used platforms have built-in tools that you can visit within the platform application or website. Some of these tools require a professional or business account or public-type profile or page.
- While free tools are available, you can purchase more advanced tools to gain additional insights, such as following hashtag or topic trends, or viewing and evaluating different social media platform accounts in one place. These platforms often provide additional social media tools outside the scope of evaluation, such as post scheduling. Hootsuite is one commonly used example and provides both a free basic version as well as a more expansive premium version.
- If you create a hashtag, there are sites that can help measure metrics for hashtags across social media platforms rather than focusing on the evaluation of individual social media accounts. This can tell you who is influencing your tag the most, the demographics of those using the hashtag, and what hashtags are often used in association with the tag. Some examples of these types of hashtag monitoring sites include Hashtagify and KeyHole.
- Sites like Impact Story can help track the influence of social media sharing of your research on your overall scientific impact.
- Use tools such as those recommended in this Hootsuite blog post (https://blog.hootsuite.com/video-metrics/) to track the impact of specific parts of your social media, such as your video content.
Finally, partnering with evaluation experts can assist you in making the most of your efforts. UF’s Program Development and Evaluation Center offers a number of evaluation tools, including several for online-specific activities and for Extension reporting (https://pdec.ifas.ufl.edu/evaluation.shtml). Collaborating with social science faculty and graduate students can also help you dig deeper into your results, such as with the qualitative evaluation ideas suggested below.
Qualitative Feedback
In addition to numerical, quantitative metrics, understanding the types of users who follow you, those who engage with you, and what topics of discussion come up can provide valuable qualitative feedback. For example, are the users who follow you all academics? Are your followers all from a particular geographic region? What subjects are other users using your hashtag with? How do these patterns match (or not) your goals for social media engagement with your community? Collecting all your posts is more possible these days with specific types of qualitative analysis software, though these tools may often be several hundred dollars. Partnering with other qualitative researchers or using less sophisticated ways to group your data into categories are potential solutions with minimal expense.
Strategies to Contextualize Your Impact
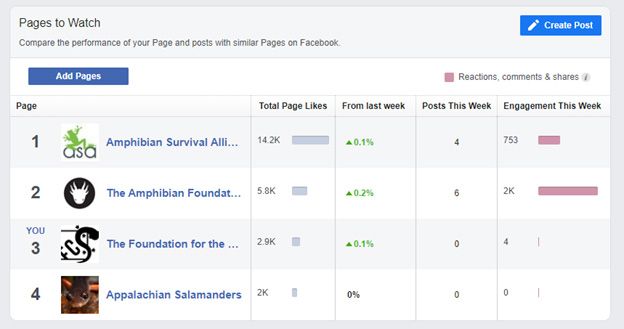
- Follow others doing similar things and compare your numbers (Figure 3). For example, find a colleague whose account you follow. Ask if they would share their metrics as well as their social media strategy to ensure you are not comparing with someone who has more time or resources to devote than you do. Facebook allows you to add similar accounts to your metrics pages.
- Read research on social media impact, such as Bex et al. (2019). How does your impact compare?
- Compare with others within your organization. Your communications team may be able to assist with this or even do it for you.

Case Study
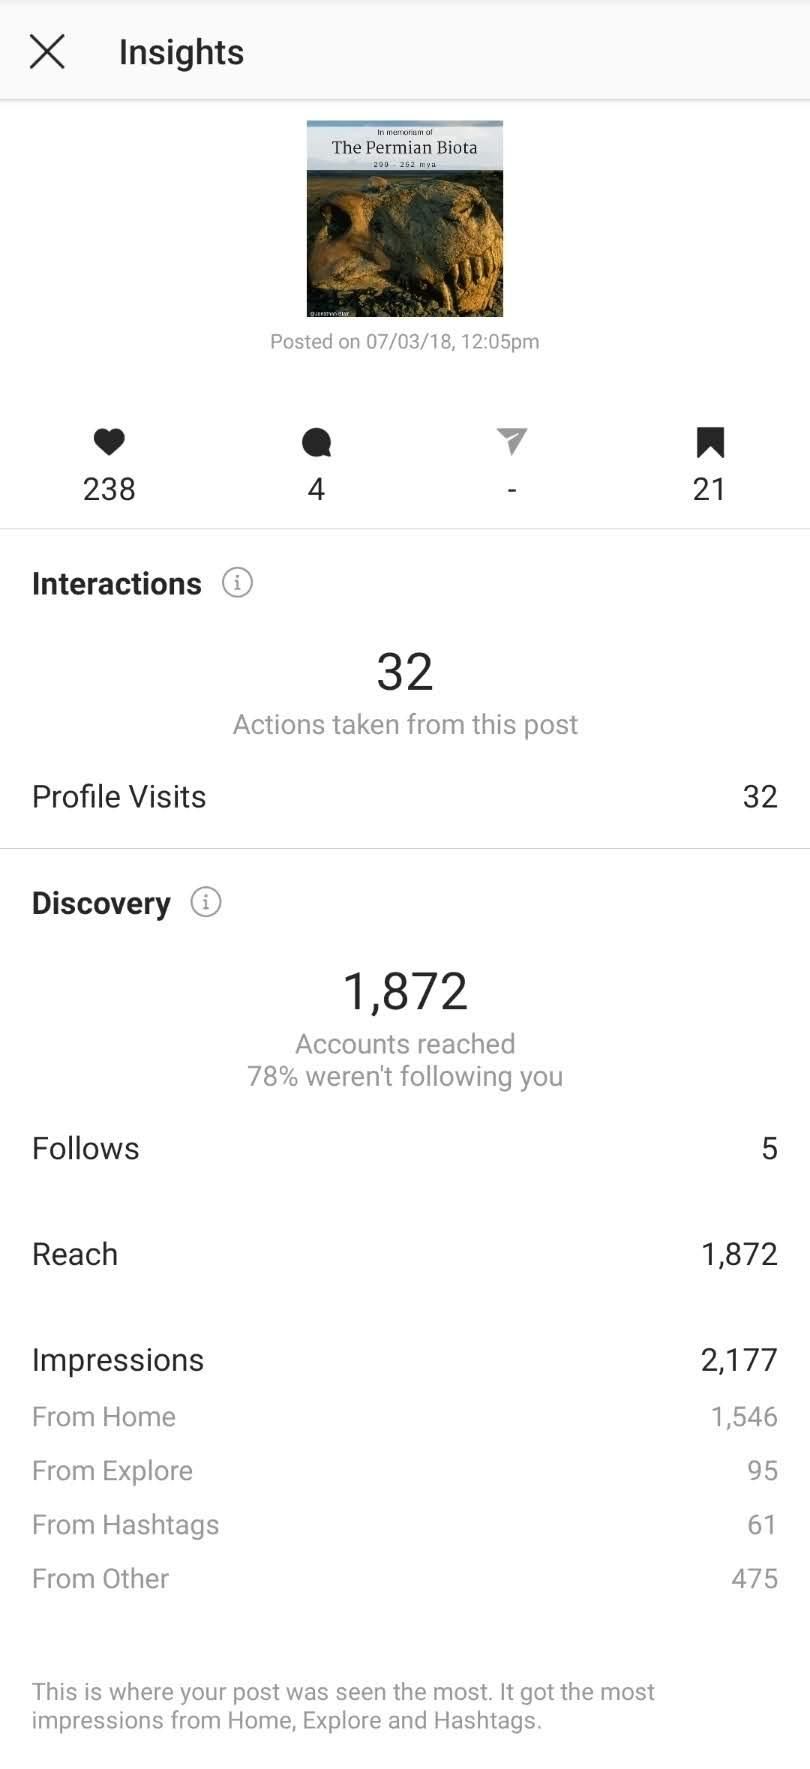
MyFOSSIL, an online paleontological community, connects professional paleontologists, students, amateur/avocational paleontologists, educators, and more. The community primarily uses social media as its mode of communication. The facilitators of myFOSSIL chose to use Instagram as a platform due to its focus on visual content and storytelling. Because Instagram is understudied as a social media platform in geosciences, the myFOSSIL team wanted to determine what types of posts received the most engagement and retention on their Instagram stories, which are short, timed posts that are only accessible for 24 hours. By looking at their metrics (Figure 4), the team found that polls had the most engagement from their audience in Instagram stories, while audiences engaged most with activity updates and general information posts on their regular feed (Hughes et al., 2019; Ocon et al., 2019). Short stories had the highest retention of viewers, meaning that it has the highest percentage of views on the last slide as compared to the first slide. The team used this information to create content that resonated with their community and to build tools to analyze engagement.

Summary
Evaluation for social media is as critical as it is in measuring output and impact in other areas. Numbers can help in job-related promotion materials and grant reporting. Ongoing analysis of your metrics can help you revisit your overall strategy to maximize your impact and use of resources to do your best work for your community.
References
Baym, N. K. (2013) Data not seen: The uses and shortcomings of social media metrics. First Monday, 18(10). https://doi.org/10.5210/fm.v18i10.4873.
Bex, R. T., Lundgren, L., & Crippen, K. J. (2019). Scientific Twitter: The flow of paleontological communication across a topic network. PLOS ONE, 14(7), e0219688. https://doi.org/10.1371/journal.pone.0219688.
Hamlyn, B., Shanahan, M., Lewis, H., O’Donoghue, E., Hanson, T., & Burchell, K. (2015). Factors affecting public engagement by researchers. A study on behalf of a Consortium of UK public research funders. (p. 69). TNS-BMRB.
Hughes, M. J., Ocon, S. B., Mills, S. M., Bauer, J. E., Crippen, K. J., Lundgren L., M., Bex, R. T., and MacFadden, B. J. (2019, March). Engaging in social paleontology: a case study of Instagram. Poster presented at the meeting of the Geological Society of America Southeastern Section, Charleston, South Carolina. Abstract retrieved from https://doi.org/10.1130/abs/2019SE-327118.
Ocon, S. B., Hughes, M. J., Mills, S. M., Bauer, J. E., Lundgren, L., Bex, R. T., Crippen, K. J., MacFadden, B. J. (2019, September). Best practices for Instagram as a geoscience education tool. Paper presented at the meeting of the Geological Society of America, Phoenix, Arizona. Abstract retrieved from https://doi.org/10.1130/abs/2019AM-334654.
Peters, K., Chen, Y., Kaplan, A. M., Ognibeni, B., & Pauwels, K. (2013). Social media metrics—A framework and guidelines for managing social media. Journal of Interactive Marketing, 27(4), 281–298. https://doi.org/10.1016/j.intmar.2013.09.007.