Summary
Living shorelines are structures made of natural materials such as oyster shells, sand, mangroves, salt marsh plants, and other organic substrate built to protect properties from erosion. In addition to increasing shoreline stability, living shorelines enhance many valuable ecosystem functions. In this publication, we provide homeowners, land managers, and Extension agents with materials lists, protocols, and datasheets for measuring change in ecosystem function. Measuring and interpreting these measurements will help evaluate living shorelines projects as well as provide the foundation for monetizing the value of these structures.
What is a living shoreline?
Living shorelines are an alternative to sea walls and bulkheads, employing natural materials such as oyster shells, sand, mangroves, salt marsh plants, and other organic materials. Sometimes called "nature-based infrastructure," living shorelines protect coastal properties from erosion by reducing wave energy and trapping sediments. Living shoreline configurations vary and can include some or all of these structures and plant communities.
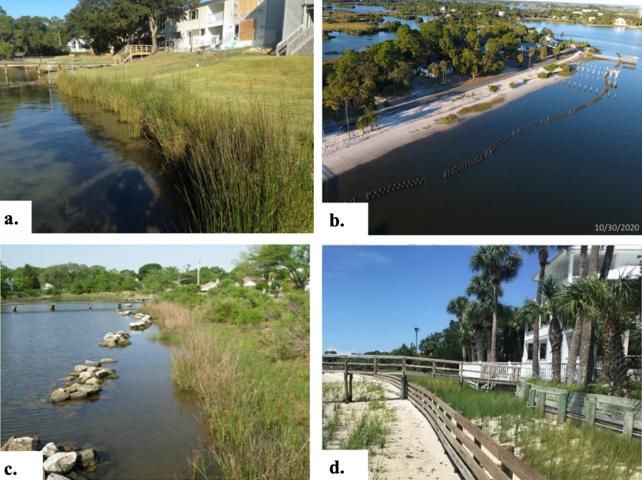
Credit: a. Eric Sparks, Mississippi State University. b. Mark Clark, UF/IFAS. c. NOAA. d. Savanna Barry, UF/IFAS.
Benefits of a Living Shoreline
The primary goal of living shorelines is to prevent coastal erosion—land loss due to wave activity and rising waters—and studies show that they do this well (Currin et al. 2017; Polk and Eulie 2018). In addition to increasing shoreline stability and reducing erosion, living shorelines enhance many valuable ecosystem functions while also protecting coastal habitat. These functions or processes are considered ecosystem services when they directly benefit humans.
Plants and oyster reefs act as habitat for marine species. Living shorelines should attract small fish, invertebrates (e.g., crabs and snails), reptiles, and shorebirds. The fish and wildlife that are attracted to living shorelines will increase the value of the shoreline and surrounding area for recreational activities like fishing and birding.
Plants and oyster reefs slow water velocity and absorb wave energy. While they are not likely to reduce flooding, slower-moving water can reduce erosion and increase shoreline stability. That reduction in wave energy results in changes to sediment texture and organic matter. In faster-moving water, sediment is resuspended from the bottom into the water, and smaller, finer grains of sediment may be washed away or may cloud the water. In areas with slower-moving water and less energy, sediments settle on the bottom, keeping the water clearer. This results in sediment buildup or accretion. Because these habitats are often underwater, they typically lack oxygen, which slows decomposition of organic matter. Thus, sediment trapping and organic matter accumulation by living shorelines is an effective mechanism for long-term carbon burial. Changes in sediment texture and organic matter suggest the living shoreline has modified wave energy, resulting in a decrease in coastal erosion.
Plants take up nutrients (i.e., carbon, nitrogen, and phosphorous) as they grow. The incorporation of nutrients into plant cells and tissues reduces the nutrient concentrations in coastal waters. Additionally, the modification of the sediment described above promotes nutrient accumulation and burial. Living shorelines can also be "hot spots" for nutrient removal through a process called denitrification—where microbes convert usable nitrogen into a harmless inert gas, permanently removing it from the system. Measuring the process of denitrification is complex and beyond the scope of this publication; however, organic matter concentration is positively correlated with denitrification and can serve as an indication that your living shoreline may be contributing to this ecological process. Other nutrient manipulations occur in these sediments but are not documented here.
Each of these changes, referred to as ecosystem functions, benefits humans. Fish and invertebrates living in these regions are often commercially harvested. Carbon burial decreases carbon in the water column. Excess carbon in the water reduces pH, making water more acidic, which can harm shellfish. Reduction in water column nutrients reduces issues with eutrophication, dead zones, and algal blooms.
Publication Goals
The goal of this EDIS publication is to provide homeowners, land managers, and Extension agents methods to measure these ecosystem functions. This publication can also be used by community science groups engaged in constructing and monitoring living shorelines.
Living shorelines are complex, and measurements of functions can be detailed and elaborate. All of these functions are valuable and worthy of monitoring; however, users can measure all of these processes/ecosystem functions or just a subset given the requirements of their permits, interest, and resources.
Measuring these functions will help evaluate living shorelines projects as well as provide the foundation for monetizing the value of these structures. In the following sections, we will describe the materials needed, the methods, and some analyses.
How do I measure the success of my living shoreline?
Typically, with a living shoreline, your goal is to build a zone of your property that will produce these ecosystem functions. Defining your success involves measuring these ecosystem functions to document positive change.
There are two steps in the process of quantifying the success of a living shoreline. The first and easiest part is the measurement of the ecosystem processes and functions. Those measurements vary with each process and are described below. In the second step, you must interpret the change caused by the living shoreline. That interpretation can happen in several different ways:
- You can compare your measurements to average values from a natural shoreline or average values from a hardened shoreline. Differences represent changes due to the living shoreline installation. Because these functions can vary in time (for example, you catch different fish in the spring versus the fall) and in space (for example, you catch different fish in north Florida than you do in south Florida), this comparison is somewhat coarse.
- You can measure both your living shoreline and an adjacent natural shoreline or adjacent hardened shoreline at the same time. We would call these other sites the reference sites. This comparison to a reference site is more accurate, although finding an appropriate reference site is not always easy. To locate a comparable reference site, we suggest visiting floridalivingshorelines.com and contacting local experts (Extension office, environmental groups, government agencies [DEP, especially Aquatic Preserves staff], FWC [manages regional Estuarine Restoration Teams], or universities).
- If you measure your living shoreline before and after installation or as your living shoreline ages, you can directly measure changes caused by your living shoreline installation.
- In the best-case scenario, you can combine sampling across time with reference site sampling.
If your living shoreline is working well, the enhancement of functions will increase as the shoreline matures. Your goals will determine your success.
Importantly, each of the structures and habitats that potentially make up a living shoreline (e.g., oysters, salt marsh grasses, mangroves) enhance each of these functions but may do so in different magnitudes. Temporal comparisons or reference site comparisons depend less on the exact makeup of your living shoreline but certainly need to be considered when using literature values to interpret your data.
Below we describe how to measure these processes and provide example data sheets at the end. We offer methods to measure several functions, and in some cases, we describe multiple ways to measure a function. Users of this document can select a set of measurements that work for them. Your permits may legally require the measurements of some functions. Some may simply be interesting to track over time, and some may be beyond your interest or resources.
Shoreline Building
Materials
PVC
Meter tape (can be purchased at the hardware store)
Methods
One of the main goals of a living shoreline is to prevent erosion and build land. To measure shoreline building (also called accretion), we suggest establishing long-term transects. To do this, insert a PVC pole into the sediment in the upper marsh, in the water, and at the water's edge. You want these to persist over time, so they need to go pretty far into the sediment—as far as you can go! We suggest taking a GPS location to help find the poles later.
Regularly (at least a few times a year), you should stretch the tape from the deepest pole over the pole at the shallow edge and to the point on the shoreline where the plants (either marsh plants or mangroves) start ("Marsh Edge Distance" in Figure 2). The distance you are measuring is from the deep pole to the marsh edge. The landward pole is to maintain your orientation and thus keep your distances comparable. Over time, as your plants expand, this distance will get greater. You can repeat this in the opposite direction as well. The distance you are measuring is from the shallow pole to the oyster reef edge. The deeper water pole is to maintain your orientation and thus keep your distances comparable ("Oyster Edge Distance" in Figure 2). Over time, as your living shoreline traps sediment, these distances will get greater. An additional way you can build land is to increase your lower marsh. You can measure the distance from your most landward pole over the shallow pole to the edge of the lower marsh ("Lower Marsh Expansion Distance" in Figure 2). This distance should also increase over time.
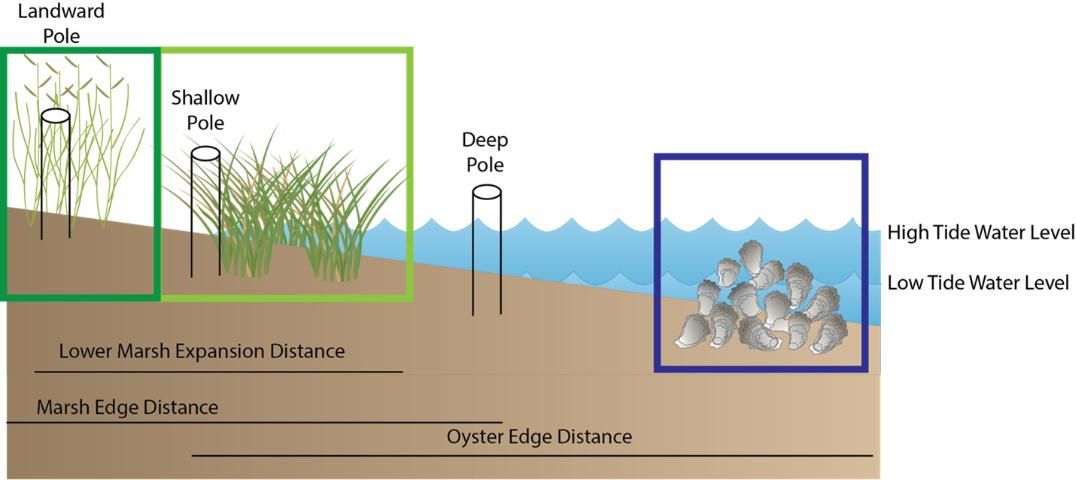
Credit: Figure created by the authors using symbols created by Integration and Application Network, University of Maryland Center for Environmental Science (ian.umces.edu/symbols/). Licensed under Attribution-ShareAlike 4.0 International (CC BY-SA 4.0).
Because you may lose your permanent poles, we suggest establishing at least three transects along your shoreline to make sure you can collect data over time. The distances that you measure can be compared to the distances you measured previously. Because these distances are dependent on where you place your permanent poles, it is not simple to compare your data to others.
Survival and Density
For a living shoreline to be successful, you need to have living material. We expect that over time, living material will accumulate and become denser. We also expect that living material will trap and hold more nutrients.
Materials
Quadrat: A quadrat (Figure 3) is a portable frame of known area. You can make this using PVC pipes and corners. You can also use something like a ring or a hula hoop. The important thing is that you know the area inside that frame.
Scale: Can be purchased at a kitchen or hardware store inexpensively.
Datasheet: Provided in the appendix.
Ruler or meterstick
Plastic bags
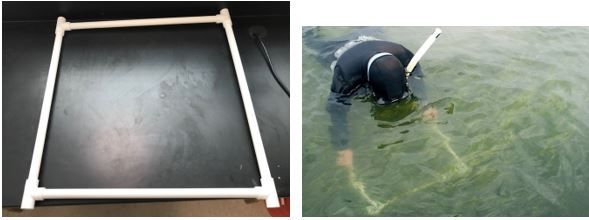
Credit: Courtesy of the authors
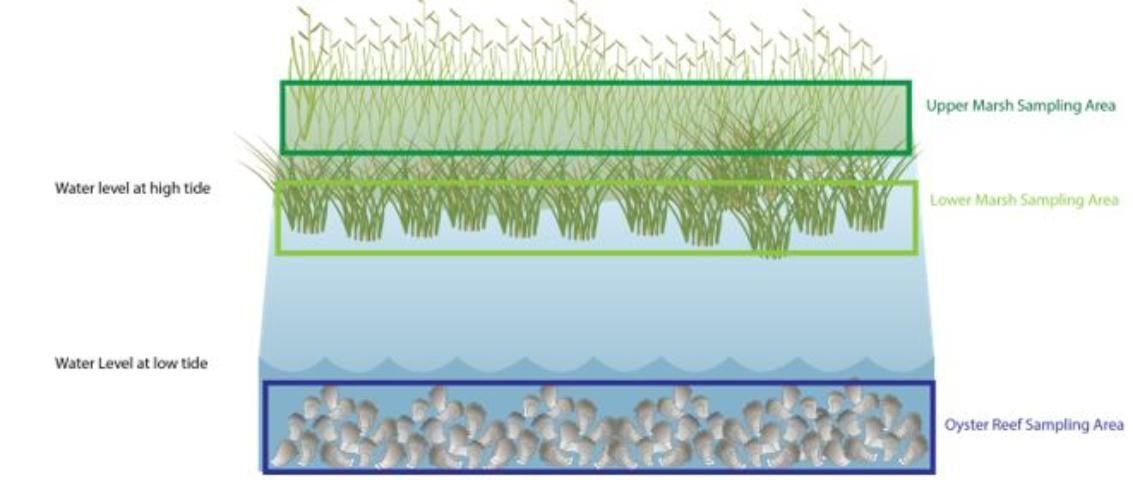
Credit: Created by the authors using symbols created by Integration and Application Network, University of Maryland Center for Environmental Science (ian.umces.edu/symbols/)
Methods
The number of samples needed will depend on the size and layout of your living shoreline. We suggest at least 10 samples in each of your regions—oyster reef, lower marsh, upper marsh, and/or mangrove (Figure 4). Sample locations within a region should be randomly selected. You can do this by haphazardly throwing your quadrat. One quadrat equals one sample, so you should randomly place it 10 times.
Place the quadrat on the bottom, identify the species (plants and/or oysters) present, and count and record the number of individuals of that species in the quadrat. Because the size of your quadrat may differ from others, once you get back to the field, divide your counts by the area of your quadrat (in m2). Your quadrat may be an estimated region for mangroves, because your area will need to be larger to include trees. This will ensure your data can be compared to others. Another useful way to interpret the data is to estimate the size of your habitat (you can use a meter tape or you can walk the perimeter and count your steps) and multiply your counts per m2 by the total area to get an estimate of the total number of individuals at your site. Finally, taking photos of the quadrat in the same location over time is a useful way to track your living shoreline.
Living material can also take up nutrients and hold on to them in their tissues—leaves, stems, and roots. It is more technical to measure nutrients. Below, however, we provide collection protocols and information on laboratories that can help you:
Collect at least 10 whole plants from the base. Dry the whole plant in an oven (less than 60°C or 140°F) and weigh using a kitchen scale. Plants then can be sent to a UF/IFAS Analytical Services Laboratory that can run these samples for you (sometimes for a fee). Samples can be submitted through your local UF/IFAS Extension office.
Interpreting this nutrient data takes a little bit of math. Total nutrients stored by plants can depend on density. Results will be returned to you as the weight of nutrient, either carbon (C), nitrogen (N), or phosphorus (P) per weight of the sample. You can interpret these results by multiplying the value by weight of the plant to get total nutrients per plant and then multiplying that number by plants per area (calculated above) to get nutrients per area (i.e., g N m-2), which will be comparable to other studies. Living shorelines reduce nutrient runoff into the water by holding onto nutrients. We expect that as a living shoreline ages, the total nutrients (per area) stored in the plants will increase.
In the lower marsh dominated by Spartina alterniflora, stem density can vary dramatically. Throughout the southeastern United States, stem density can range from 18–219 m-2 and stem height can range from 50–82 cm (Currin et al. 2008; Gittman and Keller 2013; Reitl et al. 2018). At least in North Carolina, restored marshes tended to have a slightly lower shoot density (61–154 m-2 vs. 131–219 m-2) with slightly smaller stems (50–61 cm vs. 64–78 cm) (Currin et al. 2008). Plant N can range from 0.7% to 1.64% and C ranged from 43.9% to 44.9% (Reitl et al. 2018). Comparing your results to a nearby natural marsh can reduce these expected ranges, and observing changes over time is also a useful way to evaluate your project.
Oyster densities may decrease with project age because older oysters are larger and take up more space. In the Southeast, total number of oysters can range from 50 to 95,000. Adult oyster densities range from 50 to 1000 (Onorevole et al. 2018).
Habitat
Quadrat Sampling (Salt Marshes Only)
This section applies only to salt marshes. If your living shoreline does not include salt marsh grasses, then this section will not be applicable.
Materials
Quadrat: Instructions to build one are in the survival section (Figure 3).
Datasheet: Provided in the appendix.
Methods
There are two iconic invertebrates that inhabit salt marshes: periwinkle snails and fiddler crabs (Figure 5). Periwinkle snails live on the smooth cordgrass, Spartina alterniflora. During low tide, you will find them lower on the plant, and during high tide, they will be near the top of the leaves. They create small wounds in the leaves, which promote the growth of fungi that act as a food source for the snail. This means they are rarely found without cordgrass, and because they are sensitive to chemicals and pesticides, they are also absent from degraded marshes. Male fiddler crabs are characterized by their single large claw and create burrows in the marsh where they can take shelter from predators, extreme temperatures, or high tides. Crab burrows are often surrounded by small balls of sand that can be created by the crabs as they dig burrows or as by-product—pseudofeces—of feeding on algae covering the sand. These burrows are important to salt marsh ecology because they change the water and gas flow through the sediments, often promoting plant growth (Angelini et al. 2010).
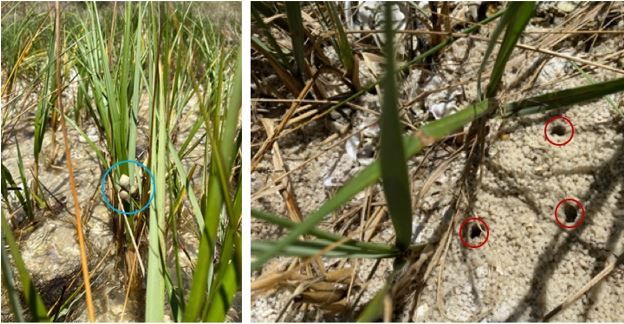
Credit: Savanna Barry, UF/IFAS
Healthy marsh systems that are enhancing ecosystem processes will have both periwinkle snails and fiddler crabs, and densities of these organisms are abundant in the literature for comparison purposes. You can estimate the number of these organisms using the quadrat method described in the survival section. We suggest at least 10 samples in the low marsh regions (Figure 4). Sample locations should be selected randomly by haphazardly throwing your quadrat.
Place the quadrat on the bottom and count the number of snails and the number of crab burrows. Because the size of your quadrat may differ from others, once you get back from the field, divide your counts by the area of your quadrat (in m2). You can also scale these values up by multiplying your density per m2 by your estimate of low marsh size, as described above. We suggest, as above, sampling at least 10 times.
In the Gulf of Mexico, natural marshes can have fiddler crab burrow densities from 13–105 m-2 and periwinkle densities ranging from 1–450 m-2 (Reitl et al. 2018; Zengel et al. 2016).
Measuring Fish and Mobile Organism Abundance by Trapping
Materials
PVC poles
Zip ties
Minnow traps
Datasheet: Provided in the appendix.
Methods
Baited minnow traps can be used to assess your living shoreline as habitat for small fish and invertebrates. Minnow traps are mesh cylinders with funnels at the end (Figure 6). Small fish and invertebrates can enter through the funnel but cannot escape unless they are smaller than the mesh size. Therefore, minnow traps are good at collecting organisms of a specific size. Traps can be baited using various materials, including cut-up fish, squid, or even dry dog food. Whatever bait you choose, make sure to be consistent and use the same bait throughout your monitoring. Traps can be clipped to PVC poles driven into the sediment, left in the field for a specified time, and then retrieved and opened so that organisms can be counted, identified, and measured.
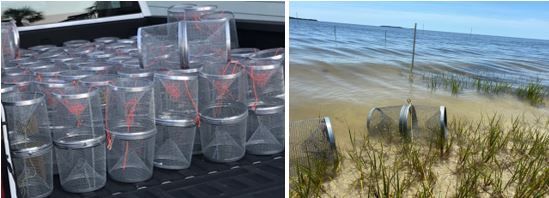
Credit: Savanna Barry, UF/IFAS
We suggest at least 10 samples in each of your regions—oyster reef, lower marsh, upper marsh—and a soak time (how long the traps are left in the water) spanning a single high tide cycle (~3 hours). However, incubation time may need to be reduced if it includes a significant low tide that would leave traps exposed to air and kill organisms. It is important to note whether your sampling occurs on a rising or falling tide because that may impact your catch. Fish communities may differ seasonally, so it is a good idea to repeat this sampling at different times of the year.
Please note local fishing laws. You may need a fishing permit to conduct this sampling. Minnow traps are excellent methods for comparing your living shoreline to a reference site or for looking at changes over time. However, catch is very dependent on trap size and incubation time; therefore, it is important to carefully select published studies for comparisons. We do not provide global means because of this issue.
Measuring Fish and Mobile Organism Abundance by Seining
Materials
PVC poles
Seine net
Datasheet: Provided in the appendix.
Methods
Seining is a method for assessing fish and invertebrates that doesn't require a long incubation time and captures a broader size range of individuals. There are many types of seine nets. For living shorelines, we suggest a smaller seine net without an attached bag, because the attached bag may get caught on the 3D structures in a living shoreline.
It is important to keep efforts consistent. We suggest measuring a specific distance (no more than 100 m) and marking each end with a piece of PVC. Avoid walking through the sampling region prior to sampling. A person stands on each side of the net and holds it above water while walking to one of the poles. Once at the pole, the samplers stretch the net and place the weighted edge on the bottom. They then drag the net along the bottom while walking to the second pole with a quick, even pace. At the second pole, samplers should walk towards each other to close the net and pull it above the water or onto the shore. Then, they can remove organisms and identify and measure them. It is a good idea to have a bucket of water with aeration to keep the organisms alive until you have finished counting and can return them to the water (see Figure 7).
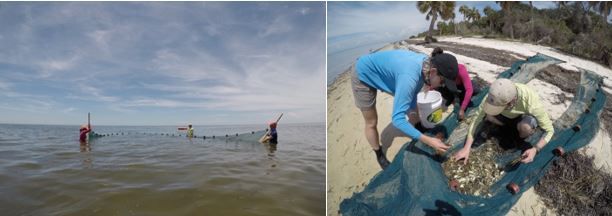
Credit: Photos taken by the authors
Once again, these are excellent methods for comparing your living shoreline to a reference site or for looking at changes over time. However, catch is very dependent on seine size and length of seine pull; therefore, it is important to carefully select studies for comparisons. We do not provide global means because of this issue. If you find that you are capturing too many animals to process and release alive, consider modifying your sampling so you sample a smaller area, or use a smaller net.
Measuring Fish and Mobile Organism Abundance by Recreational Fishing
Materials
Fishing license
Fishing gear of your choice—rod and reel or cast nets
Methods
Recreational fishing is a fun and straightforward way to sample the fish community using your living shoreline. Because catches will vary with tide, season, and potentially a little luck, this is mostly a qualitative rather than quantitative assessment. However, using mobile applications such as FishBrain or iNaturalist to keep track of your catches can be fun and informative.
Coring
Materials
PVC pipe and matching cap
Sieve
Datasheet: Provided in the appendix.
Methods
Coring samples a select group of organisms using living shorelines—those living in the sediment or the benthos, often referred to as infauna. Cores can be constructed from PVC. We suggest 7.6 cm diameter PVC (3? in the hardware store) cut to a length of about 18 inches. It will be useful to mark a line 15 cm from the bottom using a permanent marker or piece of tape.
We recommend sampling at 6–10 locations in each of your regions—oyster reef, lower marsh, upper marsh. The number of samples may depend on the size of your regions within your living shoreline. At each sampling location, insert the PVC into the sediment until it reaches the 15 cm line. Place the cap (PVC endcap) on the top of the core, which will hold the sample in the tube via suction. Pull the core from the sediment, hold it above the mesh sieve, and remove the cap to release the suction. Keep the core vertical the entire time. Rinse the sediment through the sieve (using a bucket of water or just shaking the sieve while the bottom is submerged in water), remove organisms, and identify and measure them. You can make a homemade sieve using materials like window screen mesh supported underneath by chicken wire. You can enclose the mesh and chicken wire using a wooden frame and attach pool noodles or other buoyant materials to the sides for floatation (Figure 8). Alternatively, you can purchase prefabricated sieves from online suppliers. Like fish, invertebrate communities can vary seasonally, so it is a good idea to repeat this sampling in different seasons.
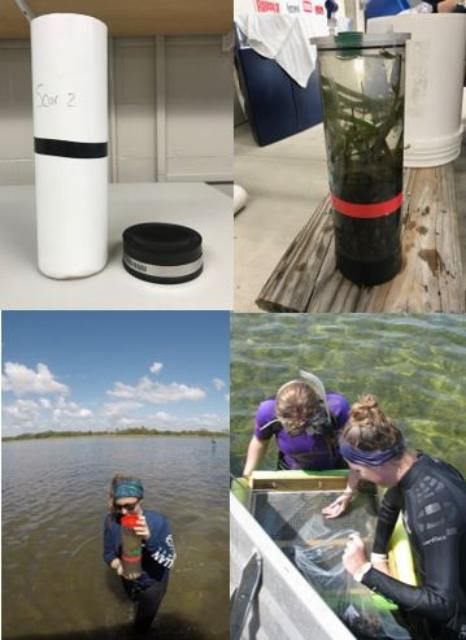
Credit: Photos taken by the authors
To compare your values to literature values, you must convert the counts to density as individuals per m2. Calculate the area of the core (pr2). For a 3? diameter core (1.5? or 3.8 cm or 0.038 m radius), the area would be 0.0045 m2. Values may vary significantly over space and season, so we suggest directly comparing your living shoreline to a reference site sampled in the same way or for looking at changes over time. When comparing your results to others, keep in mind that depth of coring may also impact your catch.
These are excellent methods for comparing your living shoreline to a reference site or looking at changes over time. However, catch is very dependent on tidal cycle and depth of core; therefore, it is important to carefully select studies for comparisons. We do not provide global means because of this issue.
Sweep Netting
Materials
PVC poles
Sweep net
Datasheet: Provided in the appendix.
Methods
Sweep netting is a good method to measure the insect community, so it is only appropriate to use this technique in the marsh portion of your living shoreline. A sweep net is a fine-mesh, funnel-shaped net on a long pole. As with seining, it is important to keep efforts consistent. We suggest measuring a distance of 100 m shore parallel and marking each end with a piece of PVC. Avoid walking through the sampling region prior to sampling. Stand at one pole and sweep the net 180° in front of you. Take a step forward and sweep again. At the end of the last sweep, swing the net through the air, well above the plants, to force insects to the bottom, and then hold the net closed. At that point, insects can be removed, identified, and counted (Figure 9).
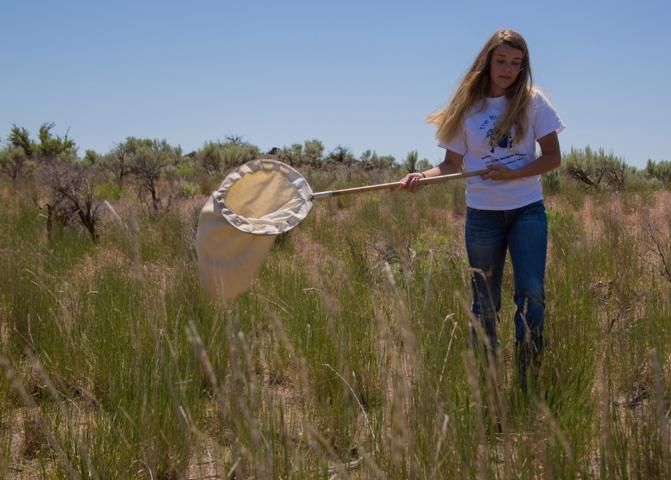
Credit: Intermountain Forrest Service
This is another method where catch is very dependent on gear and effort, making the comparison to literature values difficult. However, these are excellent methods for comparing your living shoreline to a reference site or for looking at changes over time.
Birdwatching
Materials
Binoculars
Datasheet: Provided in the appendix.
Methods
Birdwatching is straightforward. You can simply observe the birds using your living shoreline for a set amount of time, usually 15 to 30 minutes. We recommend repeating observations over several days and covering multiple seasons. We also recommend conducting your survey at similar stages of the tide—typically low tide is best—and noting other information such as the time of observations, weather, wind, etc. These factors can influence bird activity and can help you interpret results. When possible, try to make observations at a similar time of day and on days that have similar conditions (e.g., clear days with morning low tides) to reduce the influence of confounding factors. When comparing change over time or comparing data to published literature, keep in mind that bird communities change seasonally, and only make appropriate comparisons.
You can use mobile applications such as eBird or iNaturalist to keep track of your observations, or you can simply note your observations in a field notebook. Coupling your sampling with large-scale efforts to monitor birds, such as the Audubon Christmas bird count or the Florida June Challenge, is a fun way to interact with other naturalists as well.
Sometimes differences in bird communities and abundances can be subtle. Users particularly interested in birds may also choose to note when wading birds are feeding, because some studies have shown that bird behavior differs more than abundance (Shaffer et al. 2019).
Sediment
Over time, we expect the living shoreline to accumulate sediment. Plants will slow water flow. The speed of water flow dictates the particle size that can be moved around—faster water moves larger sediment particles. As flow gets slower, more small-grain material will be trapped, and sediment will become finer. We also expect sediments to become more organic, have more nitrogen, and have more phosphorus. We expect that nutrient cycling (i.e., denitrification) will also change as nutrient availability is influenced by organic matter and grain size. Sediment texture can be measured in the field. Sediment nutrients are more technical; however, below we explain collection methods and provide resources for laboratories that may help you analyze your samples.
Texture
Materials
Shovel
Squirt bottle
Datasheet: Provided in the appendix.
Methods
We will qualitatively classify the sediment as Sand (large grains 0.05–1mm), Silt (smaller grains 0.002–0.05mm), or Clay (smallest grains <0.002mm). The term loam describes a mix. Over time, as a living shoreline is better established, we predict that sediment grain size will get smaller.
Gather a small amount of sediment in the palm of your hand. Add water a drop at a time and knead the soil until it feels like putty.
- Once saturated, roll the sediment around in your hand. If the soil will not adhere or form a ball, it is SAND (Figure 10).
- If the soil forms a ball, try to make a ribbon by pressing it upward with your thumb and forefinger. A ribbon should be uniform in width and thickness. Allow the ribbon to extend past your fingers until it breaks from its own weight. If it will not form a ribbon: LOAMY SAND.
- If the soil forms a ribbon but is less than 2.5 cm long when it breaks, is the texture (Figure 10):
- Very gritty, grinding noise audible: SANDY LOAM.
- Very smooth, no grinding audible: SILT LOAM.
- Slightly gritty, slightly smooth, grinding not clearly audible: LOAM.
4. If the soil exhibits moderate stickiness and firmness and forms a ribbon 2.5–5 cm long, is the texture:
- Very gritty, grinding noise audible: SANDY CLAY LOAM.
- Very smooth, no grinding audible: SILTY CLAY LOAM.
- Slightly gritty, slightly smooth, grinding not clearly audible: CLAY LOAM.
5. If the soil exhibits dominant stickiness and firmness and forms a ribbon longer than 5 cm, is the texture (Figure 9):
- Very gritty, grinding noise audible: SANDY CLAY.
- Very smooth, no grinding audible: CLAY.
- Slightly gritty, slightly smooth, grinding not clearly audible: SILTY CLAY.
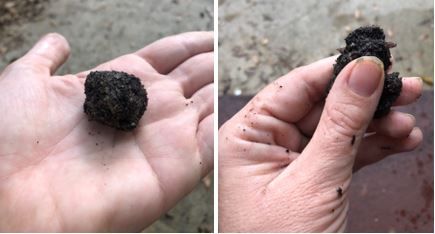
Credit: Photos taken by the authors
Sediment Nutrients
Materials
Small coring device: either 2.5 cm diameter PVC (1? in the hardware store) and end cap cut to 20 cm or a 60 cc syringe with the tip cut off
Plastic storage bags
Methods
Methods for analyzing organic matter, carbon, nitrogen, and phosphorous are technical and require expensive equipment. However, UF/IFAS Analytical Services Laboratory can run these samples for you (sometimes for a fee). Samples can be submitted through any UF/IFAS Extension office.
We recommend sampling in at least 6 sites in each of your regions—oyster reef, lower marsh, upper marsh. If you are using a PVC core, push it into the sediment about 5 cm. Place a cap on the open end to create a suction, and then remove the core. Place the bottom of the core into a ziplock bag, remove the cap, and the sediment plug should fall into the bag. If you are using a syringe, start with the plunger down. Pull the plunger up as you insert the tube into the sediment and pull the whole apparatus out of the sediment. Use the plunger to push the sediment sample into a ziplock bag. This sample can be analyzed for sediment organic matter, as well as grams of carbon, nitrogen, or phosphorous.
Your organic matter results will be returned as % organic matter and can be directly compared to literature values. Your nutrient values will be returned as g (P or N) per kg sediment. Take care to make sure literature values are in similar units.
Like many parameters, marsh and oyster reef sediment can vary a lot with organic matter values ranging from <1% to >20% (Currin et al. 2008; Morse et al. 2004; Onorevole et al. 2018), but we expect values to increase as your project ages. Throughout the southeastern United States, values for marsh nitrogen range from 4–270 g kg-1, and values for marsh total phosphorus range from 0.4 to 0.7 g kg-1. Carbon values range from 68 to 4000 g kg-1. Nutrient ranges for oyster reef sediments are similar and often correlated with organic matter (Onorevole et al. 2018). Living shorelines reduce nutrient runoff into the water by holding onto nutrients. We expect as the living shoreline ages, the total nutrients (per area) stored in the sediment will increase until a point. Sediments store carbon, particularly in the organic form in the same way. All values should increase over time as your project ages (Dulane et al. 1981; Currin et al. 2008; Morse et al. 2008; Loomis & Craft 2010; Onorevole et al. 2018).
Conclusions
Living shorelines are an investment both in dollars and in time, with the reward being a more stable shoreline and enhancement of ecosystem functions. Measuring these functions may be required as part of your permit for installation, but it is also a fun way to explore the natural world, to see your living shoreline work, and to see the benefits of your investment.
Contact
xLaura K. Reynolds
UF/IFAS Department of Soil and Water Sciences
lkreynolds@ufl.edu
(352) 294-3165
Glossary
Accretion—Gradual accumulation.
Benthos—The community of organisms that live on, in, or near the substrate (bottom), also known as the benthic zone.
Denitrification—The microbial mediated process where bioavailable nitrate is converted to inert nitrogen gas.
Erosion—A geological process by which earth is worn away.
Eutrophication—The enrichment of a water body with nutrients, usually to excess. This process induces the growth of plants and algae and, due to the biomass load, may result in oxygen depletion of the water body. It is also termed hypertrophication.
Habitat—The natural home or environment of an organism.
Infauna—Sediment-dwelling organisms. Creatures and microorganisms that live mainly inside sediment, the layer of small particles at the bottom of a body of water.
Nutrients—Chemicals needed for an organism's survival (e.g., carbon, nitrogen, phosphorous).
Organic matter—Carbon-based compounds found in natural environment produced from the remains of living organisms.
Pseudofeces—Suspended particles, such as grit, that cannot be used as food and that have been rejected by the animal.
Resuspended—Put back into a suspended state (held in a fluid).
Sediment texture—Refers to the shape, size, and three-dimensional arrangement of the particles that make up sediment.
Transect—Line across a habitat or part of a habitat. It can be as simple as a string or rope placed in a line on the ground.
References
Angelini, C., M. Bertness, N. Herrmann, and K. Gedan. 2010. "Fiddler Crab Control of Cordgrass Primary Production in Sandy Sediments." Marine Ecology Progress Series 399:253–259.
Currin, C. A., J. Davis, and A. Malhotra. 2017. "Response of Salt Marshes to Wave Energy Provides Guidance for Successful Living Shoreline Implementation." In Living Shorelines: The Science and Management of Nature-Based Coastal Protection, edited by Donna Marie Bilkovic, Molly M. Mitchell, Megan K. La Peyre, and Jason D. Toft. 211–234. Boca Raton: CRC Press.
Currin, C. A., P. C. Delano, and L. M. Valdes-Weaver. 2008. "Utilization of a Citizen Monitoring Protocol to Assess the Structure and Function of Natural and Stabilized Fringing Salt Marshes in North Carolina." Wetlands Ecology and Management 16 (2): 97–118.
DeLaune, R. D., C. N. Reddy, and W. H. Patrick. 1981. "Accumulation of Plant Nutrients and Heavy Metals through Sedimentation Processes and Accretion in a Louisiana Salt Marsh." Estuaries 4 (4): 328–334.
Gittman, R. K., and D. A. Keller. 2013. "Fiddler Crabs Facilitate Spartina alterniflora Growth, Mitigating Periwinkle Overgrazing of Marsh Habitat." Ecology 94 (12): 2709–2718.
Loomis, M. J., and C. B. Craft. 2010. "Carbon Sequestration and Nutrient (Nitrogen, Phosphorus) Accumulation in River-Dominated Tidal Marshes, Georgia, USA." Soil Science Society of America Journal 74 (3): 1028–1036.
Morse, J. L., J. P. Megonigal, and M. R. Walbridge. 2004. "Sediment Nutrient Accumulation and Nutrient Availability in Two Tidal Freshwater Marshes along the Mattaponi River, Virginia, USA." Biogeochemistry 69 (2): 175–206.
Onorevole, K. M., S. P. Thompson, and M. F. Piehler. 2018. "Living Shorelines Enhance Nitrogen Removal Capacity over Time." Ecological Engineering 120:238–248.
Polk, M. A., and D. O. Eulie. 2018. "Effectiveness of Living Shorelines as an Erosion Control Method in North Carolina." Estuaries and Coasts 41 (8): 2212–2222.
Rietl, A. J., M. G. Sorrentino, B. J. Roberts. 2018. "Spatial Distribution and Morphological Responses to Predation in the Salt Marsh Periwinkle." Ecosphere 9 (6): e02316.
Shaffer, M., M. Donnelly, and L. Walters. 2019. "Does Intertidal Oyster Reef Restoration Affect Avian Community Structure and Behavior in a Shallow Estuarine System? A Post-restoration Analysis." Florida Field Naturalist 47 (2): 37–59.
Zengel, S., S. C. Pennings, B. Silliman, C. Montague, J. Weaver, D. R. Deis, et al. 2016. "Deepwater Horizon Oil Spill Impacts on Salt Marsh Fiddler Crabs (Uca spp.)." Estuaries and Coasts 39 (4): 1154–1163.