Introduction
Although extreme weather events occur periodically everywhere, the expected increase in their frequency and intensity due to climate change requires improved climate services to identify, measure, and monitor the occurrence of climate anomalies and extreme weather events with the potential to affect agricultural production.
This guide introduces users to a recently developed web-based tool on AgroClimate.org (Fraisse et al. 2006) that was designed to systematically monitor climate indicators and detect anomalies with the potential to affect the agricultural industry in Florida and elsewhere in the continental United States. The intended audience for this article includes Extension faculty, growers, certified crop advisors, and crop consultants.
Climate Indicators for Agriculture
Indicators are measurements or calculations that describe the status of a system of interest. The potential impacts of weather and climate anomalies on agriculture can be better understood when typical meteorological variables such as precipitation and temperature are also translated into agroclimatic indicators that can relate to potential impacts on crop development and yield (Walsh et al. 2020).
Climate indicators available in the web tool include physical, phenological, and stress indicators (Table 1). Physical indicators are meteorological variables such as precipitation and air temperature that can be measured directly by instrumentation. Phenological indicators are related to cyclical biological events. In the case of plants, events can include crop development stages such as emergence, flowering, and physiological maturity. The determination of phenological indicators requires detailed observation of a crop’s development as well as variables that may affect the development rate such as temperature and photoperiod. Stress indicators included in the tool are related to abiotic stress in plants and animals that can be caused by either insufficient or excessive rainfall, and high or low temperature.
Table 1. Climate indicators currently included in the tool are classified as physical, phenological, and stress indicators.
Climate data used for mapping indicators are provided by gridded data sources including the Parameter-elevation Relationships on Independent Slopes Model (PRISM) and the National Centers for Environmental Prediction (NCEP) Real-Time Mesoscale Analysis (RTMA). PRISM (Daly et al. 2008) provides daily maximum and minimum temperatures as well as precipitation data for the contiguous United States with daily temporal resolution at 4.0 km (≅2.5 miles) spatial resolution. The RTMA (DePondeca et al. 2011) was developed to support NOAA National Digital Forecast Database (NDFD) operations and to provide field forecasters with high-quality analyses for nowcasting, situational awareness, and forecast verification purposes. It provides hourly analyses at 2.5 km (≅1.5 miles) spatial resolution.
When a specific location is selected using the “Drop a pin” feature (Figure 1), climate data for the selected location are obtained from the NOAA Applied Climate Information System (ACIS), which is maintained by the Northeast Regional Climate Center (RCC) and operated by Cornell University. Although the Northeast RCC uses the same data sources as our map products described above, this feature is an innovative collaboration between the AgroClimate group and the Northeast RCC that greatly facilitates the exchange of data and ideas. It also facilitates the eventual development of other climate-based products derived from alternative data sources.
Keep in mind that gridded data sources are not as precise locally as data from weather stations because they represent an average value for the grid cell. Additionally, they are not available instantaneously at reading because it takes time to collect, process, and publish the data. Information provided by the tool represents conditions observed with a delay of 24 to 36 hours. For more precise and updated monitoring of site-specific weather conditions in Florida, the weather stations in the Florida Automated Weather Network (FAWN) should be used.
Guide for Using the Climate Indicators Tool
The climate indicators tool is available at AgroClimate.org and can be accessed via the main menu under “Tools” or directly at http://cloud.agroclimate.org/tools/climate-indicators-monitoring/. There are two main ways to visualize the information: via maps covering all 48 contiguous states in the continental United States, or via graphs after selecting a specific location using the “Drop a pin” feature (Figure 1). Once a location on the map is selected, a marker will appear showing the selected location.
Maps show average conditions of selected indicators over a period varying from the day before to a maximum of 150 days (Figure 1). Users must click on the left-side arrow to visualize the layers available for mapping. By default, a map showing the conditions observed over the last 30 days is selected. Mapped indicators include total precipitation; minimum, maximum, and average temperature; drought stress (ARID); heat stress in terms of heat degree days above four temperature thresholds (86°F, 90°F, 93°F, 97°F); growing degree days using three base temperature thresholds (40°F, 50°F, 60°F); and chill accumulation based on hours with temperatures between 32°F and 45°F. Maps can also show long-term averages (historical) and deviation, which is defined as the difference between observed conditions and the long-term averages (Figure 2). Users can select the map to display by clicking on “Map” on the top-left corner of the screen.
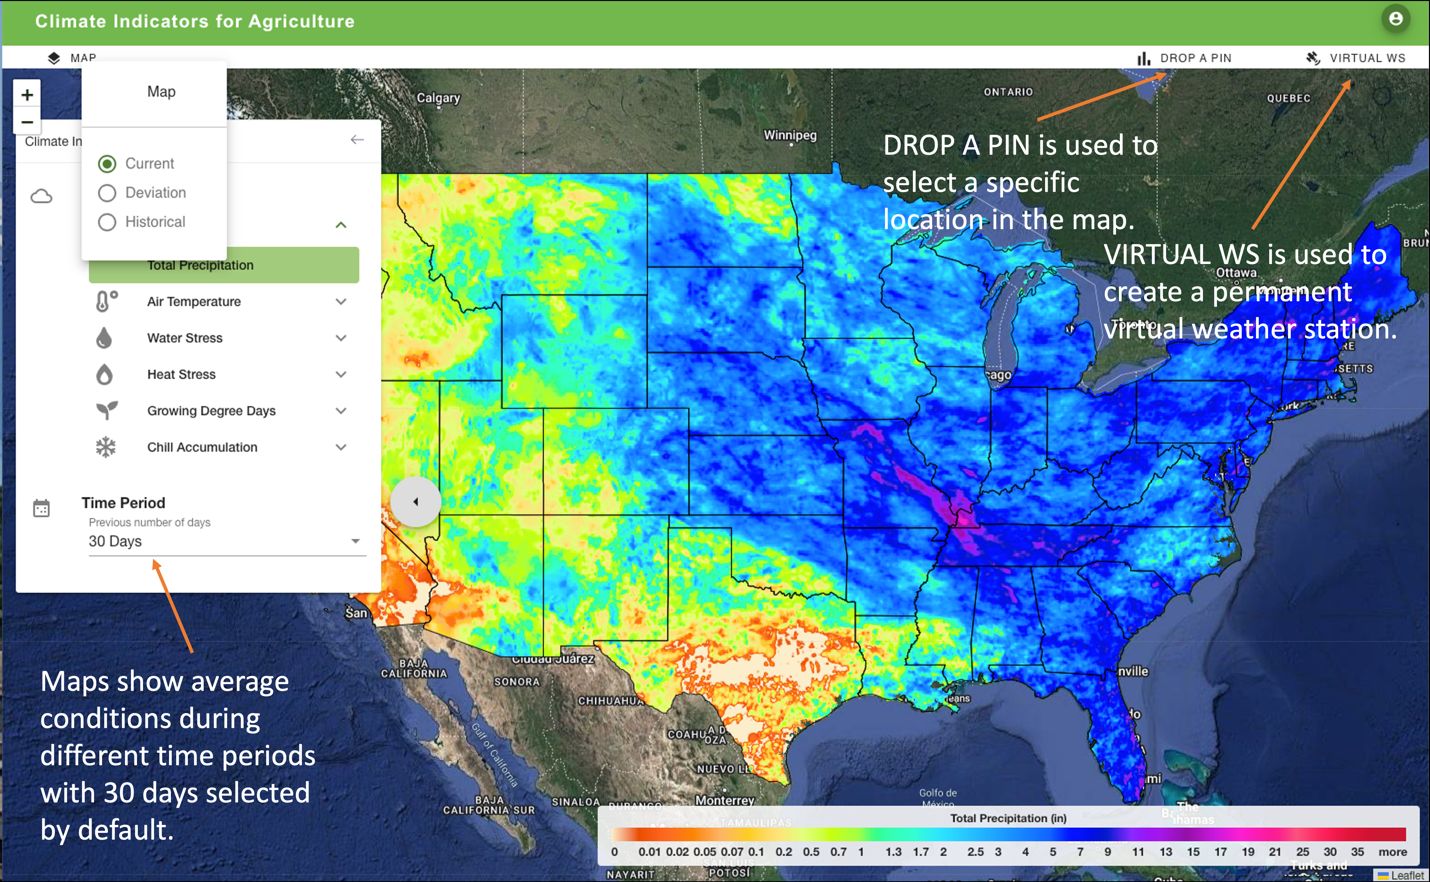
Credit: PRISM, Oregon State University. AgroClimate.org
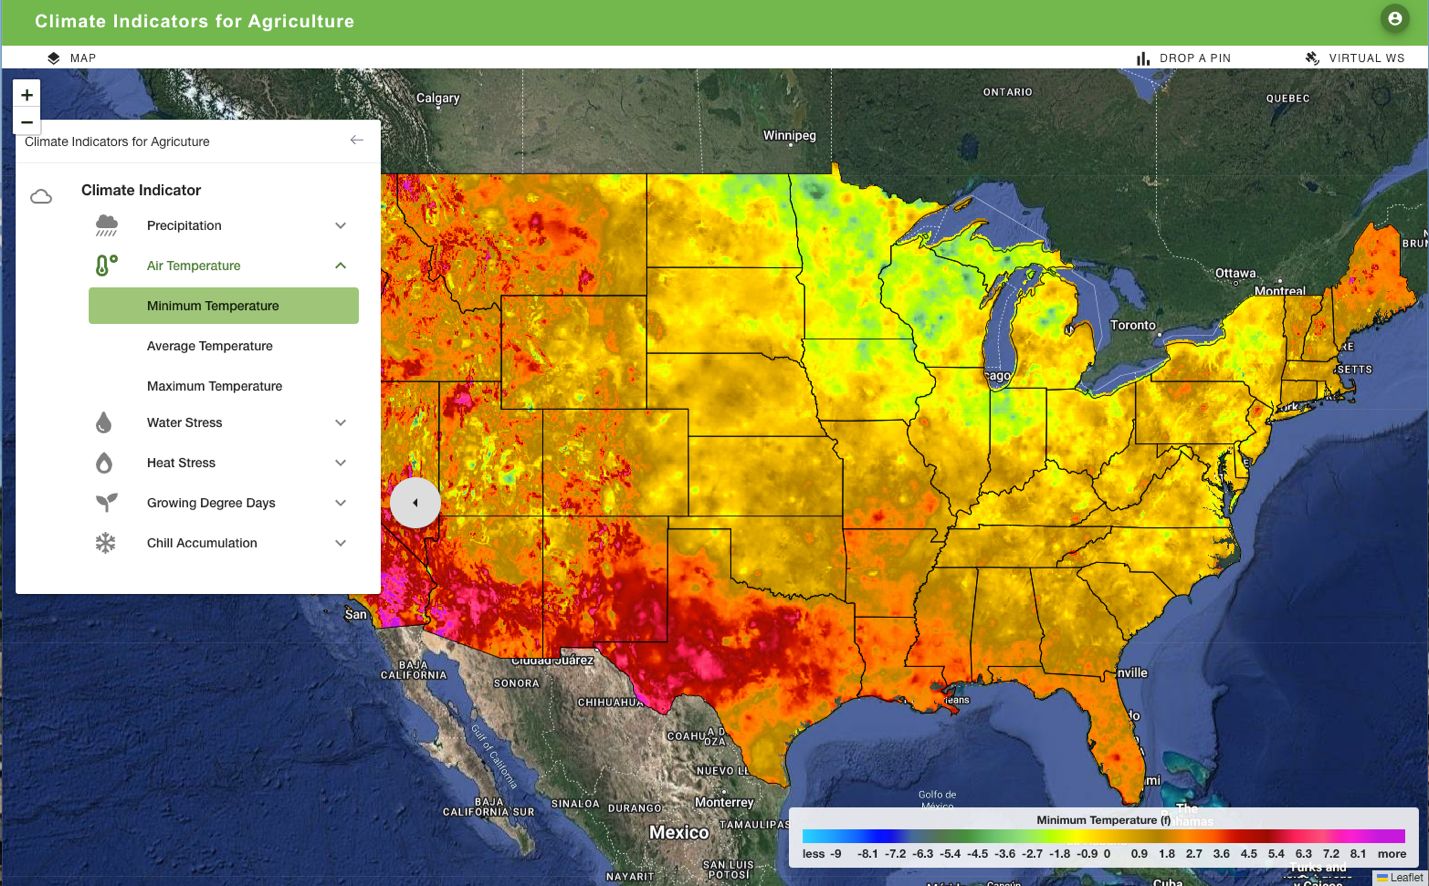
Credit: PRISM, Oregon State University. AgroClimate.org
Examples of Information Provided by the “Drop a Pin” Feature
A location in north central Florida is used to demonstrate the functionalities available under the “Drop a pin” feature. Once a location is selected in the map, a window with additional information is opened (Figure 3). There are three different tabs that can be selected: Overview (default tab); Deviation; and Indicators. The Overview tab shows the geographic coordinates of the selected location, the user-defined period, and basic statistics for selected variables. The example shown in Figure 3 displays a graph with accumulated rainfall in the selected location between August 8 and September 5 since 1981. During 2023, about 7.5 inches of rain were accumulated. If the marker in the map is moved to a different location, users need to click on the green “Load Data” button on the upper right side of the screen to refresh the graph.
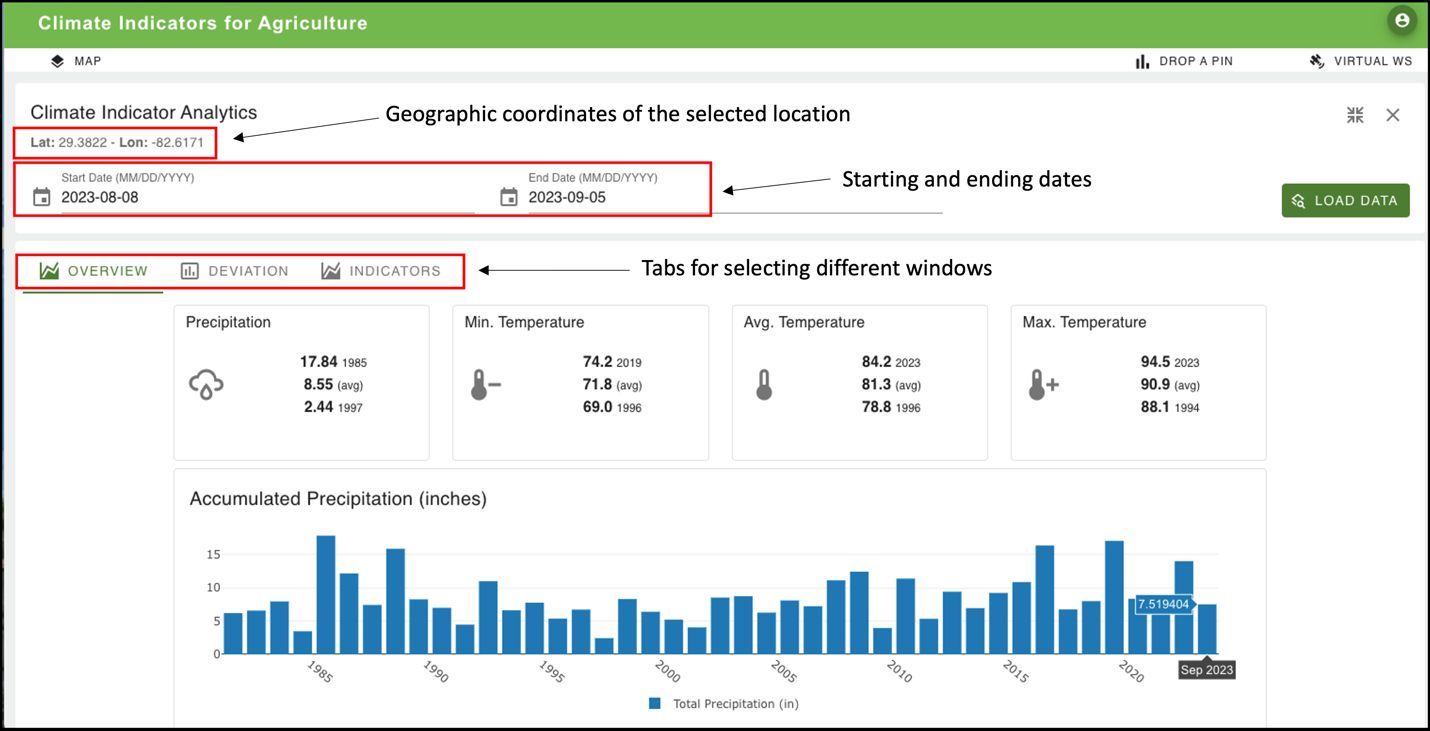
Credit: AgroClimate.org
Basic rainfall and temperature statistics are presented above the rainfall graph. The graph shows that, on average, approximately 8.55 inches of rainfall are observed in this location. The wettest year was 1985 (17.84 in) and the driest was 1997 (2.44 in). The long-term average minimum temperature is 71.8F, with the lowest observed in 1996 (69.0F) and the highest in 2019 (74.2°F). Information is also available for the overall average and average maximum temperatures.
Scrolling down the page yields additional information, including graphs of average maximum and minimum temperatures, and the maximum dry and wet spells expressed in the number of days for the same location and time period since 1981 (the earliest year for which data are available for all locations) (Figure 4).
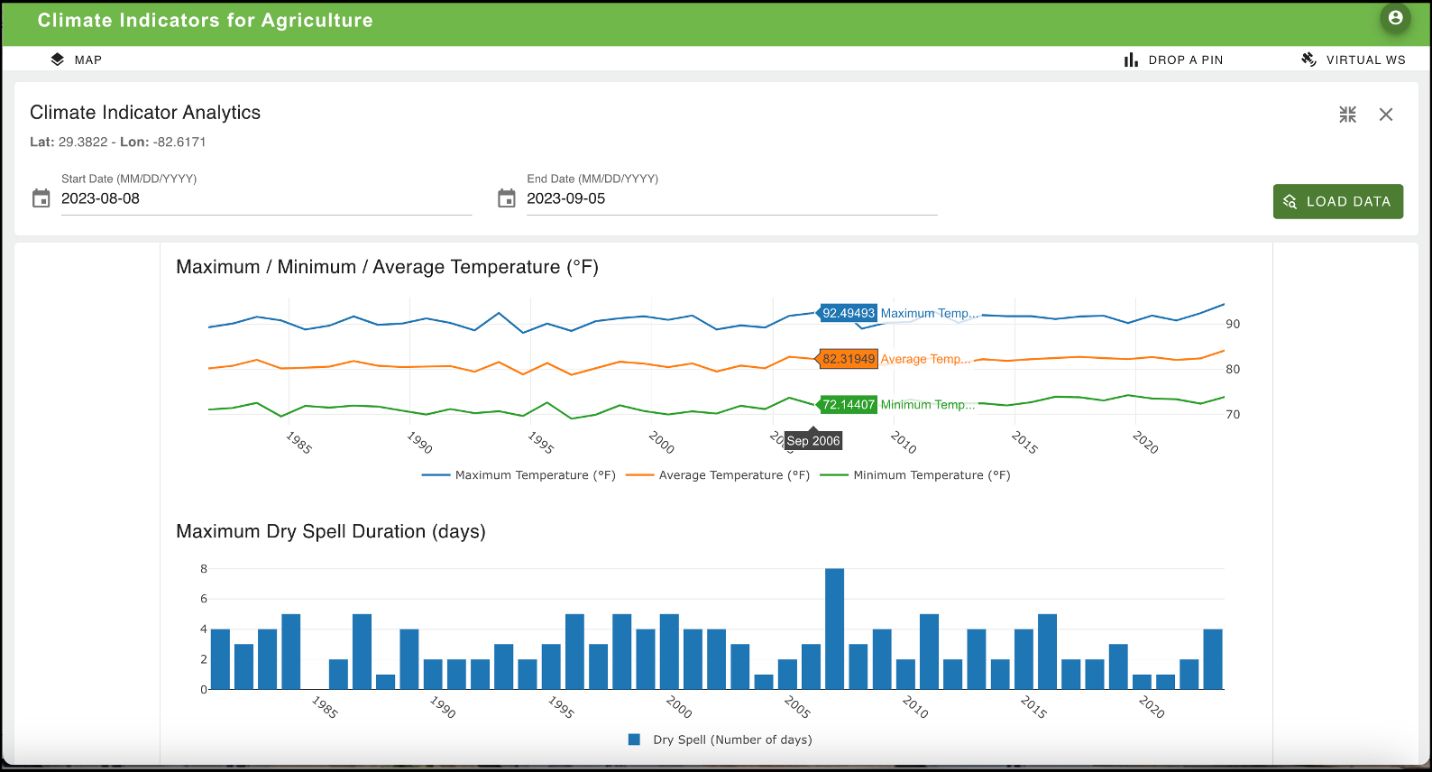
Credit: AgroClimate.org
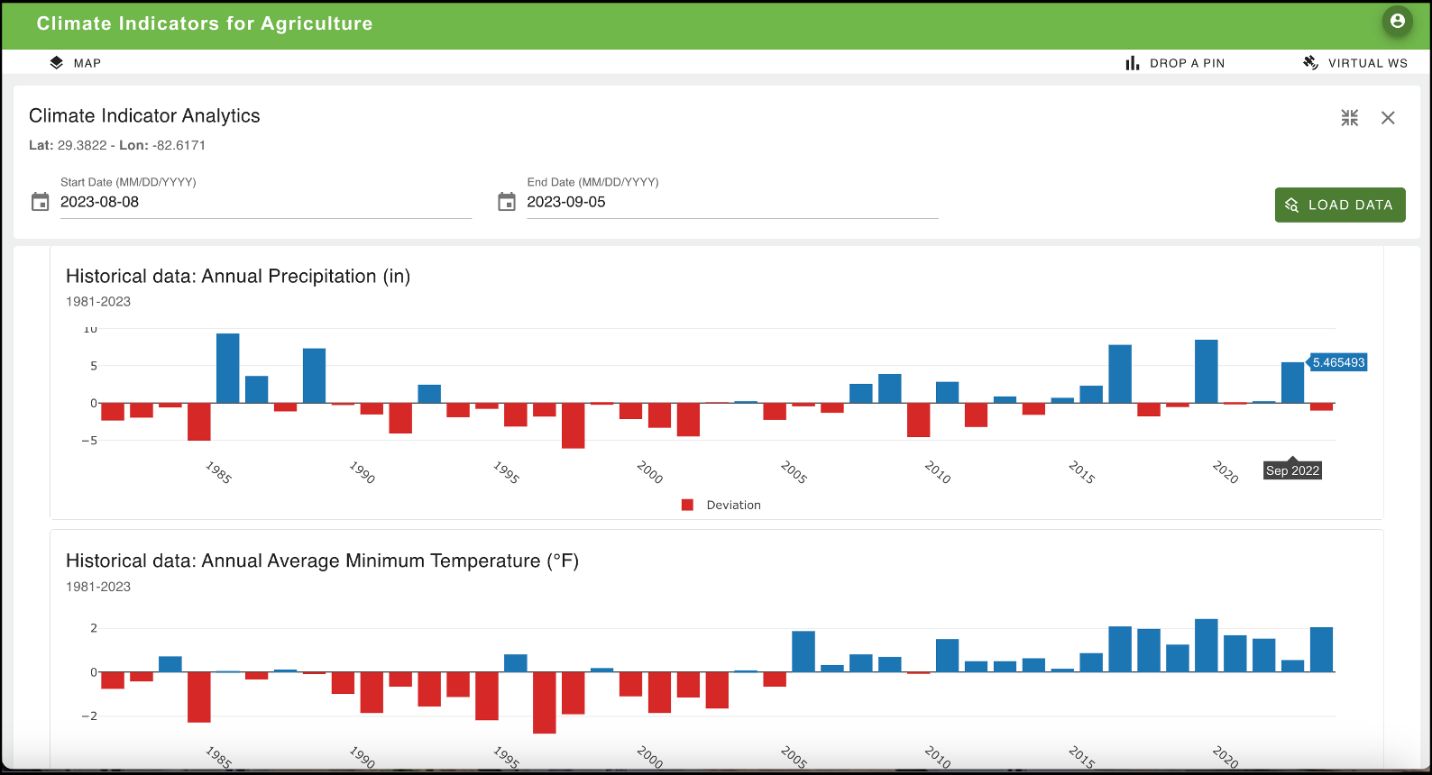
The Deviation tab shows the years with rainfall and temperature above or below the long-term averages (Figure 5). In most Florida locations, we have observed above-average minimum temperatures during the last decade.
Credit: AgroClimate.org
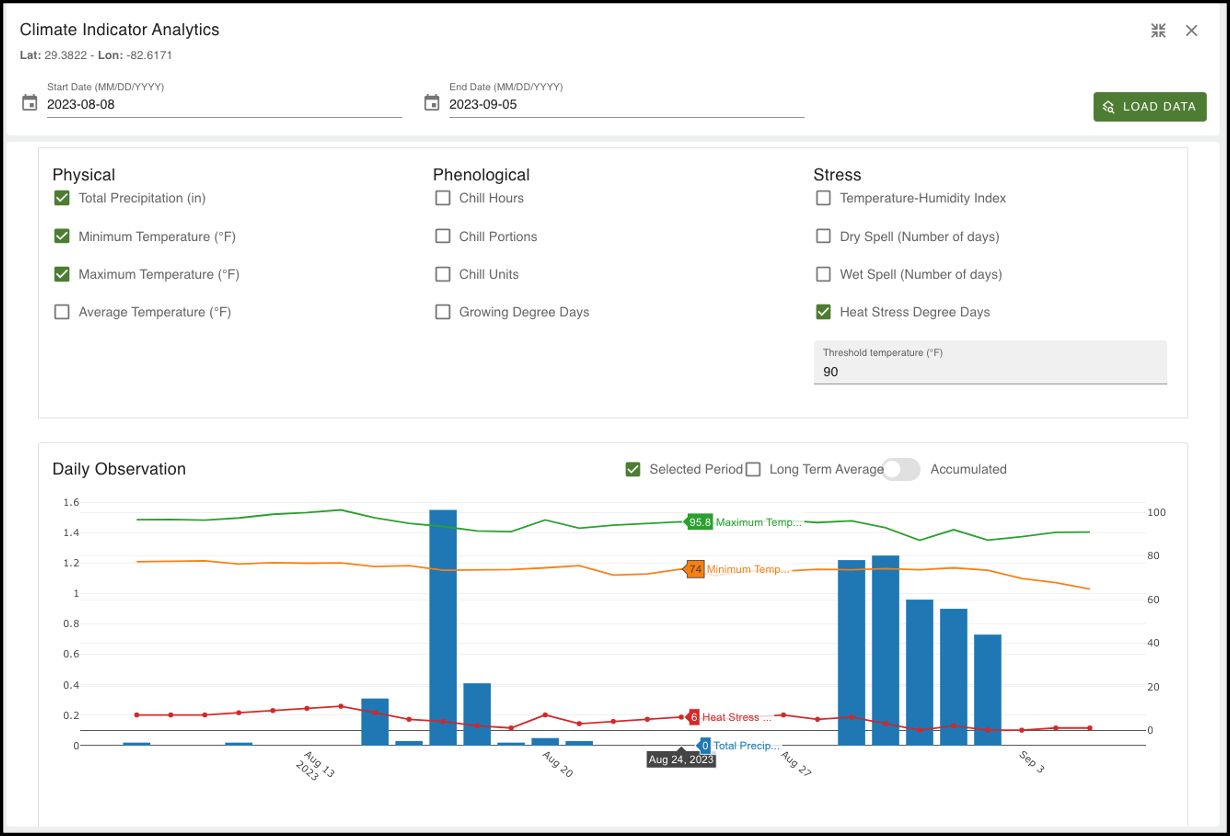
The Indicators tab can be used to visualize more detailed information about the conditions observed during the selected year (Figure 6). Climate-based physical, phenological, and stress indicators can be plotted using daily or accumulated values. Cumulative plots are not available for variables that should not be visualized in this way, such as air temperature.
Credit: AgroClimate.org
Creating a Virtual Weather Station
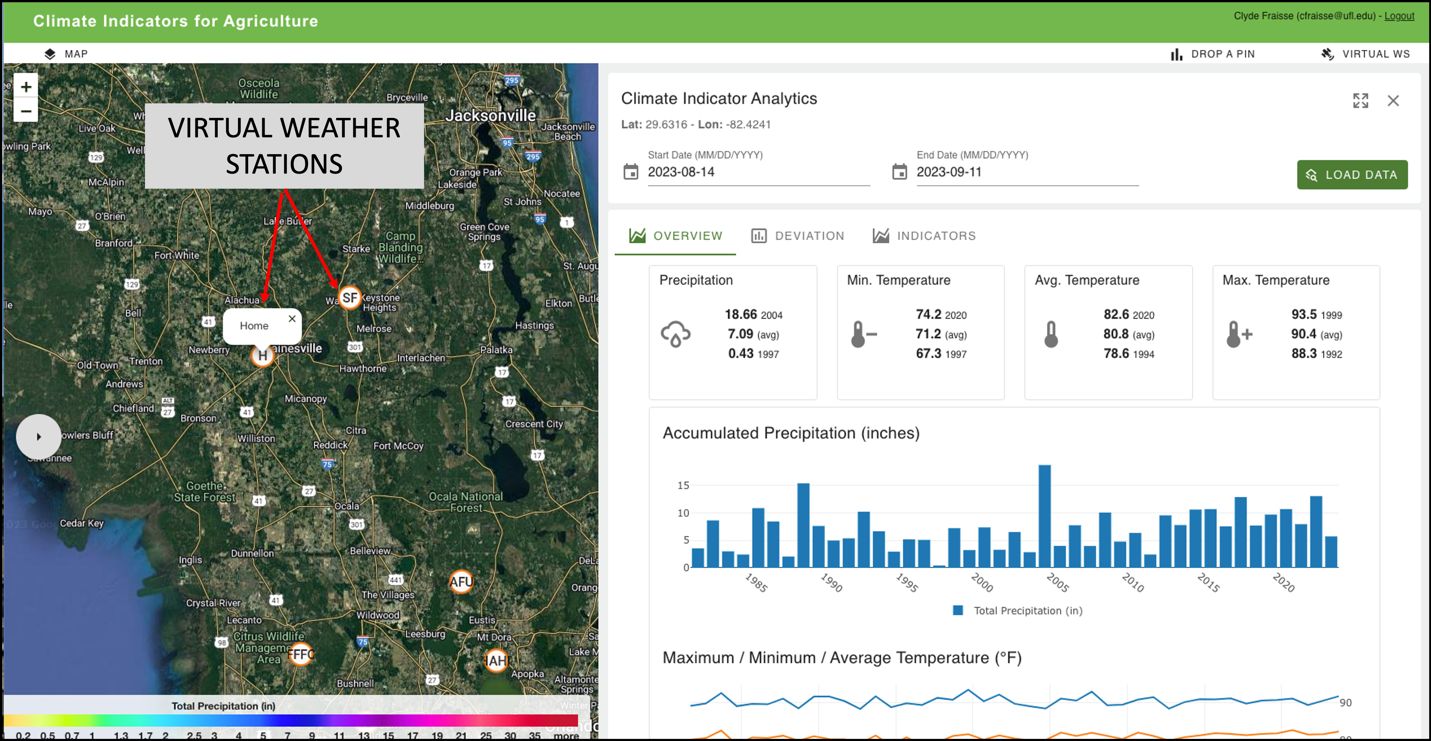
To enhance navigation and location functionality, the user can access the "Virtual WS" (virtual weather station) feature located in the upper-right corner. This is the only feature that requires creating an account because it needs to store the information related to the virtual weather stations for different users. Through this feature, the user can log into the system and enable the creation and visualization of static positions using latitude, longitude, and a customizable name. This facilitates smoother navigation for re-accessing or monitoring a given location multiple times. When users log in, they will only have access to the weather stations created under their accounts. Clicking over the marker displayed on the map, the user will be redirected to the "Drop a pin" tab, loading the data based on the virtual point coordinates (Figure 7).
Credit: AgroClimate.org
Phenological and Stress Indicators Available in the Tool
Agroclimatic indicators available in the tool are briefly described below. More detailed information is provided in existing Ask IFAS publications or will be provided in subsequent publications under the Climate Indicators for Agriculture series that is currently under development.
Growing Degree Days (GDD)
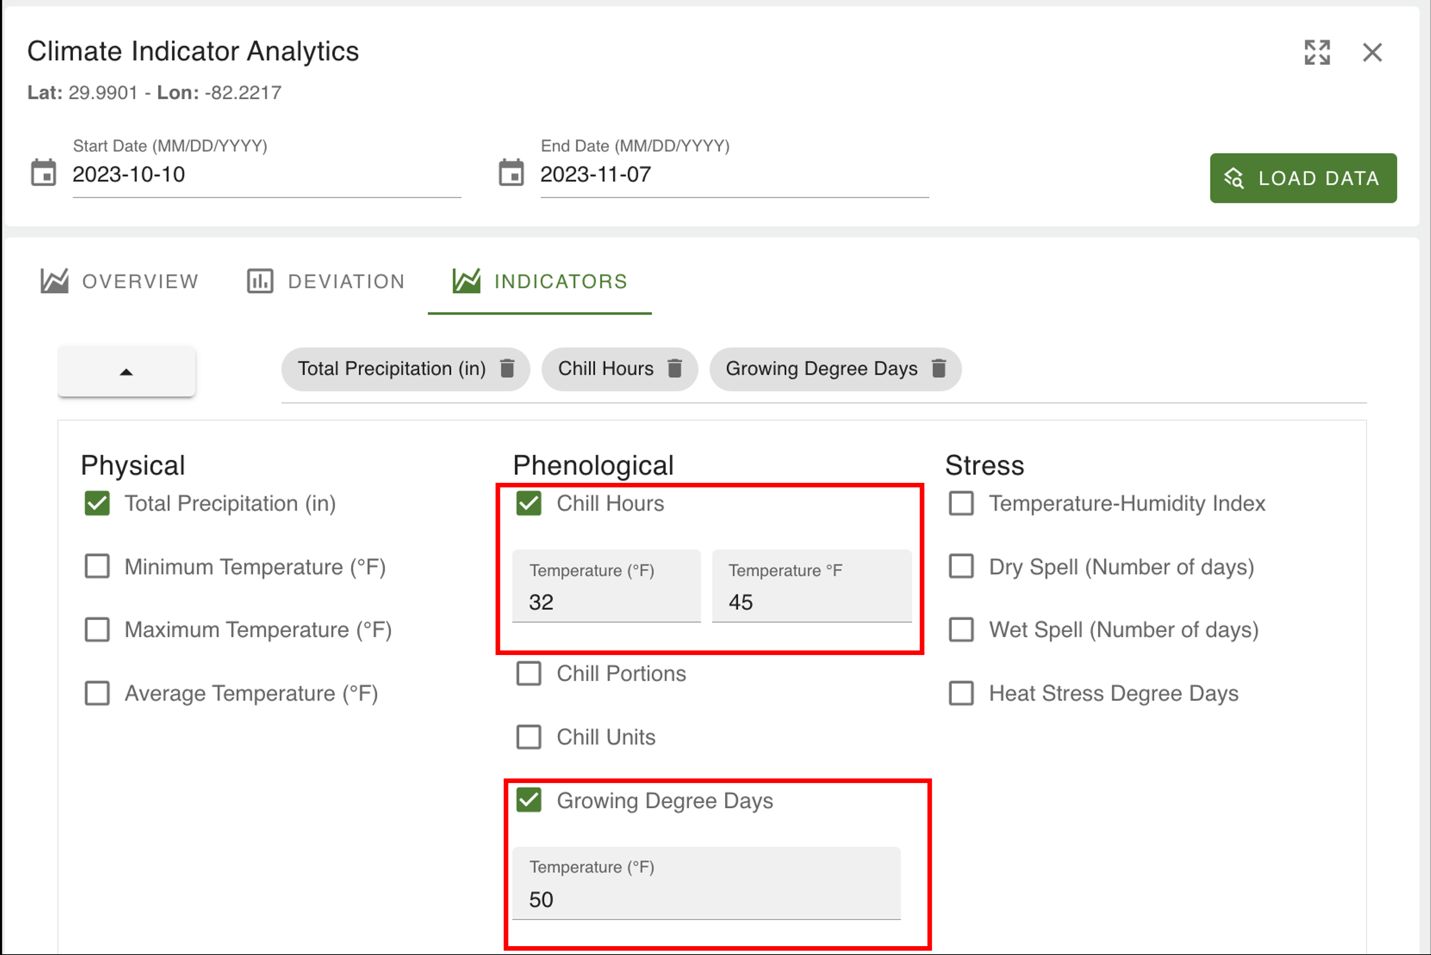
Because the growth rate of many organisms is controlled by temperature, growers use a concept called growing degree days (GDD), sometimes called heat units. GDD is used to relate plant growth, development, and maturity to air temperature. GDD is based on the idea that the development of a plant will occur only when the temperature exceeds a specific base temperature for a certain number of days. Each type of plant is adapted to grow best over its own specific base temperature, called Tbase. Even cultivars of the same plant species sometimes have different Tbase. Users can customize Tbase according to the crop of interest (Figure 8). GDD is calculated in the tool using the standard (also called averaging or rectangle) method, which uses simple averaging of daily maximum and minimum temperature. More information about GDD can be found in Ask IFAS publication AE428.
Credit: AgroClimate.org
Chill Accumulation
All economically important fruit and nut tree species that originated from temperate and cool subtropical regions have chilling requirements that must be fulfilled each winter to ensure homogeneous flowering and adequate fruit set. Climate change may make achieving critical chilling even more important in years to come. Chill accumulation can be plotted under the Indicators tab using three different calculation methods:
Chill hours: In this method, chill accumulation is estimated by counting the hours with air temperature under or within specific temperature thresholds. Most people agree that temperatures below 32˚F (0˚C) or above 60˚F (15.5˚C) are not effective. Using blueberries as an example, temperatures between 32˚F and 45˚F appear to be the most effective at satisfying the chilling requirements. These thresholds are used to visualize chill accumulation in a map format. Users can customize the temperature thresholds under the Indicators tab by entering different lower and upper temperature thresholds (Figure 8).
Chill portions: A model developed in Israel in the late 1980s, the “Dynamic Model” (Erez et al. 1990) measures chilling in units called chilling portions (CP). Its approach is based on a two-step process, where different temperatures affect chill accumulation (32ºF to 54.5ºF) and negation (<32ºF and >54.5ºF). Cold temperatures initially result in the formation of an intermediate chilling amount; high temperatures can negate this chill accumulation. However, once a critical amount of chilling has accumulated, it converts to a chill portion which cannot be destroyed, and chill accumulation is irreversibly locked into chill portions (Zhang and Taylor 2011). Chill portions are believed to be a more effective way to calculate chill accumulation in warmer, subtropical climates such as the climate of Florida and other southeastern states.
Chill units: In the case of chill units, the hours are weighted for their effectiveness in satisfying chilling requirements depending on the temperature. The Utah model (Richardson et al. 1974) is used to calculate chill units in the tool. It works well in temperate growing regions of the world with generally cold winters, but it does not accurately track chilling in regions with warm winter temperatures such as Florida, where cold periods alternate with warm periods.
Dry and Wet Spells
Dry spells and wet spells refer to the maximum number of sequential dry days or wet days, respectively, within the period of consideration. A threshold of 1 mm (0.039 in) is used to classify a given day as dry or wet; days with precipitation less than 1 mm are considered dry. Bar graphs showing the maximum duration of dry and wet spells (days) during the period of time defined by the user are shown in the Overview tab. Under the Indicators tab, a box will appear above the graph to show the years when the maximum and minimum dry and wet spells were observed.
Drought Stress (ARID)
The Agricultural Reference Index for Drought (ARID) (Woli et al. 2012) is used to monitor drought conditions. ARID is based on a reference crop, which is actively growing grass that completely covers the soil surface. ARID uses a simple soil water balance for a soil profile assumed to be 16 inches (40 cm) deep with evenly distributed roots. The amount of soil water in the root zone is calculated daily based on how much water is added to the system by rainfall and how much water leaves the system by transpiration, runoff, and deep percolation (drainage). ARID values range from 0 to 1. When no transpiration occurs, ARID takes a maximum value of one, indicating a full water deficit. ARID is zero when transpiration occurs at the potential rate, indicating no deficit at all. ARID is only available in map format.
Heat Stress Degree Days
Heat stress degree days are calculated based on the daily maximum air temperature. The daily value of heat stress degree days is calculated using four temperature thresholds (86°F, 90°F, 93°F, 97°F) and can be visualized in map format. Users can also calculate heat stress degree days under the Indicators tab, which allows the calculation using temperature thresholds defined by the user.
Temperature Humidity Index (THI)
The Temperature Humidity Index (THI) represents the combination of air temperature and humidity associated with the level of thermal stress. The THI was developed as a weather safety index to monitor heat stress primarily in dairy cows. Utilizing both humidity and temperature is important compared with utilizing temperature alone to evaluate heat stress. The equation used to estimate THI is:

Credit: null
Where:
T = Dry bulb temperature (°F)
RH = Relative humidity (%)
The THI is usually classified into levels of heat stress. The levels of stress are generally separated into mild (72 to 79 THI), moderate (80 to 89 THI), and severe (90 THI or greater).
Conclusions
The AgroClimate Indicators web tool is a new resource to help agricultural managers monitor climate and derived indicators with the potential to affect the agricultural industry in the United States. It was designed in a modular approach, and additional indicators can be added to the system as necessary. Our goal with this tool is to help agricultural managers identify and monitor climate anomalies and extreme events even if a weather station is not available in the farm or location of interest. The tool also offers a regional and national overview to facilitate decision making at the state and regional levels. For technical assistance or other questions about the tool, contact the AgroClimate team: http://agroclimate.org/contact/.
Acknowledgments
This research was supported by Cooperative Agreement 58-0111-22-006 established between the United States Department of Agriculture Office of the Chief Economist and the University of Florida.
References
Daly, C., M. Halbleib, J. I. Smith, W. P. Gibson, M. K. Doggett, G. H. Taylor, and P. P. Pasteris. 2008. “Physiographically Sensitive Mapping of Climatological Temperature and Precipitation across the Conterminous United States.” Int. J. Climatol.: J. R. Meteorol. Soc. 28 (15): 2031–2064. https://doi.org/10.1002/joc.1688
De Pondeca, M. S. F. V., G. S. Manikin, G. DiMego, S. G. Benjamin, D. F. Parrish, and R. J. Purser. 2011. “The Real-Time Mesoscale Analysis at NOAA's National Centers for Environmental Prediction: Current Status and Development.” Weather and Forecasting 26 (5): 593–612. https://doi.org/10.1175/WAF-D-10-05037.1
Erez, A., S. Fishman, G. C. Linsley-Noakes, and P. Allan. 1990. “The Dynamic Model for Rest Completion in Peach Buds.” Acta Hort. 276:165–174. https://doi.org/10.17660/ActaHortic.1990.276.18
Fraisse, C. W., N. E. Breuer, D. Zierden, J. G. Bellow, J. O. Paz, V. E. Cabrera, A. Garcia y Garcia, K. T. Ingram, U. Hatch, G. Hoogenboom, J. W. Jones, and J. J. O'Brien. 2006. “AgClimate: A Climate Forecast Information System for Agricultural Risk Management in the Southeastern USA.” Computers & Electronics in Agriculture 53 (1): 13–27.https://doi.org/10.1016/j.compag.2006.03.002
Richardson, E. A., S. D. Seeley, and D. R. Walker. 1974. “A Model for Estimating the Completion of Rest for Redhaven and Elberta Peach Trees.” HortScience 9:331–332.https://doi.org/10.21273/HORTSCI.9.4.331
Walsh, M. K., P. Backlund, L. Buja, A. DeGaetano, R. Melnick, L. Prokopy, E. Takle, D. Todey, and L. Ziska. 2020. Climate Indicators for Agriculture. USDA Technical Bulletin 1953. Washington, D.C. https://doi.org/10.32747/2020.7201760.ch
Woli, P., J. W. Jones, K. T. Ingram, and C. W. Fraisse. 2012. “Agricultural Reference Index for Drought (ARID).” Agronomy Journal 104:287–300. https://doi.org/10.2134/agronj2011.0286
Zhang, J., and C. Taylor. 2011. “The Dynamic Model provides the best description of the chill process on ‘Sinora’ pistachio trees in Australia.” HortScience 46 (3): 420–425. https://doi.org/10.21273/HORTSCI.46.3.420