This is the second publication in a series on fish population recruitment. The first publication, entitled Fish Population Recruitment: What recruitment means and why it matters is available at https://edis.ifas.ufl.edu/fa222
Abstract
Recruitment is important for stock assessment and fisheries management, but how it is used is not straightforward or particularly easy to find information on. This publication first describes how recruitment is defined by the “stock recruit relationship,” which relates the numbers of expected recruits to the spawning stock biomass. Then it explains how the stock-recruit relationship is connected to “spawning potential ratio” and, ultimately, to designations of fish populations being overfished or not. This publication reviews a recent Florida spotted seatrout stock assessment as an example that illustrates how the status of a fishery relates back to the stock recruitment relationship.
Introduction
Review of Recruitment
The recruitment process, in which small, young fish go through a transitionary period during which their mortality is density-dependent, is one of the most important aspects of fish population dynamics. Recruitment determines the year-class strength (relative abundance) of sub-adult and adult fish, which in turn regulates how many fish are available for fishers to catch and, eventually, how many fish can reproduce. This means that recruitment processes mostly determine the effectiveness of various fisheries management strategies. Some of these commonly used in Florida include stock enhancement, habitat restoration, and harvest restrictions. It also means that looking at trends in recruitment over time can help us understand whether fish populations are being overfished or impacted by changes in environmental conditions. The recruitment process is complicated, involving multiple life-history sub-stages in which young fish change their habitats, food, body shape and size, and behavior. Representing all of these complex effects is not logistically feasible, so fisheries scientists typically use a simplifying concept to represent recruitment—the stock-recruit relationship.
Credit: Ed Camp
Stock Recruit Basics
The Stock Recruitment Relationship
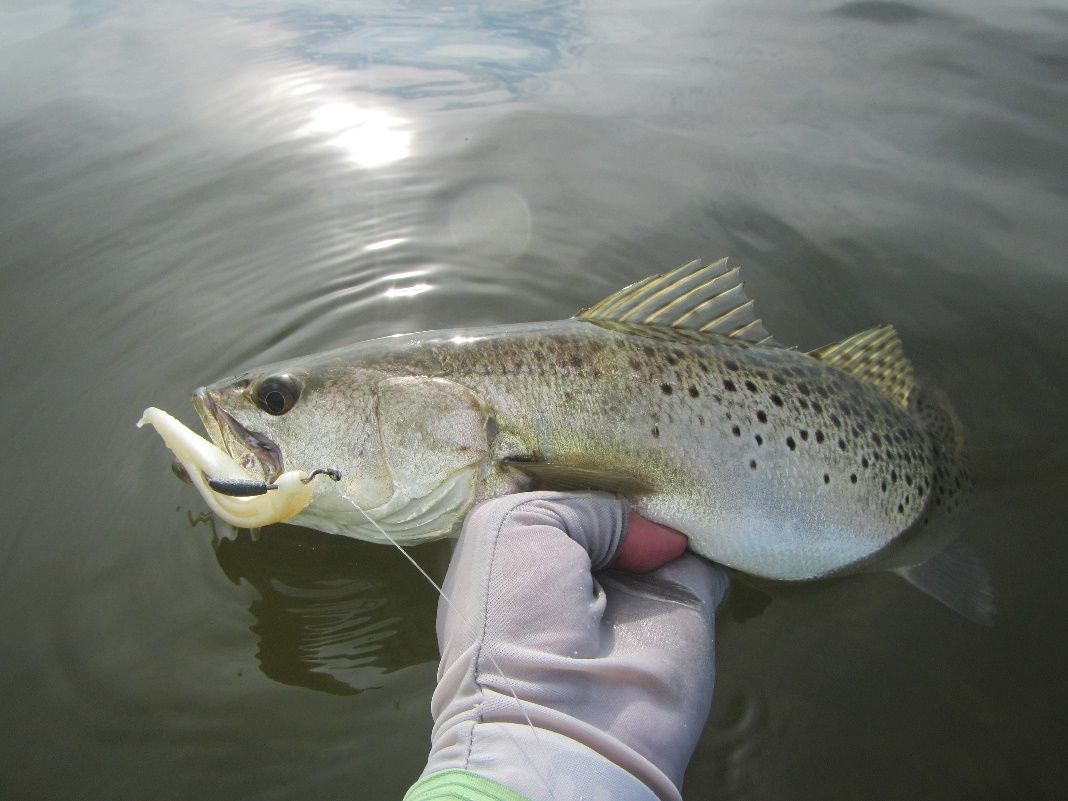
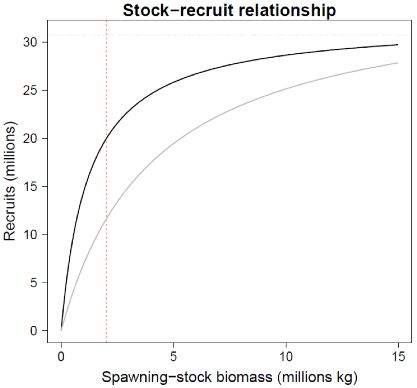
The stock-recruit relationship refers to the mathematical relationship between spawning adults and the expected numbers of recruits that a spawning population eventually produces each season. The stock-recruit relationship does not actually have anything to do with stock enhancement or “stocking”— here the term “stock” refers to “spawning stock,” since a single group of a species of fish is often called a “stock.” For example, the population of spawning spotted seatrout in the northwest region of Florida’s Gulf coast might be referred to as the “northwest Florida spotted seatrout spawning stock” (Figure 1). This relationship explains how expected recruitment should change as the number of spawning adults within a population changes. (In reality, recruitment varies a lot, so the relationship describes what we would expect on average, which is why we call it expected recruitment.) The most common type of stock-recruit relationship is called the Beverton-Holt stock-recruit relationship (Beverton and Holt 1957; Figure 2). The name “Beverton-Holt” refers to a specific mathematical relationship that produces this “asymptotic” or “leveling off” shaped curve. What this shape means is that for a wide range of spawning stock abundances, the expected numbers of recruits change very little. However, as the spawning stock abundance declines (leftward movement along the x-axis or bottom axis; Figure 2), there reaches a point at which recruitment will in fact decline sharply. This pattern is the result of density-dependent mortality. In fact, the leveling-off shape of the Beverton-Holt stock-recruit relationship occurs precisely because when there is greater spawning stock biomass (which will translate to lots of eggs and larval fish), the survival rate of eggs-to-recruits declines (because of competition among recruiting fish). On the other hand, when there is low spawning stock abundance (and thus fewer eggs and larvae), the survival rate is greater because there is less competition (though the expected number of recruits declines because many fewer eggs are produced). So what is happening when the spawning stock biomass (and thus eggs and larval fish) is somewhere in the middle—say around 3–4 million kg, as in Figure 2, below? The recruits are just starting to more rapidly decline, which means that the spawning stock is getting low enough that recruitment will be limited and the stock overfished. This is shown in the dashed red line of Figure 2 and is discussed further below.
Stock-Recruit Relationship Parameters and What They Mean
The specific shape of the Beverton-Holt stock-recruit relationship depends on two parameters that relate to the fish population: (1) “recruitment compensation” (sometimes called steepness), a measure of how well small fish survive when there is little competition for space and food, and (2) “recruitment at unfished conditions,” a measure of the capacity of the environment to support young fish. Recruitment at unfished conditions simply describes what the expected recruitment would be if the fish population had not ever been harvested—i.e., the recruitment levels corresponding to very large spawning stock biomasses (the far-right of the x-axis in Figure 2). Recruitment compensation (or steepness) refers to how much survival can improve at low spawning stock abundance. Graphically, this is represented by how “steep” the Beverton-Holt curve is near the origin (where the y- and x-axis meet). A steeper line (which means a greater steepness, also known as compensation ratio) means that there is a greater increase in young fish survival at low adult population sizes. This difference is illustrated by the difference between the black line (greater steepness) and gray line (lesser steepness) in Figure 2. Steepness can vary among species of fish or even within populations (Myers et al. 1999). While there is a lot of variability, it seems that fish that use structured habitats (e.g., mangroves, reefs) during recruitment processes, like gray snapper, grouper, or red drum, are more likely to have greater compensation/steepness (more places for young fish to hide), whereas fish that are more pelagic at these stages, like mackerels or some baitfish species, will often (but not always) have lesser steepness (i.e., lesser increase in survival of young fish as adult populations decline), because there are limited behaviors (i.e., schooling) to avoid predation.
Stock-Recruitment and Fisheries Management
Why does all of this matter? With good estimates of the parameters of the stock-recruit relationship and a good estimate of the current abundance of spawning stock (i.e., where along the x-axis we were), then we would be able to assess if there, on average, were too few fish spawning to produce a good number of recruits. Said another way, we’d know if the spawning fish population had declined so much that average recruitment was declining substantially. (This would be spawning stock biomasses less than, or to the left of, the dashed red line in Figure 2.) This would indicate overfishing and, under most current fisheries management plans, would be interpreted as a need to restrict fishing mortality via regulation (such as by decreasing allowable harvest, open season, or bag limits). The problem is that often the stock-recruit parameters (steepness, recruitment at unfished conditions) are not always known very well. This is especially the case if we lack biological studies and long-term data sets, or if we are examining a species that was fished substantially before data collection began (especially common for marine species). For this reason, fisheries scientists often rely upon a different metric called Spawning Potential Ratio (SPR).
SPR and Why It Matters for Stock Assessment
In short, SPR describes how fishing has reduced the abundance of spawning fish. More technically, the SPR is the ratio of the spawning biomass produced over the lifetime of a recruit in fished versus unfished conditions. Somewhat confusingly, the lifetime, cumulative spawning biomass that an average recruit produces is termed the “spawners per recruit” (Goodwin et al. 2006), so the spawning potential ratio (SPR) is actually the ratio of spawners-per-recruit when a population is fished to when it is not fished. What all this means is that a fished population with an SPR of 0.75 has not had its spawning potential greatly reduced, whereas a fished population with an SPR of 0.25 has experienced a tremendous reduction in spawning potential. A wide range of studies have suggested that SPR values lower than ~0.35 are indicative of overfishing and will result in lower recruitment (Walters and Martell 2004; Legault and Brooks 2013). Increasingly over the last few decades, SPR has been used to provide “targets” for fisheries managers. SPR values are monitored and used by management agencies to indicate when specific fisheries may be approaching a “dangerous” SPR threshold and can also indicate how well stocks are recovering by providing a “target” to meet when rebuilding depleted stocks.
In other words, if there is insufficient data to determine the stock-recruit relationship, SPR is used as a reasonable surrogate to understand the status of a stock.
An Example of Stock Recruit Relationships in Florida
Florida Gulf of Mexico Spotted Sea Trout
Recently, the Florida Fish and Wildlife Conservation Commission completed a stock assessment of spotted seatrout (Cynoscion nebulosus) (Figure 3) populations in Florida waters (Addis et al. 2018). The stock assessment estimated the following parameters for the northwest Florida spotted sea trout population (Table 1; Addis et al. 2018).

Credit: Ed Camp
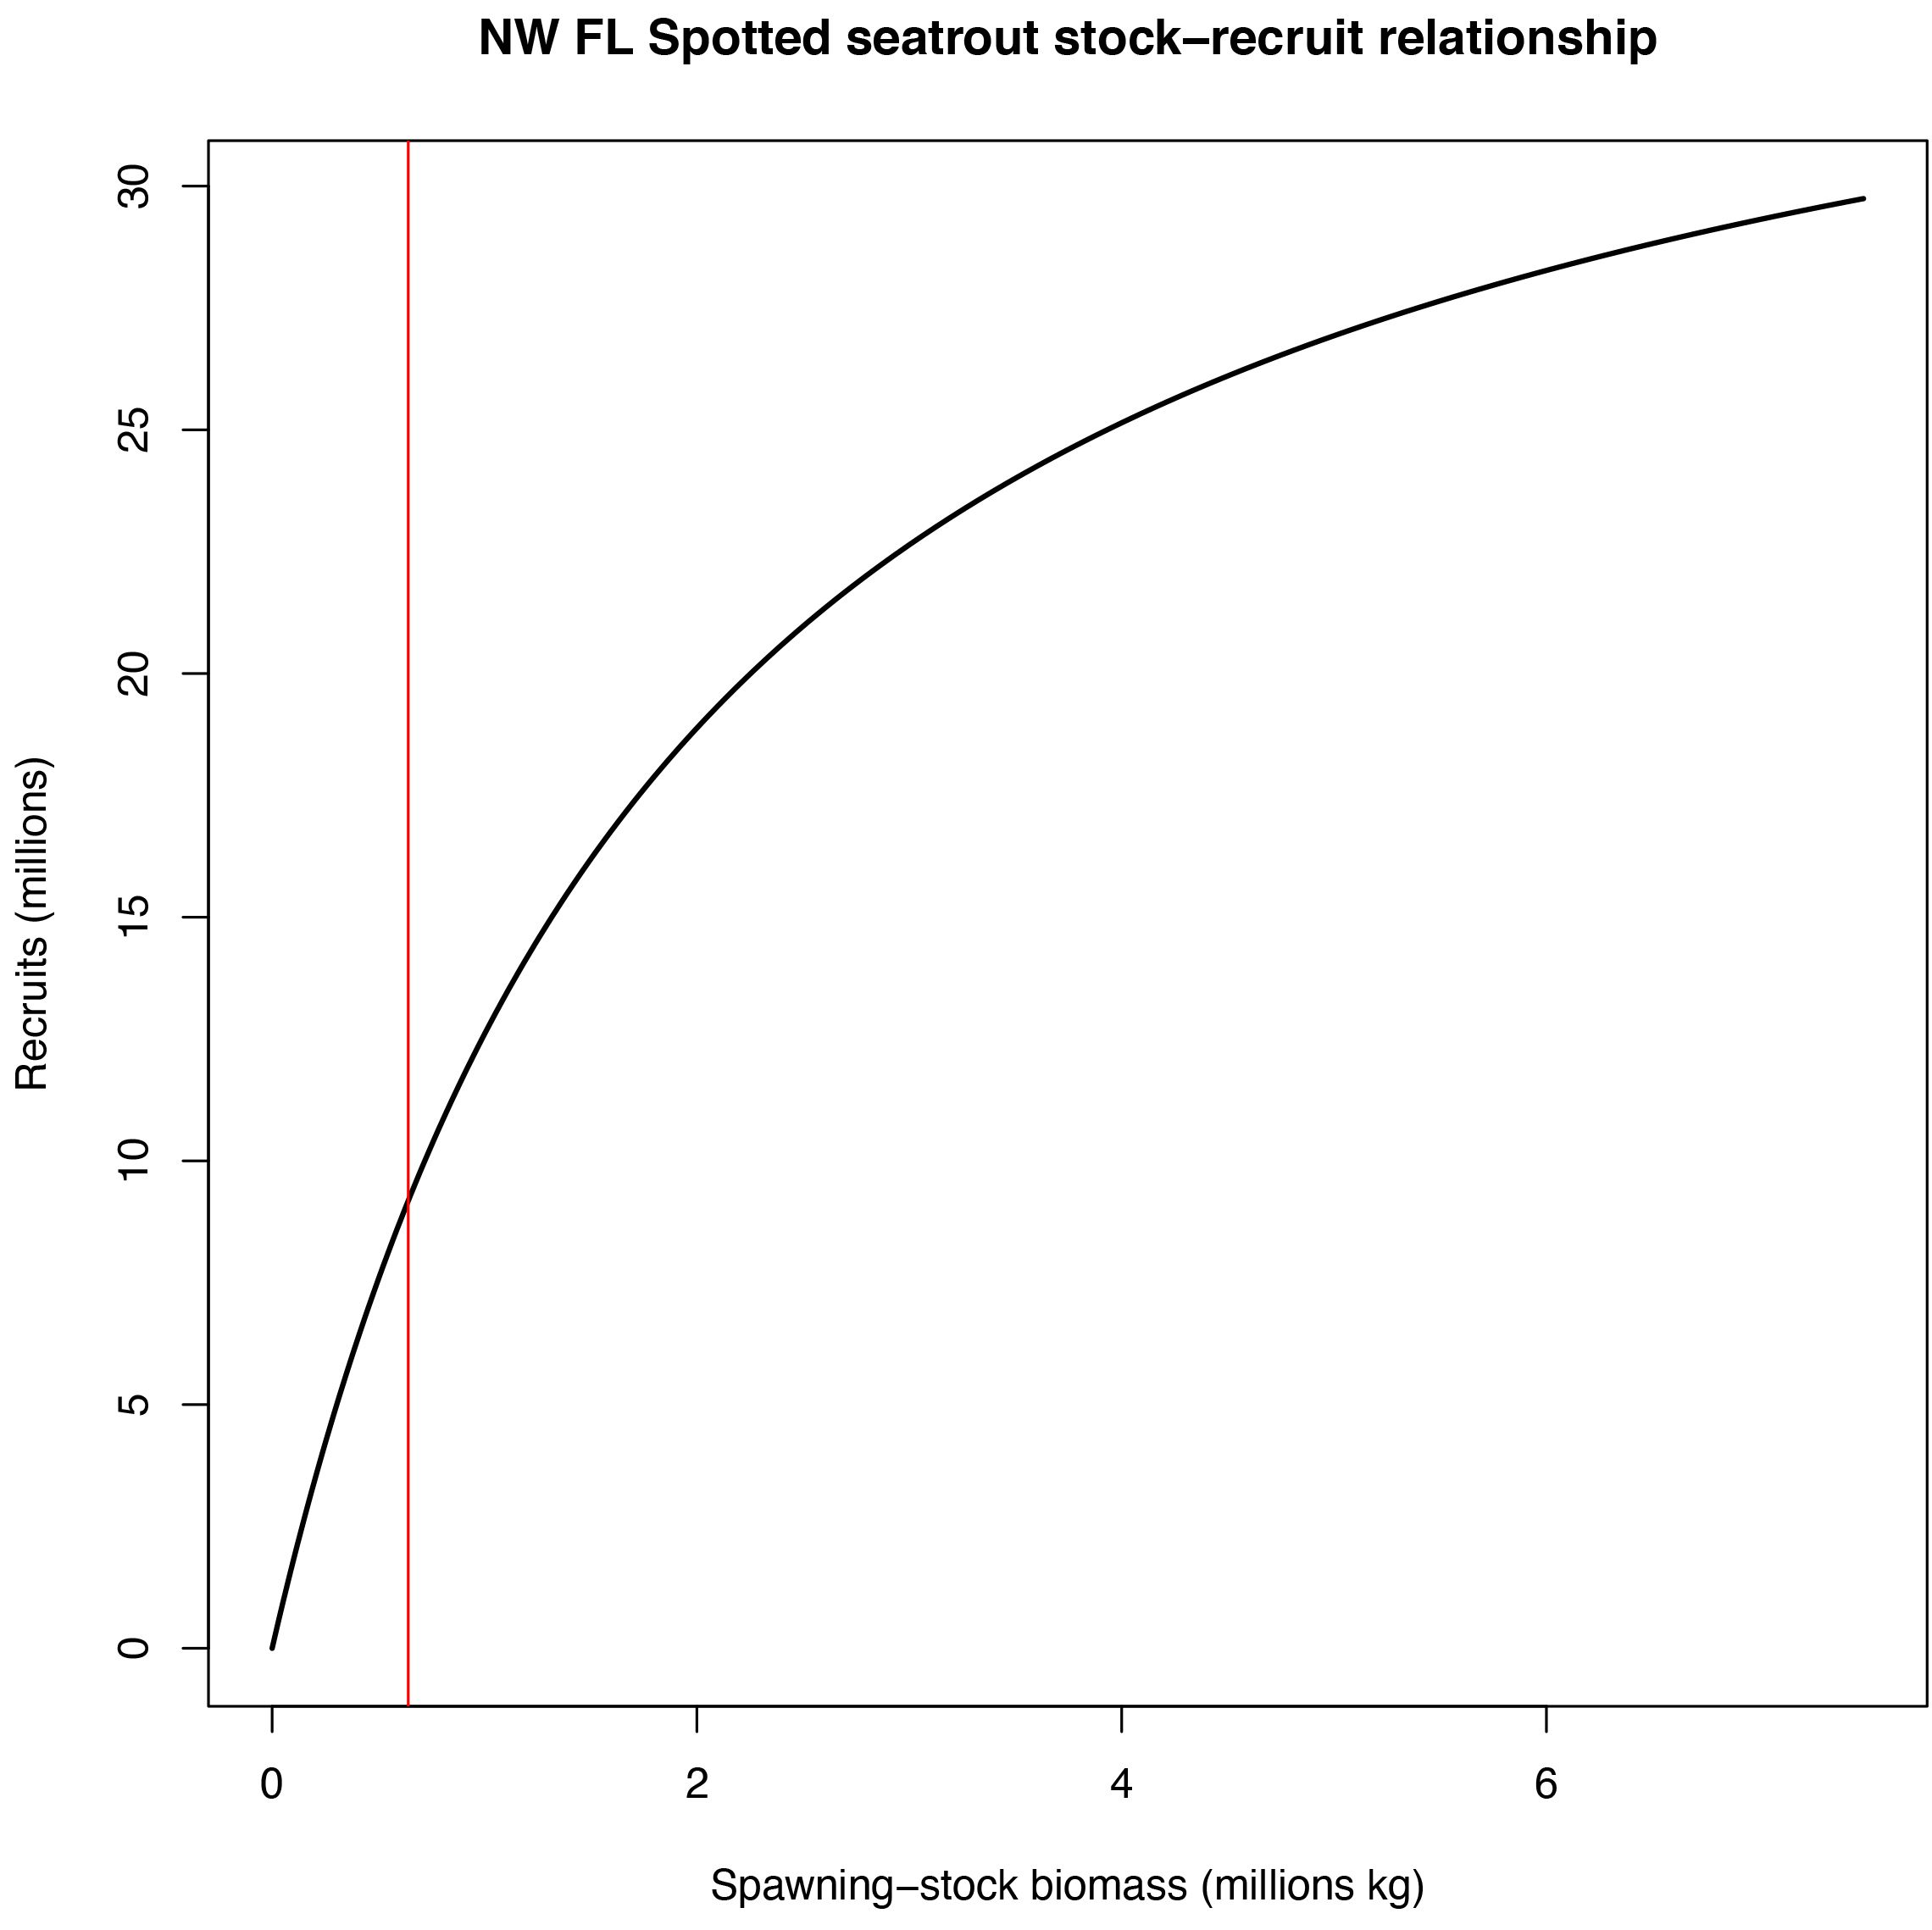
The steepness parameter (analogous to recruitment compensation and measuring how much survival increases at low stock sizes) is actually quite low relative to many other species (Myers et al. 1999). When this value, the other values in Table 1, and other biological information (like weight and fecundity across ages) are combined, one can construct a stock-recruit relationship (Figure 4).
Table 1. Parameters of the northwest Florida spotted seatrout population, from Addis et al. 2018.
Credit: Ed Camp
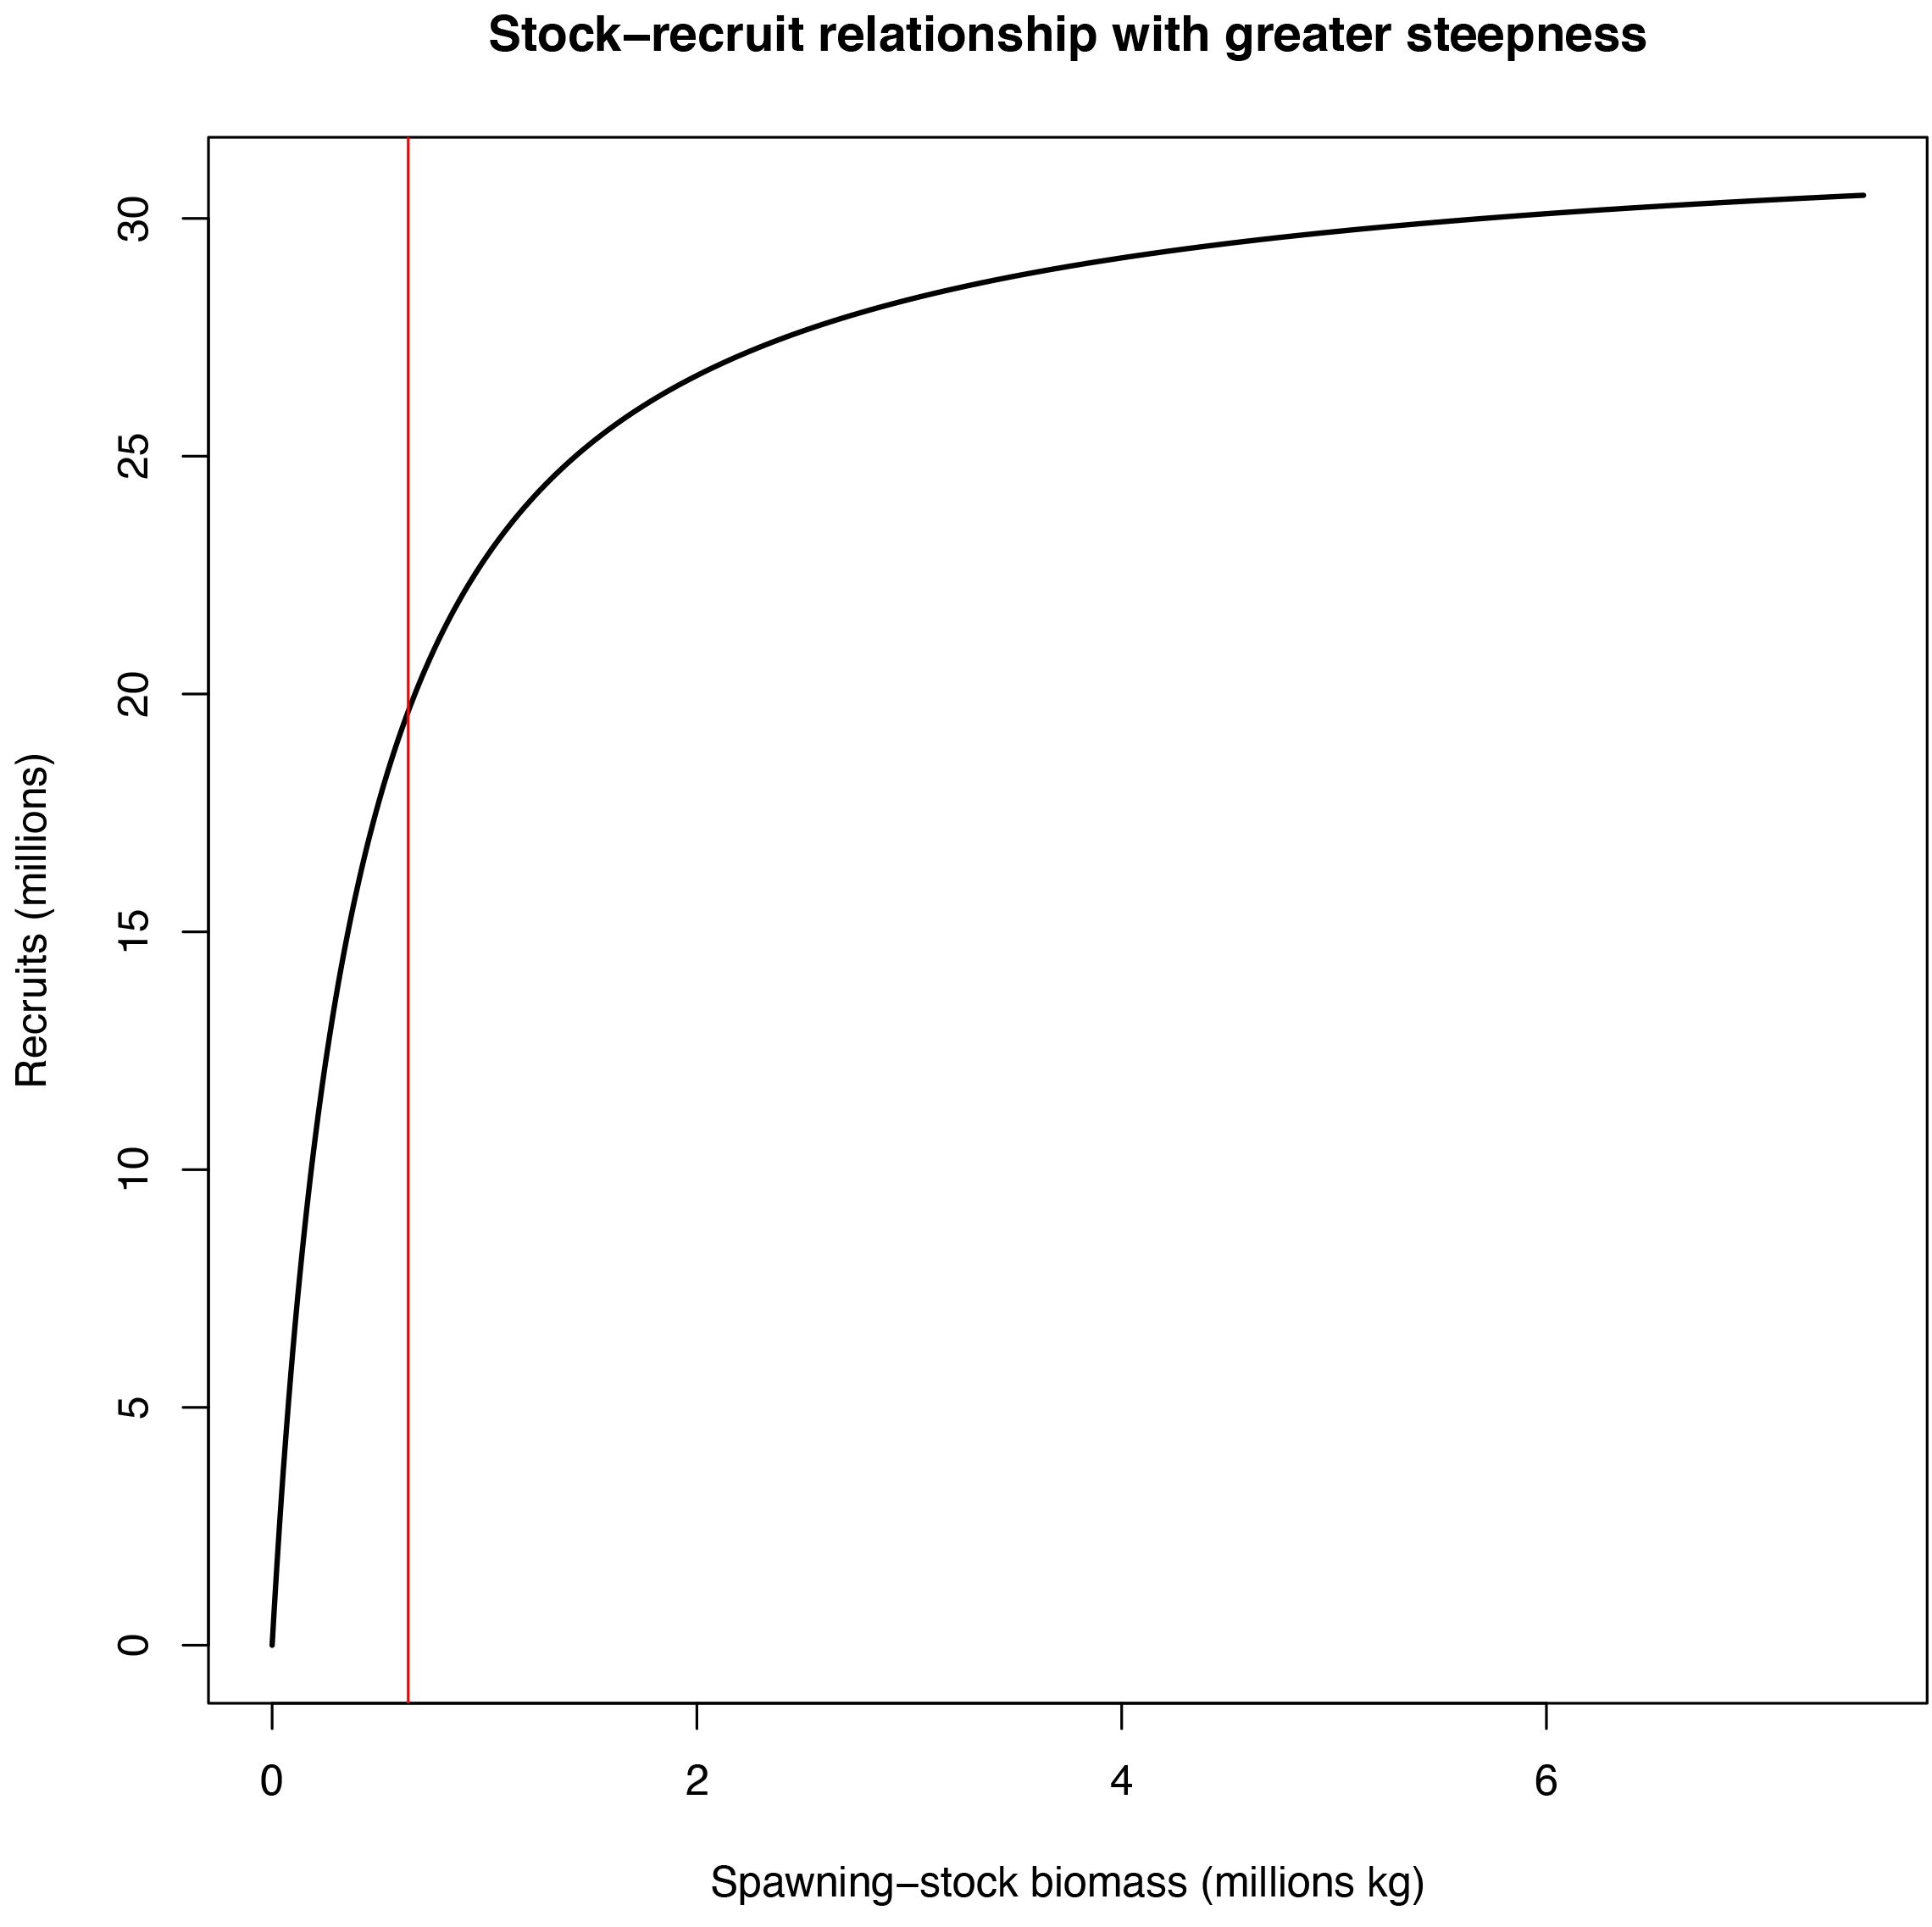
The stock-recruit relationship (Figure 4) shows how the current estimated spawning stock biomass (vertical red line) is much, much lower (less than 10%) than it would have been under unfished conditions (Table 1). Because of density-dependent mortality, the recruitment expected with the current biomass is about 30% of what it would have been under unfished conditions. However, this is still less than desired, which the SPR of 0.27 (Table 1) suggests. To illustrate a bit more about recruitment compensation, we can create the same figure but assuming a much greater steepness value, say 0.85, which would mean a greater increase in survival at low stock sizes (Figure 5).
Credit: Ed Camp
The resulting figure (Figure 5) shows the identical current spawning-stock biomass, but the stock-recruit relationship is much steeper near the origin (meeting of y- and x-axes). This means that the recruitment expected with this assumed steepness would be about 60% of what it was at unfished conditions. However, changing this steepness parameter could also cause other parameters included in Table 1 to be estimated differently under some stock assessment methodologies. The point of all of this is to illustrate the importance of understanding what the stock-recruitment parameters mean. If we think juvenile survival doesn’t increase very much at low stock sizes (i.e., lesser steepness; Figure 4), we would generally expect a lower number of recruits at the same level of current spawning biomass than if we thought the steepness was greater (as it is hypothesized in Figure 5).
Summary
Stock-recruit relationships are legitimately confusing. Here is a quick summary:
- Populations of spawning fish can be reduced by quite a bit before we expect large reductions in recruitment.
- How reducing spawning populations changes recruitment varies among fish populations according to the specific stock-recruit function.
- Stock-recruit functions are defined in terms of parameters for how productive fish populations are at low abundances (recruitment compensation ratio or steepness), and the maximum recruitment possible (recruitment at unfished conditions)
- If stock recruit parameters were certain and had a good estimate of current spawning biomass, we could precisely describe how reductions in spawning biomass affect recruitment.
- Because usually we don’t have enough data to provide confident assessments of stock recruit relationships, most fish populations are managed by a proxy metric, spawning potential ratio (SPR).
- SPR describes how fishing-related mortality is reducing the amount of spawning fish, but it does not directly measure the proportion of spawning biomass remaining.
- Typical management measures aim to keep the SPR above 0.35, but this varies across species and populations.
- Recent stock assessments show that the northwest Florida spotted seatrout population is probably overfished, and low steepness indicates relatively weak recruitment compensation.
References
Addis, D., B. Mahmoudi, J. O’Hop, and R. Muller. 2018. “The 2016 Stock Assessment of Spotted Seatrout, Cynoscion nebulosus, in Florida.” Florida Fish and Wildlife Conservation Commission Florida Fish and Wildlife Research Institute, IHR number 2018-003. Available at: https://f50006a.eos-intl.net/ELIBSQL12_F50006A_Documents/IHR2018-003.Addis.2016SASS.pdf
Beverton, R. J., and S. J. Holt. 1957. “On the Dynamics of Exploited Fish Populations.” United Kingdom Ministry of Agriculture and Fisheries, Fishery Investigations, Series II, 19.
Goodwin, N. B., A. Grant, A. L. Perry, N. K. Dulvy, and J. D. Reynolds. 2006. “Life History Correlates of Density-Dependent Recruitment in Marine Fishes.” Canadian Journal of Fisheries and Aquatic Sciences 63 (3): 494–509. https://doi.org/10.1139/f05-234
Legault, C. M., and E. N. Brooks. 2013. “Can stock-recruitment points determine which spawning potential ratio is the best proxy for maximum sustainable yield reference points?” ICES Journal of Marine Science 70 (6): 1075–1080. https://doi.org/10.1093/icesjms/fst105
Myers, R. A., K. G. Bowen, and N. J. Barrowman. 1999. “Maximum Reproductive Rate of Fish at Low Population Sizes. Canadian Journal of Fisheries and Aquatic Sciences 56 (12): 2404–2419. https://doi.org/10.1139/f99-201
Walters, C. J., and S. Martell. 2004. Fisheries Ecology and Management. Princeton University Press, Princeton, New Jersey.