Introduction
Bell pepper is one of the most widely cultivated vegetable crops in the world. Characterized by a glossy exterior of different colors, bell pepper is a warm-season crop grown in temperate regions. Since 2000, the world production and consumption of bell peppers have been steadily increasing. More than 70% of the world's bell peppers are produced in Asia (FAO 2017). China is the largest producer of bell peppers, followed by Mexico and Indonesia. The other major players in the bell pepper market are Spain, Turkey, and the United States.
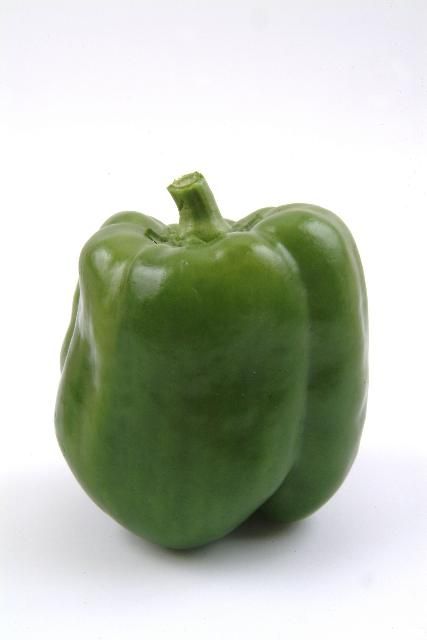
US Bell Pepper Production
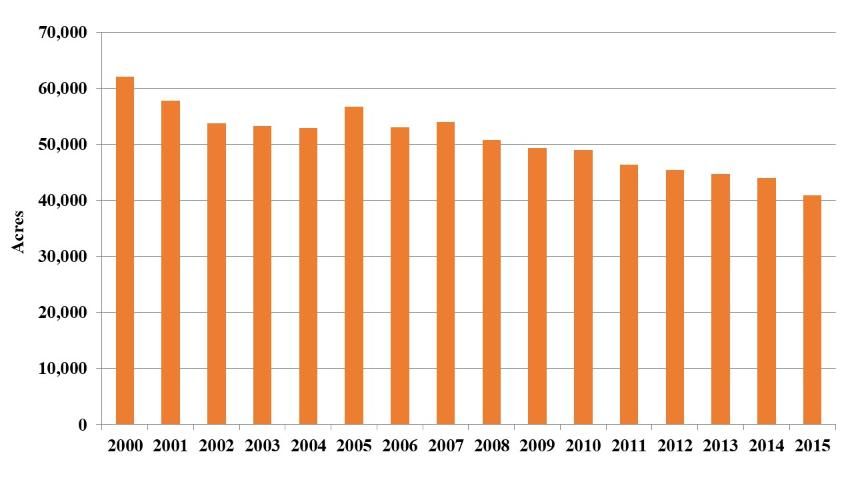
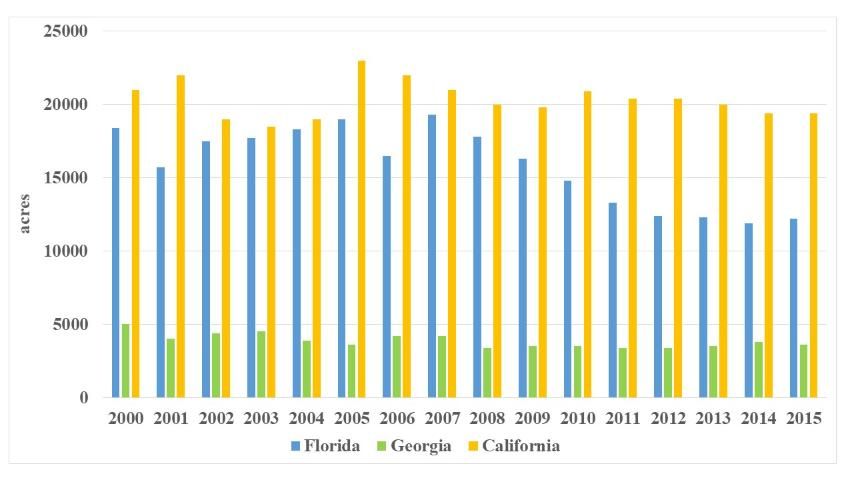
Bell peppers are widely grown all over the United States. The majority of bell peppers are produced in the open field on raised beds using drip irrigation and mulch. The US total harvested bell pepper acreage decreased from 62,080 acres in 2000 to 40,900 acres in 2015 (Figure 1). California, Florida, and Georgia are the three largest bell-pepper-producing US states (Figure 2). Bell pepper acreage in Florida has shown a prominent declining trend due to increased market competition from Mexico and the phase-out of methyl bromide soil fumigant. The harvested acreage in Florida declined from 18,400 acres in 2000 to 12,200 acres in 2015. California's harvested acreage declined from 21,000 acres in 2000 to 19,500 acres in 2015. The harvested acreage in Georgia remained relatively stable between 2000 and 2015.
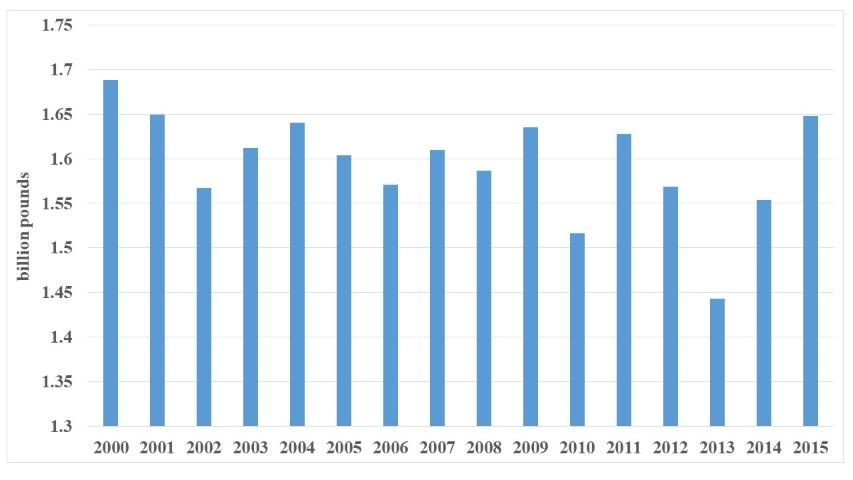
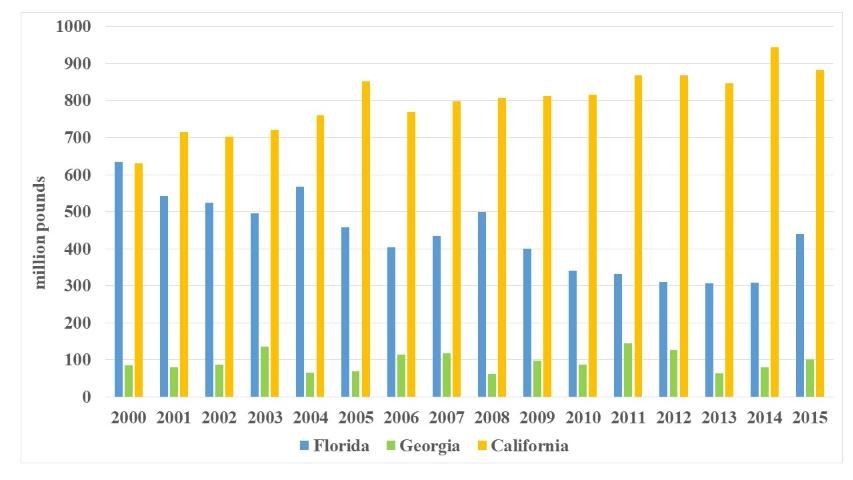
Total US bell pepper production was 1.65 billion pounds in 2015 (Figure 3). Production of bell pepper has been a major economic contribution to the vegetable industry in Florida and California. While Florida and California produced similar amounts of bell peppers in 2000, California produced twice as much as Florida in 2015 (Figure 4). The decreasing production in Florida is consistent with its declining acreage. Production in Georgia is significantly lower compared with California and Florida.
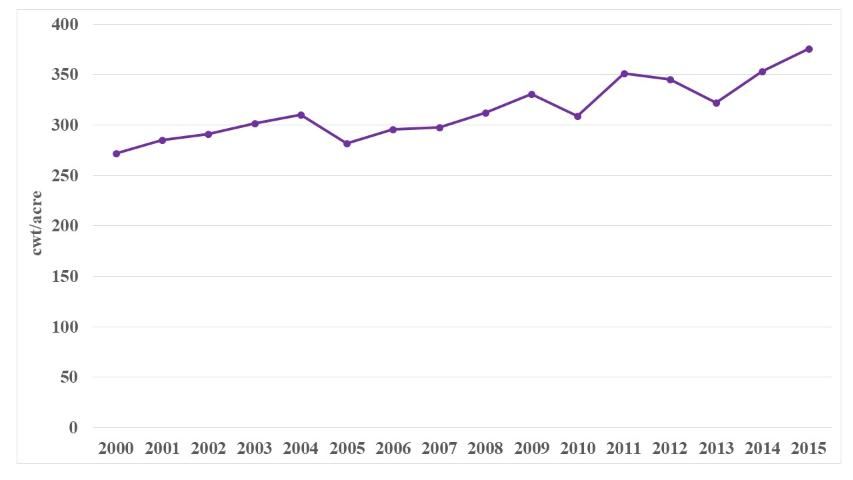
US bell pepper yield followed a steady increasing trend. In 2000, around 272 hundredweight (cwt) of bell peppers were produced per acre. In 2015, the value increased to 376 cwt per acre (Figure 5). Although yield in all three states has shown upward trends, the yield increase in Florida was significantly behind California and Georgia. The yield in Florida (360 cwt per acre), California (455 cwt per acre), and Georgia (280 cwt per acre) were up 4%, 52%, and 65% from their respective averages in 2000.
US Bell Pepper Prices
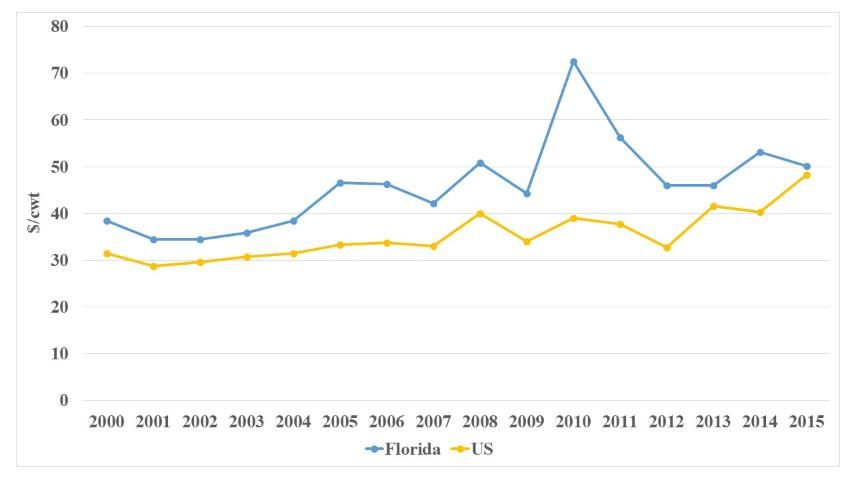
Bell pepper prices in the United States fluctuated between 2000 and 2015 due to factors such as increasing import competition from Mexico. Figure 6 shows the movement of prices of fresh bell peppers in the United States and Florida between 2000 and 2015. The US bell pepper price followed a slow increasing trend. The price in 2015 was $48.3 per cwt, up from $31.5 per cwt in 2000. The Florida average price was higher than the national average because of its early production season. A price spike of Florida bell peppers occurred in 2010 (Figure 6) as supplies were reduced by an unusually long period of freezing events.
US Bell Pepper Trade
Although the United States is one of the largest producers of bell peppers in the world, imports comprise a large portion of total US consumption of bell peppers. In 2000, the total import was only 436 million pounds, but it increased more than threefold to 1,421 million pounds in 2015 (Figure 7). The majority of bell pepper imports to the United States come from Mexico, which is the second largest producer of bell peppers worldwide. Imports from Mexico accounted for about 72% of total bell pepper imports to the United States in 2000, and 87% in 2015. Lower labor costs, the devaluation of the Mexican peso, and Mexican government support have given Mexican exporters a competitive edge over their US counterparts (Wu, Guan, and Garcia-Nazariega 2017; Victoria, van der Valk, and Elings 2011). Production under protection structures in Mexico has extended its growing season, allowing it to supply bell peppers to the US market year-round.
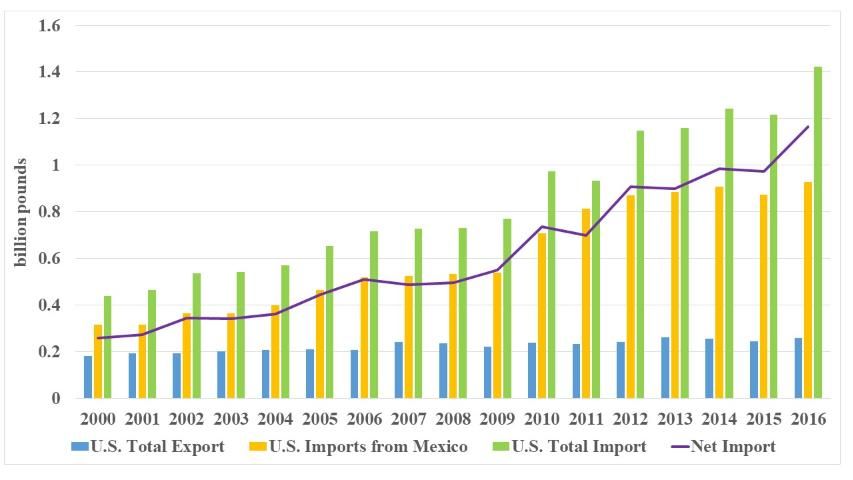
US bell pepper exports are significantly lower than imports. Since 2000, US bell pepper exports have been relatively stable. US bell pepper export volume, which was approximately 180 million pounds in 2000, increased to 256 million pounds in 2016. The main export destinations include Canada, Germany, Japan, and the United Kingdom.
Concluding Remarks
This article provides an overview of the US bell pepper industry. The total acreage of the US bell pepper industry has decreased by one-third since 2000. The declining trend is most significant for the Florida bell pepper industry. Competition from Mexico and various production challenges are among the main reasons. NAFTA and the popularity of protected culture promoted by the Mexican government have contributed to the rapid growth of the Mexican bell pepper industry and its market share in the US market. Bell pepper imports from Mexico increased threefold between 2000 and 2015. Increasing market competition and production costs have affected the profitability of US growers, particularly that of Florida growers. The same pattern has been observed in other fruit and vegetable industries in the United States, such as the strawberry (Guan et al. 2017; Suh, Guan, and Khachatryan 2017) and tomato industries (Guan, Biswas, and Wu, 2017; Wu, Guan, and Suh 2017).
References
Food and Agriculture Organization of the United Nations Statistics. 2017. FAOSTAT Database. https://www.fao.org/faostat/en/#home
Guan, Z., T. Biswas, and F. Wu. 2017. The U.S. Tomato Industry: An Overview of Production and Trade. FE1027. Gainesville, FL: University of Florida, Institute of Food and Agricultural Sciences.
Guan, Z., D.H. Suh, H, Khachatryan, and F. Wu. 2017. Import Growth and the Impact on the Florida Strawberry Industry. FE1022 Gainesville, FL: University of Florida, Institute of Food and Agricultural Sciences.
Suh, D.H., Z. Guan, and H. Khachatryan. 2017. "The Impact of Mexican Competition on the U.S. Strawberry Industry." International Food and Agribusiness Management Review 20: 591–604. https://doi.org/10.22434/IFAMR2016.0075
US-DOC (United States Department of Commerce). 2017. US-DOC Website. US-DOC, Washington, DC. https://www.commerce.gov/
USDA-AMS (United States Department of Agriculture, Agricultural Marketing Service). 2017. Fruits and Vegetables Market News. USDA-AMS, Washington, DC. http://www.ams.usda.gov/market-news/fruits-vegetables.
USDA-FAS (United States Department of Agriculture, Foreign Agricultural Service). 2017. USDA-FAS Website. USDA-FAS, Washington, DC. https://www.fas.usda.gov/
Victoria, N.G., O.M.C. van der Valk, and A. Elings. 2011. Mexican Protected Horticulture: Production and Market of Mexican Protected Horticulture Described and Analysed (No. 1126). Wageningen UR Greenhouse Horticulture/LEI, Wageningen, The Netherlands.
Wu, F., Z. Guan, and M. Garcia-Nazariega. 2017. Comparison of Labor Costs between Florida and Mexican Strawberry Industries. FE1023. Gainesville, FL: University of Florida, Institute of Food and Agricultural Sciences.
Wu, F., Z. Guan, and D.H. Suh. 2018. The Effects of Tomato Suspension Agreements on Market Price Dynamics and Farm Revenue. Applied Economic Perspectives and Policy. Forthcoming. https://doi.org/10.1093/aepp/ppx029