Introduction
This article summarizes ornamental plant producers’ current production practices with a specific emphasis on their use of neonicotinoid and non-neonicotinoid insecticides. It is important for relevant stakeholders to understand producers’ current pest management practices, while transferring knowledge and making more relevant research recommendations. The target audience includes industry, state agency, and public stakeholders involved in decisions and policy making related to the use of neonicotinoid insecticides in the US ornamental plants industry. The study aims to provide useful information for policy makers assessing the potential impact of policy interventions on the economic feasibility of pest management in the ornamental horticulture industry.
Insecticide Use and Regulation: Key Topic for Ornamental Horticulture Industry
The ornamental horticulture industry provides important economic contributions to the US agricultural sector. The 2018 US Green Industry economic impacts (including indirect and induced effects in other sectors) were estimated at $348 billion in output or revenues and 2.32 million total jobs (Hodges et al. 2019). In 2018, the total production area of greenhouse operations (including glass, rigid plastic, and film plastic greenhouses) reached 423,013,000 square feet, and the total production area of open ground reached 38,358 acres (USDA NASS 2019). However, in recent years, greenhouse and nursery producers in the ornamental horticulture industry have experienced diminishing revenue and shrinking profit margins due to considerable within-industry consolidation, increased competition, and relatively weak consumer demand (Madigan 2018). The demand for ornamental plants is highly elastic (Hovhannisyan and Khachatryan 2016) because ornamental plants are often perceived as luxury products (International Association of Horticulture Producers 2019; Schimmenti et al. 2013).
The use of pesticides to maintain plant quality represents a significant strategy for ornamental producers to stay competitive. Neonicotinoids represent the most effective insecticides for control of insect pests such as aphids and whiteflies (Jeschke and Nauen 2008; Jeschke et al. 2011). Even though neonicotinoid active ingredients were primarilysold in crop-use products (93%), the remainder were mostly absorbed in the ornamental industry: 4% sold in turf/ornamental, 1.4% in household pest control, and 1.2% in lawn/garden (Douglas and Tooker 2015). Meanwhile, a recent trend to impose more restrictive labeling policies by retail stores on pesticide use (i.e., disclosing the use of neonicotinoids) may impact producers’ production costs even further. Maintaining low-cost and competitive production practices thus has become increasingly important for nursery and greenhouse producers to stay profitable. While the EU regulators extended the ban on three major neonicotinoidsto a total ban of neonicotinoid use in outdoor fields in 2018,most recent studies have revealed that the EU’s ban on neonicotinoids has caused a yield decrease (Dewar 2016; Noleppa 2017) and increase of production costs (Noleppa 2017). Banning neonicotinoids has forced farmers to use alternative means of pest control which may have unintended consequences such as pest resistance. Jactel et al. (2019) showed that the most common alternative to neonicotinoid insecticides is the use of another chemical insecticide (89% of cases). Nonetheless, other chemical insecticides are not necessarily safer for the environment. Furthermore, alternative pest management methods may not always match neonicotinoids in terms of efficacy, applicability, durability, and/or practicability. For example, Furlan and Kreutzweiser (2015) pointed out that widespread adoption of integrated pest management (IPM) approaches to insect pest management is particularly challenging when the use of neonicotinoid insecticides is large-scale and often prophylactic. IPM generally requires more labor and time and is managerial-intensive and information-extensive (Allahyari et al. 2017; Beckmann et al. 2009; Fernandez-Cornejo et al. 1994; Jones et al. 2009). The information about the current use of neonicotinoids (i.e., scale of use, frequency of use, application method) can help the policy makers to form a better prediction of the potential impact on the ornamental industry.
Survey of Ornamental Plants Producers
To investigate the use of neonicotinoid insecticides in the ornamental plants industry and producer perceptions of insecticide labeling, we conducted a bimodal national survey. Internet and mail surveys were conducted to collect a representative nationwide sample. The Internet survey (conducted from August to December, 2018), was distributed through horticultural industry associations’ member lists and trade magazine websites (e.g., Florida Nursery, Landscaping and Growers Association, Nursery Management magazine, Greenhouse Grower magazine). One hundred sixty-four producers from 49 states completed the Internet survey. Following the Internet survey distribution, 3,000 printed surveys were mailed to randomly selected producers. Twelve states (California, Florida, Hawaii, Illinois, Maryland, New Jersey, New York, North Carolina, Ohio, Pennsylvania, Texas, and Washington) were selected based on the USDA 15-state data collection program that includes major ornamental production states. Tennessee, North Dakota, Wisconsin, and Vermont were selected to represent other miscellaneous production states. Two hundred sixty producers responded to the mail survey, representing less than a 10% response rate. After excluding small-scale producers employing fewer than five employees, and producers with significant missing information, 166 responses were used in the final sample. This report used responses from 86 Internet and 80 mail survey participants (Table 1). Table 2 summarizes the distribution of the 166 producers by primary location of business. As expected, California and Florida have the highest response rate given the size of the ornamental plants industry relative to other states.
Survey Results: Producer Characteristics
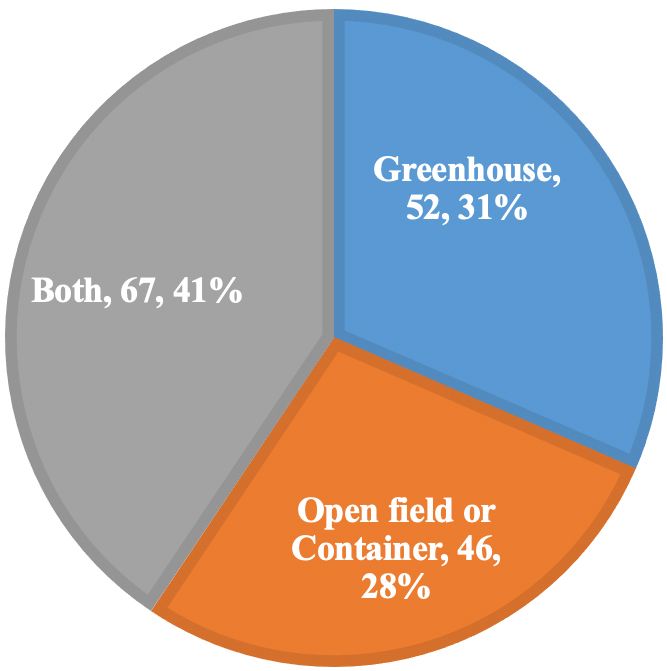
Among the 166 producers, 52 (31%) were only using greenhouses in their operations, 46 (28%) were operating open field or containers, and 67 (41%) had both types of operations (). The median and average production area in the year prior to the survey were 99,500 square feet and 200,249 square feet for greenhouse operations only, 20 acres and 230 acres for open-field or container operations only, and 304,920 square feet (7 acres) and 703,037,704 square feet (70 acres) for producers with both production types (Table 3). Using the production area information reported in the Floriculture Crops 2018 Summary (USDA NASS 2019), we estimated that the average greenhouse production area would be less than 100,000 ft2 for operations with a sales value of at least $10,000 and 200,000 ft2 for operations with a sales value of $100,000 or more. The average production area for open field is about 9 acres for operations with a sales value of at least $10,000 and less than 20 acres for operations with a sales value of $100,000 or more (Table S1 in Appendix). These average areas are close to the median production areas reported by our survey respondents, indicating the representativeness of our sample.
Credit: UF/IFAS Mid-Florida Research and Education Center
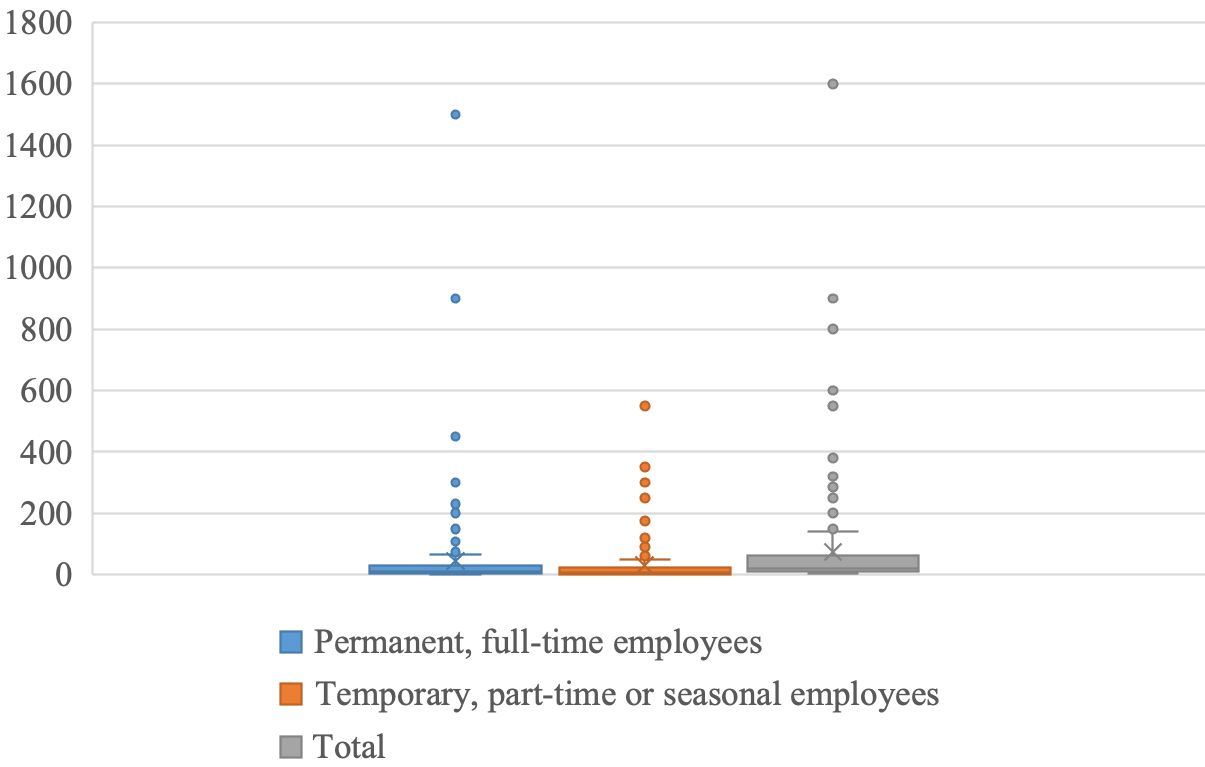
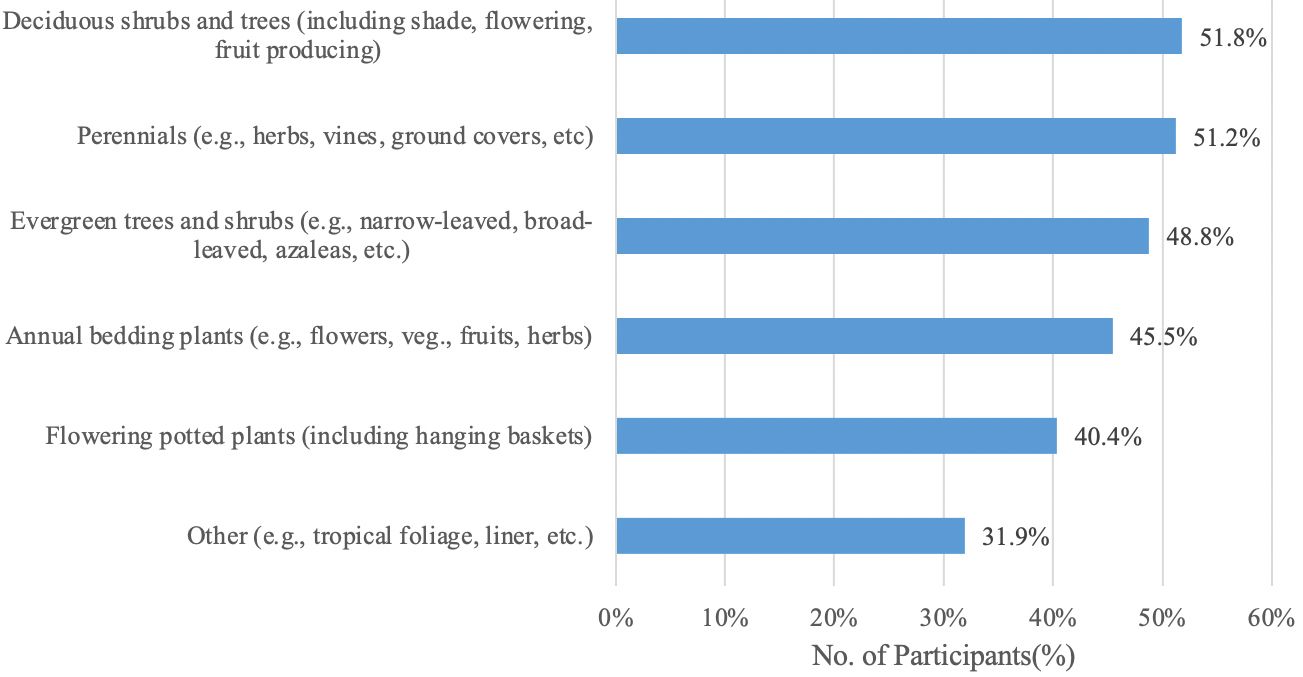
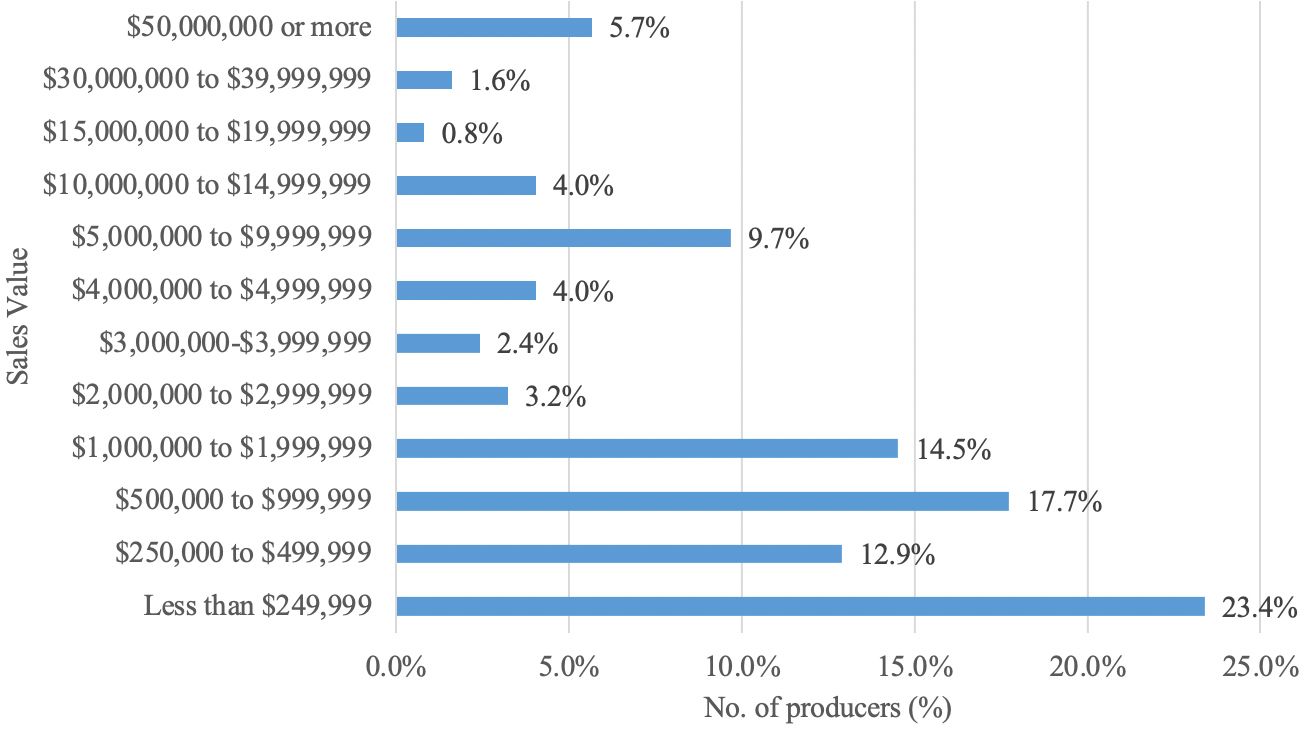
The average number of permanent (full-time) employees per firm was 44, and the average number of temporary (part-time) employees was 30 (Figure 2). Ornamental producers usually grow multiple plant types. Figure 3 summarizes the distribution of major ornamental plant types (as the share of total sales) reported by producers. The top plant category reported by the surveyed producers was deciduous shrubs and trees (including shade, flowering, and fruit-producing trees). Fifty-two percent of surveyed producers indicated handling of deciduous shrubs and trees, followed by perennials (e.g., herbs, vines, ground covers, etc.) which were reported by 51% of the surveyed producers. The next three largest plant categories were evergreen trees and shrubs, flowering potted plants (including hanging baskets), and annual bedding plants (e.g., flowers, vegetables, fruits, herbs), accounting for 49%, 46%, and 40%, respectively. One hundred twenty-four producers reported annual sales values for the year prior to the survey (Figure 4). Twenty-three percent of the producers reported their annual sales as less than $249,999 and 13% reported annual sales between $250,000 and $499,999. Only 12.1% of the producers reported annual sales greater than $10,000,000.
Credit: UF/IFAS Mid-Florida Research and Education Center
Credit: UF/IFAS Mid-Florida Research and Education Center
Credit: UF/IFAS Mid-Florida Research and Education Center
Pesticide Application Methods
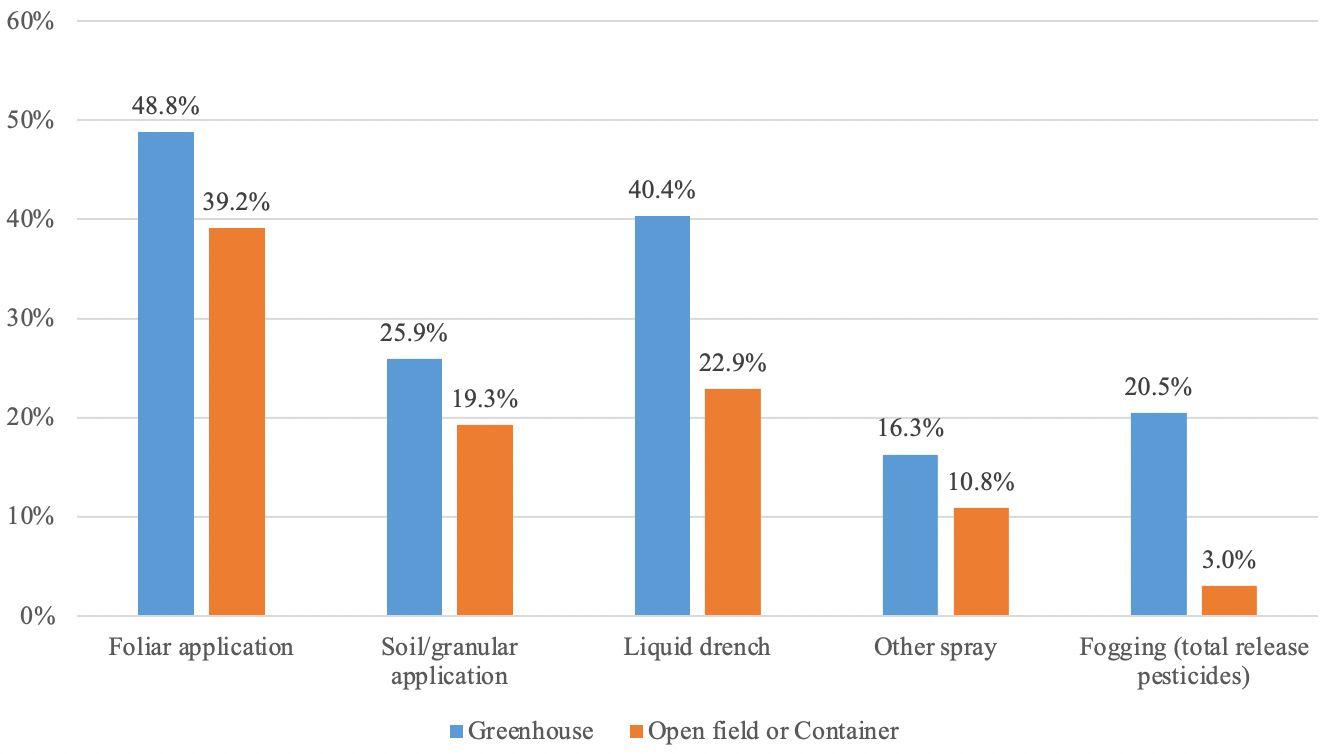
Pesticide application methods are summarized in Figure 5. Application methods vary by delivery method and type of pesticide used. In this study, the application options included foliar applications, soil/granular, liquid drench, fogging, and other sprays. In foliar applications, the pesticide is applied directly to the leaves. In soil/granular applications, the pesticide is spread on top of the growing media whereas the liquid drench delivers the pesticide to the root area in liquid form. Fogging is when the pesticide is converted to a fog (via a fogger machine) and dispersed throughout a greenhouse (this needs to be used in a closed structure). Foliar application was reported as the most commonly used pesticide application method in both greenhouse and open-field or container production systems. Forty-nine percent of the greenhouse producers and 39% of the open-field or container producers reported use of foliar application methods. Liquid drench and soil/granular applications were the next most widely used pesticide application methods, followed by other spray and fogging. Consistent with the study by Nebraska Extension at University of Nebraska–Lincoln (2016), our survey participants confirmed that neonicotinoids are often applied by topical foliage sprays, granular soil incorporation, or as a liquid soil drench.
Credit: UF/IFAS Mid-Florida Research and Education Center
Use of Neonicotinoid Insecticides
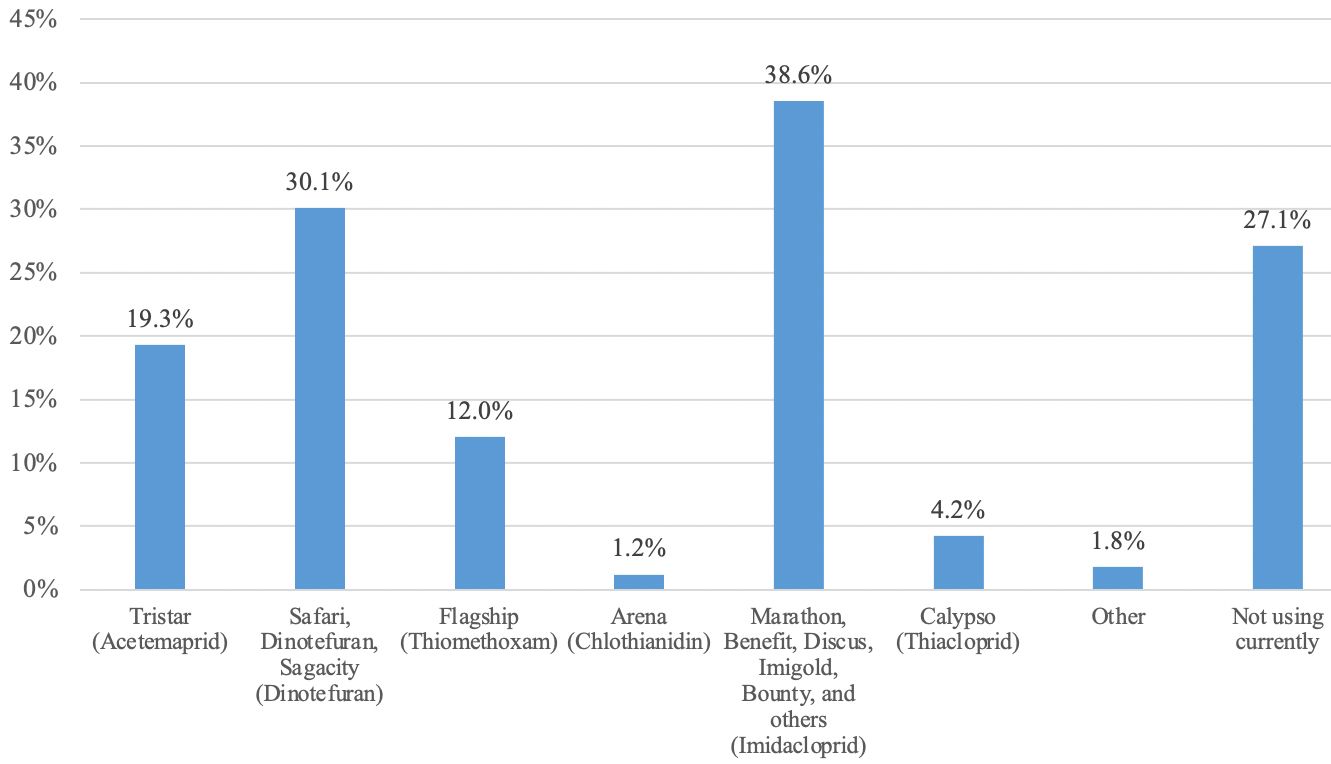
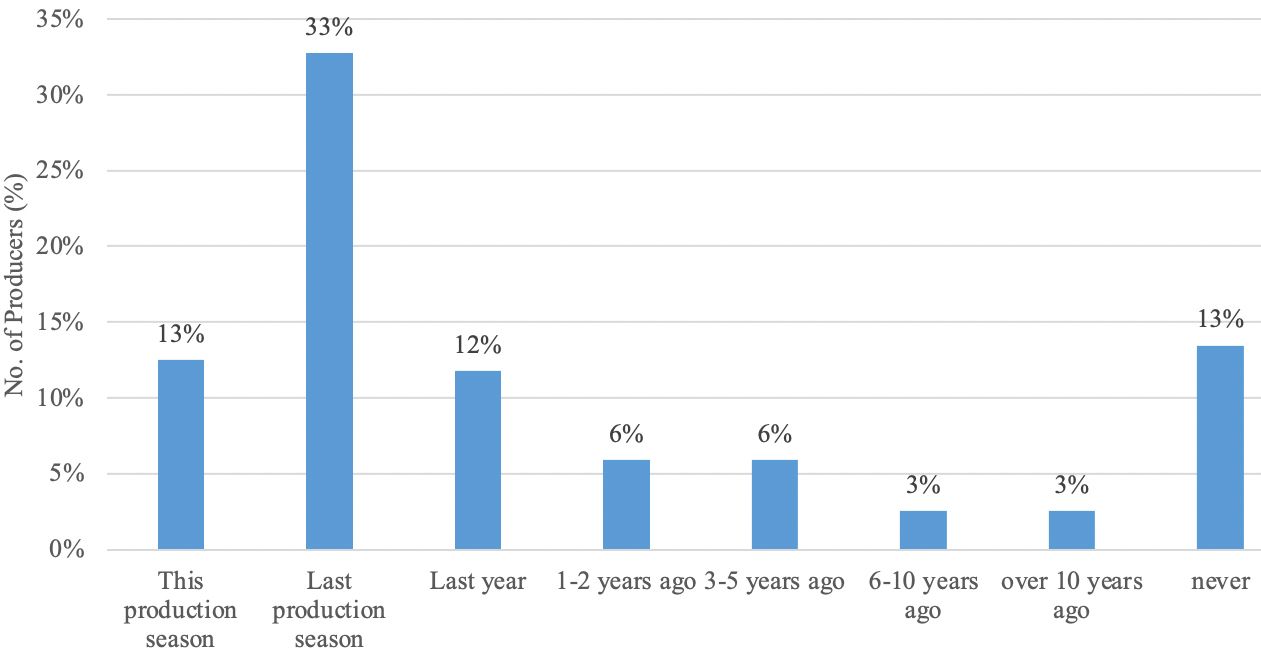
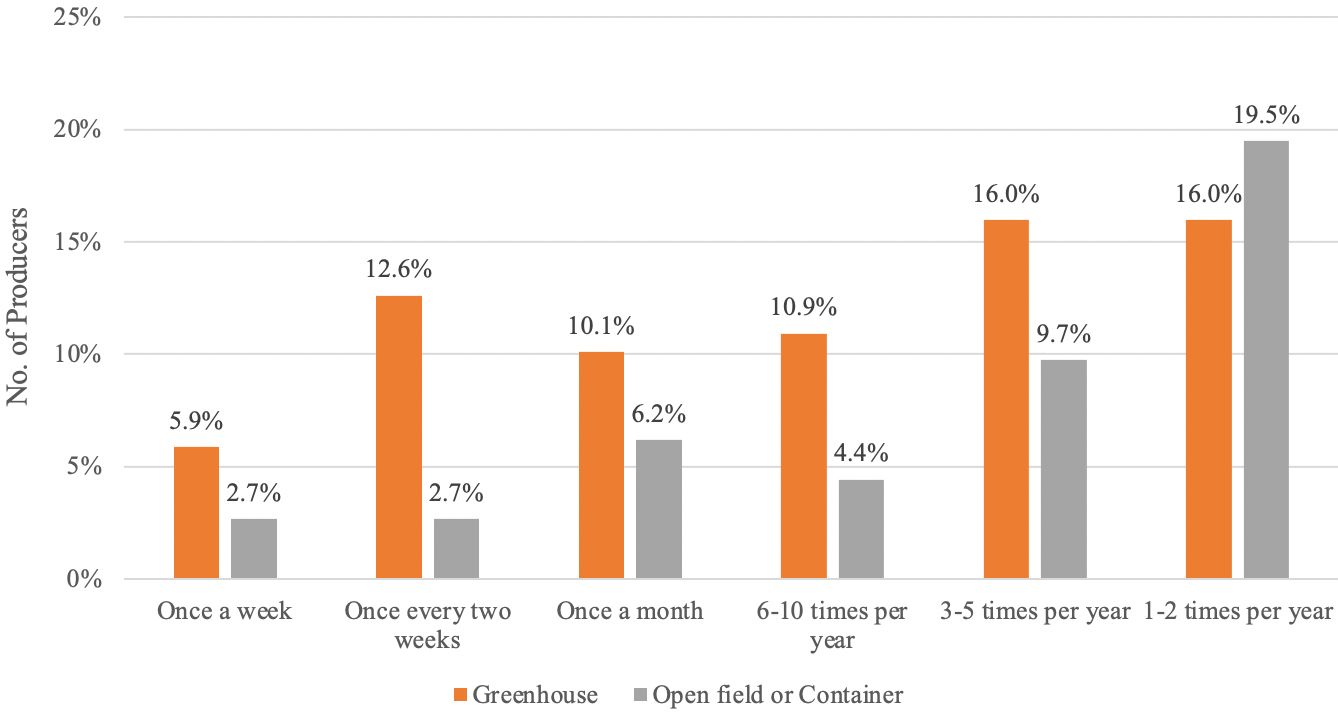
Surveyed producers reported various types and brands of neonicotinoid insecticides they are currently using (Figure 6). Results were consistent with the 2009 Nursery and Floriculture Chemical Use Survey (USDA NASS 2011). Specifically, Imidacloprid (brands such as Marathon, Benefit, Discus, Imigold, and Bounty) was the most popular neonicotinoid insecticide used by surveyed producers. Thirty-nine percent reported using Imidacloprid. Thirty percent of surveyed producers reported using Dinotefuran (e.g., Safari, Dinotefuran, Sagacity), followed by Acetemaprid (19%), Thiomethoxam (12%), and Thiacloprid (4.2%). Forty-five producers (27%) indicated they are not currently using any types of neonicotinoid insecticides. We further asked producers to identify the last time they used neonicotinoid insecticides. As shown in Figure 7, sixty-nine producers (46%) reported they used neonicotinoid insecticides in this or the previous production season. Fourteen producers (12%) used them within the previous year. About 6% used neonicotinoid insecticides at least 1–2 years ago. Sixteen producers (13%) reported that they never used neonicotinoid insecticides. Producers also indicated the frequency of application (Figure 8). In general, producers with greenhouse operations showed higher application frequencies than those with open-field or container operations. Compared to open-field or container operations, greenhouses produce all year round, meaning pest pressure may be extended with the growing season and require treatment. In addition, conditions in greenhouses are often conducive to outbreaks of arthropod pests and plant disease that require excessive use of insecticides (Osman et al. 2011).
Credit: UF/IFAS Mid-Florida Research and Education Center
Credit: UF/IFAS Mid-Florida Research and Education Center
Credit: UF/IFAS Mid-Florida Research and Education Center
Use of Non-Neonicotinoids
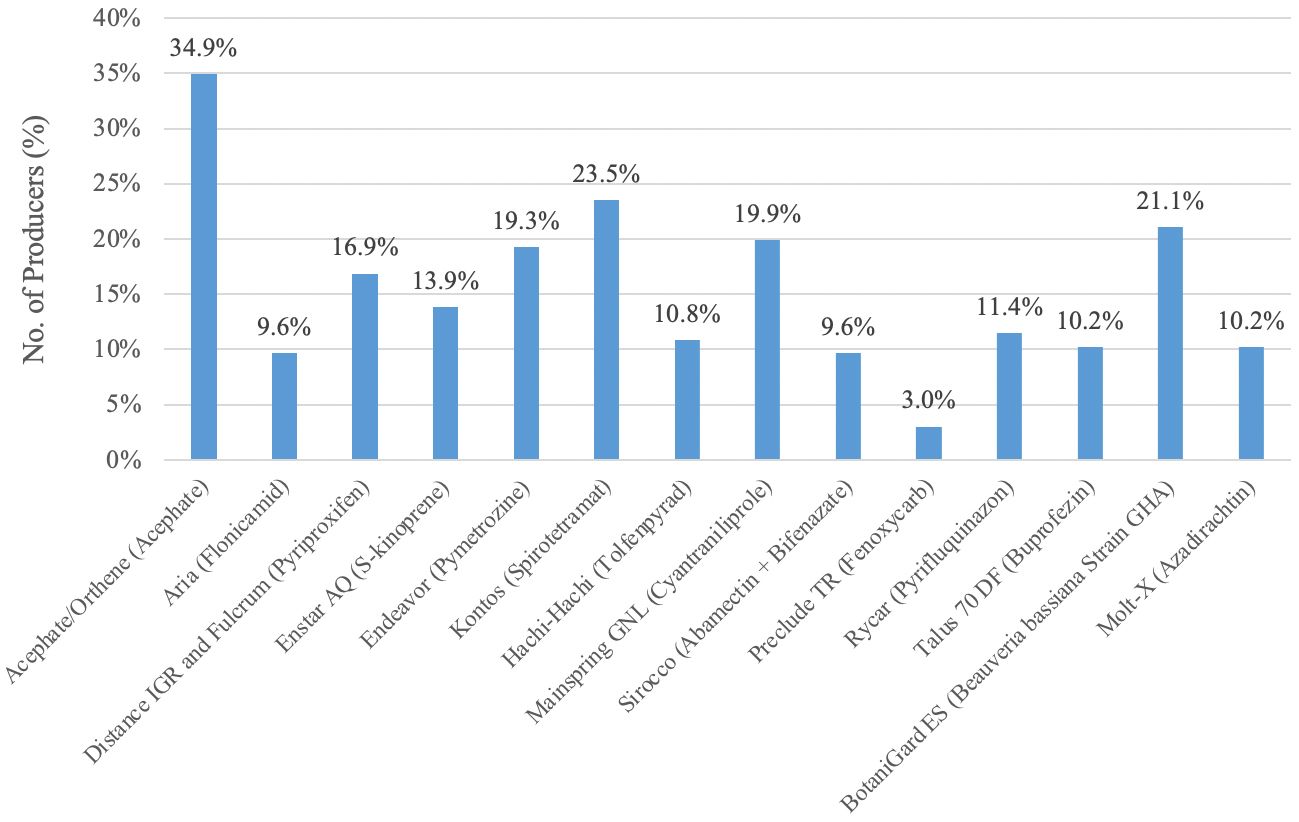
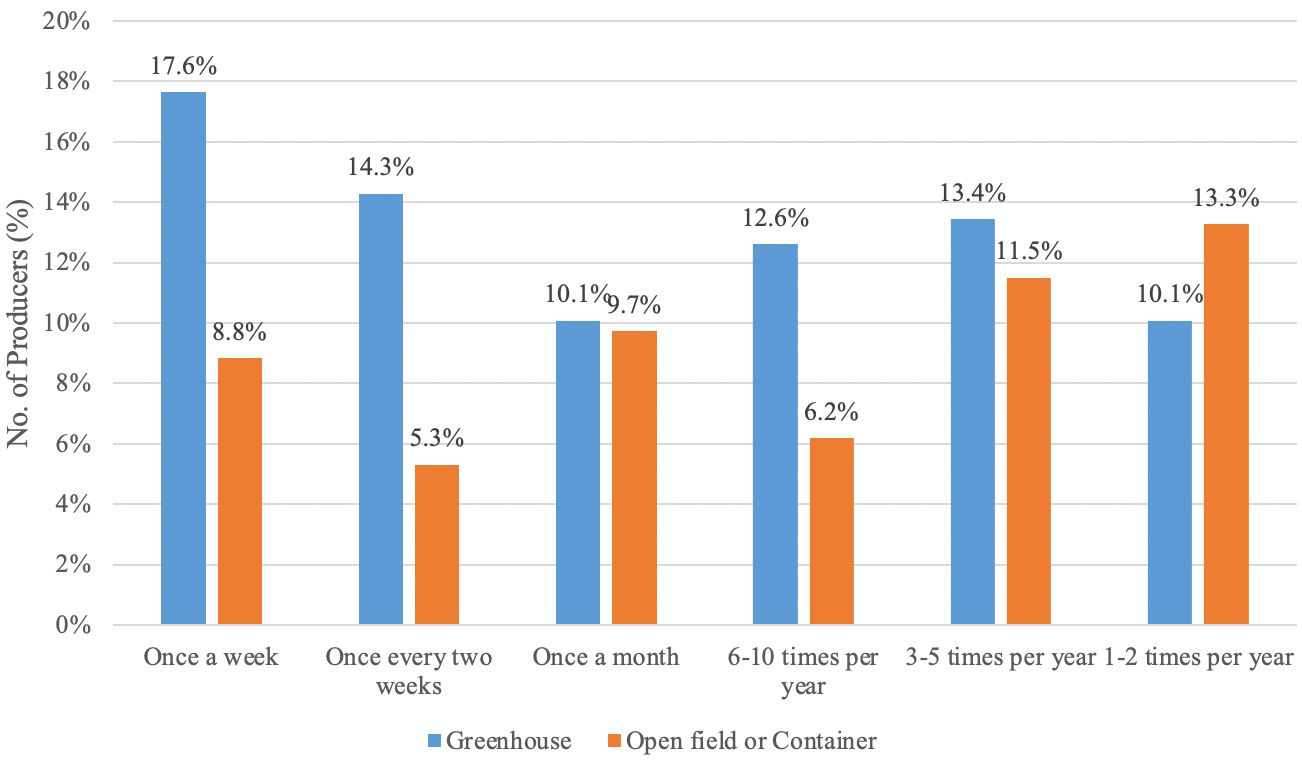
Producers also reported their use of non-neonicotinoid insecticides (Figure 9). Acephate/Orthene (Acephate), Konotos (Spirotetramat), BotaniGard ES (Beauveria bassiana Strain GHA), Mainspring GNL (Cyantraniliprole), Endeavor (Pymetrozine), and Distance IGR and Fulcrum (Pyriproxyfen) were the most widely used non-neonicotinoid brands reported by surveyed producers. Producers with greenhouse operations also showed higher non-neonicotinoid insecticide application frequencies than those with open-field or container operations (Figure 10).
Credit: UF/IFAS Mid-Florida Research and Education Center
Credit: UF/IFAS Mid-Florida Research and Education Center
Conclusion
This study reported detailed information on the current status of neonicotinoid use by greenhouse and nursery producers, which provides useful information for policy makers assessing the potential impact of policy interventions on the economic feasibility of pest management in the ornamental horticulture industry. Our survey showed that a large number of producers (46% of the sample) reported they used neonicotinoid insecticides in this or the previous production season. Although seed coating with neonicotinoids is widely performed for field crops, it is not used on the seeds of ornamental plants. Our study suggested that foliar is the most commonly used application method in both greenhouse and open-field or container production systems. Therefore, a ban on the outdoor use of neonicotinoids can have significant implications for the industry. At the same time, opportunities may exist to replace neonic insecticides with non-neonic insecticides. Additional analysis of cost and effectiveness of the two types of insecticides is needed to fully evaluate the restrictions on use of neonicotinoids.
References
Allahyari, M. S., C. A. Damalas, and M. Ebadattalab. 2017. “Farmers’ Technical Knowledge about Integrated Pest Management (IPM) in Olive Production.” Agriculture 7(12): 101.
Beckmann, V., E. Irawan, and J. Wesseler. 2009. “The Effect of Farm Labor Organization on IPM Adoption: Empirical Evidence from Thailand.” Institutional Change in Agriculture and Natural Resources Discussion Papers 55767. Berlin: Humboldt University of Berlin, Department of Agricultural Economics.
Douglas, M. R, and J. F. Tooker. 2015. “Large-scale deployment of seed treatments has driven rapid increase in use of neonicotinoid insecticides and preemptive pest management in U.S. field crops.” Environmental Science &Technology 49(8): 5088–5097.
Fernandez-Cornejo, J., E. D. Beach, and W. Huang. 1994. “The Adoption of IPM Techniques by Vegetable Growers in Florida, Michigan and Texas.” Journal of Agriculture and Applied Economics 26(01): 158–172.
Furlan, L., and D. Kreutzweiser. 2015. “Alternatives to Neonicotinoid Insecticides for Pest Control: Case Studies in Agriculture and Forestry.” Environmental Science and Pollution Research 22:135–147.
Hodges, A. W., H. Khachatryan, C. R. Hall, and M. A. Palma. 2019. “Executive Summary of Economic Contributions of the Green Industries in the United States in 2018.” AmericanHort.
Hovhannisyan, V., and H. Khachatryan. 2016. “Ornamental Plants in the United States: An Economic Analysis of Household-Level Demand System.” Agribusiness: An International Journal 33(2): 226–241.
International Association of Horticultural Producers (AIPH). 2019. “Ornamental Horticulture – A Growing Industry.” The International Vision Project, IVP Report. Accessed on January 22, 2019. www.aiph.org
Jeschke, P., and R. Nauen. 2008. “Neonicotinoids—From Zero to Hero in Insecticide Chemistry.” Pest Management Science 64:1084–1098.
Jeschke, P., R. Nauen, M. Schindler, and A. Elbert. 2011. “Overview of the Status and Global Strategy for Neonicotinoids.” Journal of Agricultural and Food Chemistry 59:2897–2908.
Jones, V. P., T. R. Unruh, D. R. Horton, N. J. Mills, J. F. Brunner, E. H. Beers, and P. W. Shearer. 2009. “Tree Fruit IPM Programs in the Western United States: The Challenge of Enhancing Biological Control through Intensive Management.” Pest Management Science 65(12): 1305–1310.
Madigan, J. 2018. “Plant & Flower Growing in the US.” IBISWorld Industry Report 11142.
Nebraska Extension at University of Nebraska–Lincoln. 2016. “Neonicotinoid Insecticides – Pollinators, Plants and Your Garden.” Accessed on January 16, 2020. https://extension.unl.edu/statewide/cass/Neonictinoid%20Insecticides%20-%20Pollinators%2C%20Plants%20and%20Your%20Garden%20...%20August%2012%2C%202018.pdf
Osman, K. A., A. I. Al-Humaid, S. M. Al-Rehiayani, and K. N. Al-Redhaiman. 2011. “Estimated Daily Intake of Pesticide Residues Exposure by Vegetables Grown in Greenhouses in Al-Qassim Region, Saudi Arabia.” Food Control 22(6): 947e953.
Schimmenti, E., A. Galati, V. Borsellino, C. Ievoli, C. Lupi, and S. Tinervia. 2013. “Behaviour of Consumers of Conventional and Organic Flowers and Ornamental Plants in Italy.” HortScience 40(4): 162–171.
USDA NASS. 2011. 2009 Nursery and Floriculture Chemical Use. Washington, D.C.: United States Department of Agriculture, National Agricultural Statistics Service (USDA/NASS).
USDA NASS. 2019. Floriculture Crops 2018 Summary. Washington, D.C.: United States Department of Agriculture, National Agricultural Statistics Service (USDA/NASS).
Table 1. Number of respondents by survey type.
Table 2. Distribution of respondents by primary location of business.
Table 3. Production area by type of production system.
Appendix
Supplemental Table S1. National greenhouse average production area based on Floriculture Crops 2018 Summary (USDA NASS 2019).