Project Description
This report is the third in a series from the Sustainable Residential Landscape Project. The Sustainable Residential Landscape Project encompasses several studies with the purpose of addressing Floridians’ perceptions of landscapes and key factors that influence their adoption of more sustainable landscaping practices, and recognizing ways to promote more sustainable landscaping options. This report is meant to provide green-industry stakeholders with a "snapshot" of their market. The project was funded by the UF/IFAS Center for Land Use Policy (previously, Center for Landscape Conservation and Ecology). The primary purpose of this project was to investigate the linkages between environmentally friendly features of residential landscapes and economic value added.
Urban sprawl has underscored the need for green areas in densely populated areas. From 2000 to 2010, U.S. urban areas increased to cover 3% of all U.S. landmass (U.S. Census Bureau 2015), and 80% of the total U.S. population lives in urban areas (Nowak et al. 2010). Multiple studies have demonstrated that landscapes and other green areas (e.g., parks) improve quality of life and provide many economic, health, and environmental benefits to homeowners and other community members (Hall and Dickson 2011; Hall and Knuth 2019a; Hall and Knuth 2019b). Sustainable residential landscapes are one way to provide these benefits but with reduced inputs (e.g., fertilizer, irrigation, pest controls, labor requirements, etc.). Reduced landscape inputs are desirable from an economic and environmental standpoint in that they cost less to maintain and reduce the likelihood of pollution from excess fertilizer runoff or leaching (Suh et al. 2017). Research suggests that homeowners are interested in plants that require fewer inputs (Yue, Hugie, and Watkins 2012). Before offering these options, it is important to understand the current marketplace for sustainable landscape plants. This report summarizes Floridian homeowners’ interest in and response to economic incentives to encourage the installation of more sustainable alternative residential landscapes based on a survey.
Traditional landscape options primarily consist of turfgrass with some non-turfgrass plant beds around the foundation of the home. More environmentally friendly landscapes often decrease the amount of turfgrass to reduce the fertilizer and irrigation needs of the landscape. For this survey, three alternative landscapes were presented: a 50% turfgrass and 50% non-turfgrass option; a 25% turfgrass and 75% non-turfgrass option; and 100% non-turfgrass option.
A Summary of Landscape Modification Incentive Programs
Previous research demonstrates that monetary incentives can be used to encourage water-efficient landscape installations. For instance, in Florida, Alachua County offers a 50% rebate up to $2,000 for residents to replace turfgrass with landscapes that require less water (Florida-Friendly LandscapingTM) (Alachua County Florida 2018). Similar programs have been implemented in California and Nevada. The California Water Commission has a program that pays homeowners $3.75 per square foot to replace turfgrass with drought-tolerant landscapes (Water Management District of Southern California 2017). The Water Smart Landscapes Rebate program of Las Vegas, NV, gives homeowners a $3.00 per square foot rebate for turfgrass replaced by desert landscaping (Southern Nevada Water Authority 2020). Note that not all conservation incentive programs are cost-effective. According to Addink (2008), the “Cash for Grass” rebate cost per square foot was $0.40 in Albuquerque, NV, while the total cost of the program including administrative expenses was estimated at $0.55. The rebate for a similar program cost $1.00 in El Paso, TX, while the estimated total cost of the program was $1.33. Therefore, understanding the effect of a rebate program on homeowners’ preferences is very important.
Project Objectives
The main objective of this report is twofold:
- Investigate Floridian homeowners’ perceptions of how maintained alternative landscapes influence property valuation.
- Assess if economic incentives could be used to encourage installation of environmentally friendly alternative landscapes (e.g., Florida-Friendly Landscapes).
To address these objectives, an online survey was administered to 610 Florida homeowners in 2016. Only people who live in a single-family house with an irrigated landscape were selected to participate in the study. The survey consisted of several sections that contained questions related to the project objectives. Upon completion of the survey, respondents were given online reward points as an incentive.
This report summarizes homeowners’ perceptions of economic benefits associated with alternative landscape designs. The results are of particular interest to the landscape industry, Extension agents, and other individuals interested in aiding homeowners with residential landscape management.
Who participated in the study?
- Sample size: 610 participants
- Average age: 51 years old
- Gender: 59% female
- Education: 51% had a four-year college degree or higher.
- 2015 household income:
- 20% had an income less than $40,000.
- 54% had an income between $40,000 and $99,999.
- 26% had an income greater than $99,999.
- Household size: 65% of households consisted of 2 adults.
- Children in household: 68% had 0 children living in their homes.
- Landscape maintenance responsibilities:
- 60% maintained their own landscapes.
- 40% hired landscaping companies.
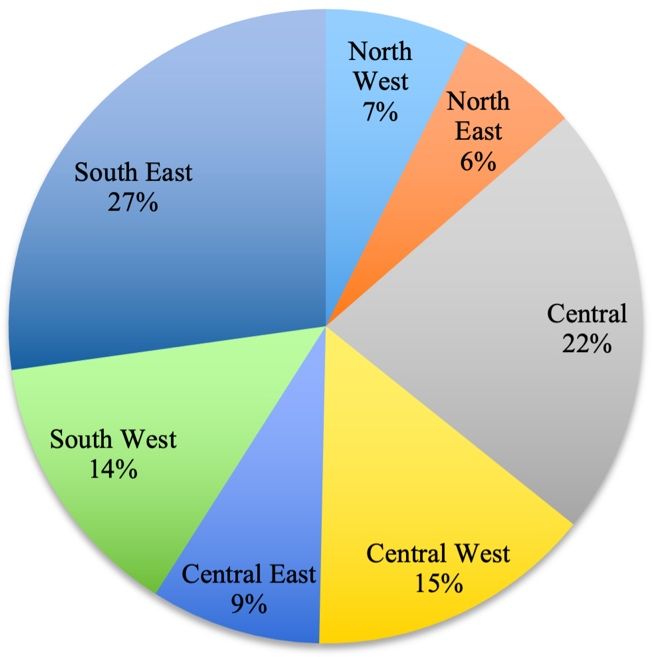
- Geographical location: Figure 1 shows the geographic distribution of participants.
Credit: UF/IFAS
Results
Property Value
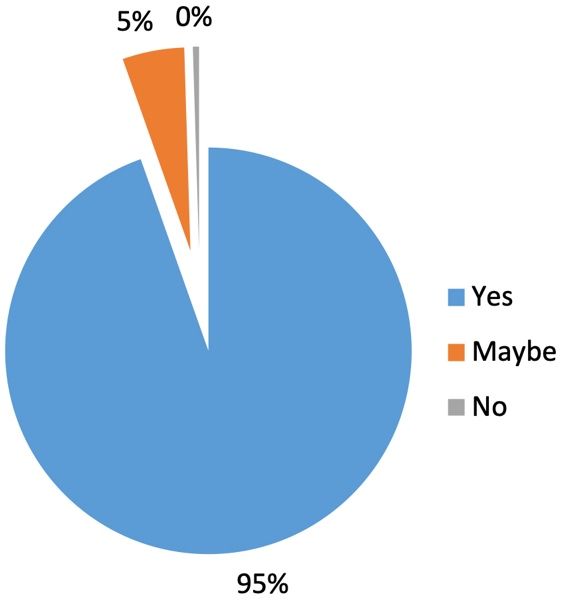
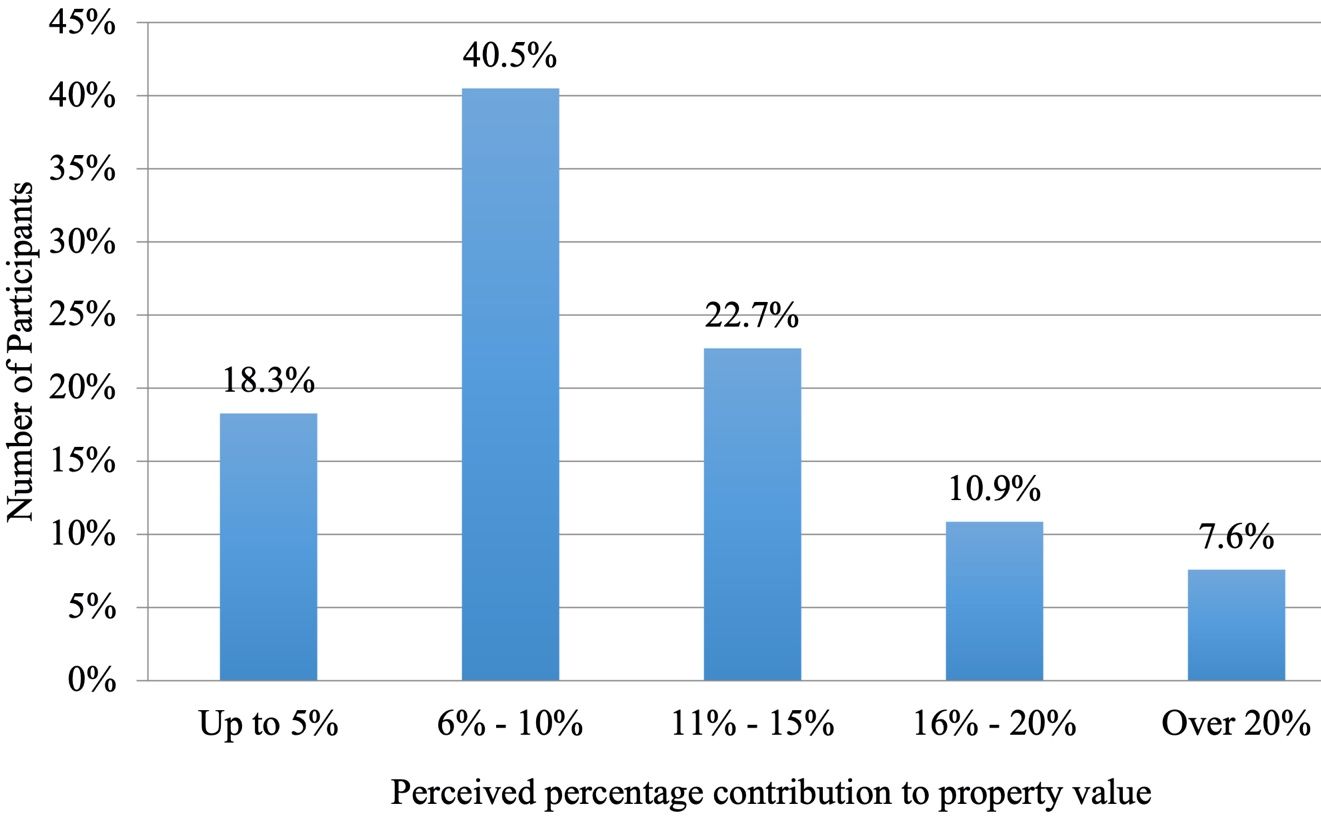
Most participants (95%) indicated that a well-maintained landscape improves a property’s value (Figure 2). Nearly 41% of the sample perceived a well-maintained landscape as adding 6%–10% to the property’s value, followed by 23% believing the landscape adds 11%–15%. Eighteen percent thought it increased value up to 5%, 11% viewed the value as increasing from 16%–20%, and nearly 8% considered value added over 20% (Figure 3). On average, participants expected a 23% return-on-investment for their landscape investments.
Credit: UF/IFAS
Credit: UF/IFAS
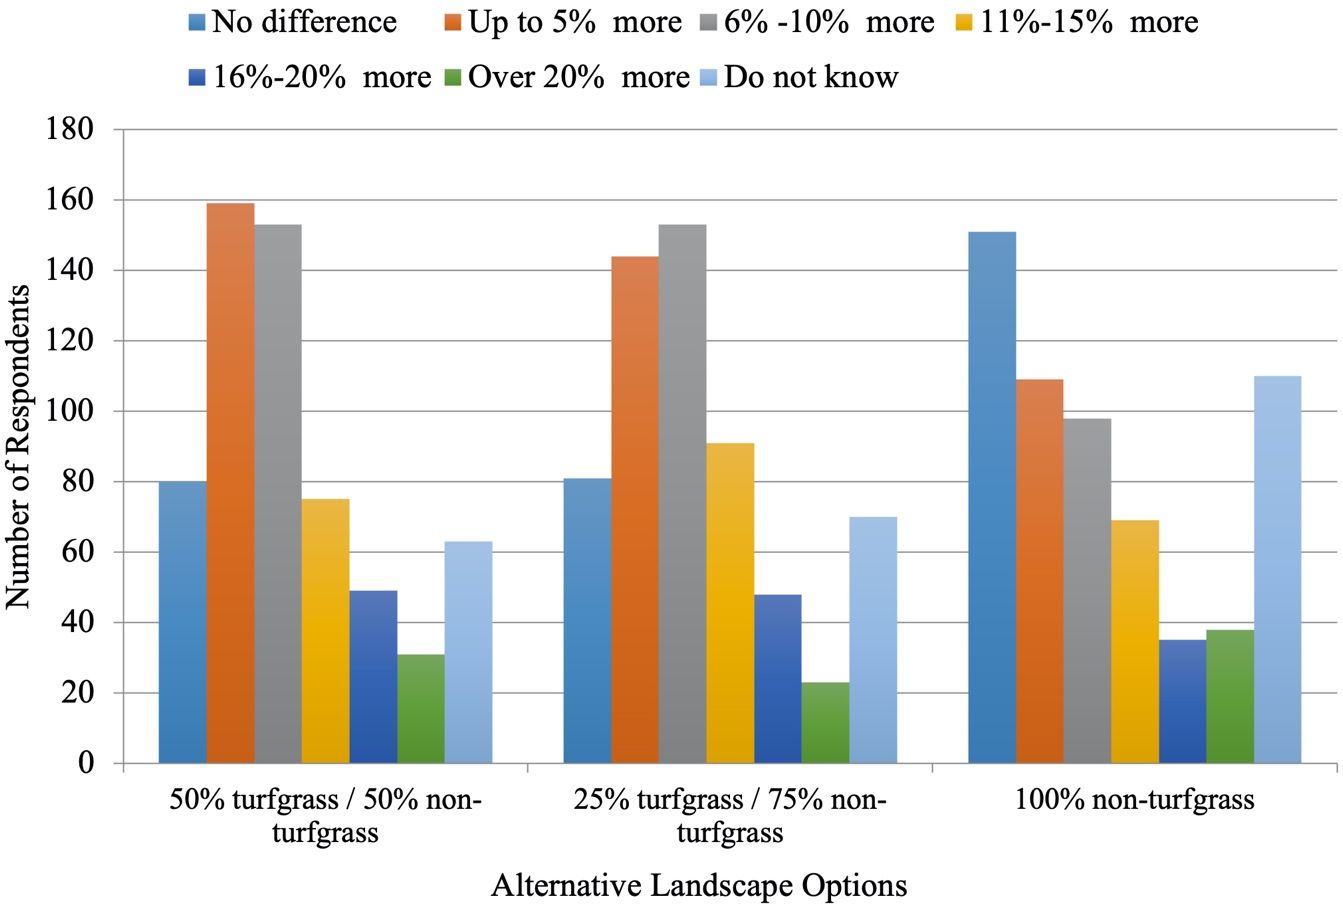
Participants perceived alternative, environmentally friendly landscapes as providing more property value than conventional landscapes (Figure 4). Participants rated their perceived value added for each option when compared to a primarily turf landscape. For an alternative landscape that consists of 50% turfgrass and 50% non-turfgrass plants, most participants indicated that they perceived property value increasing up to 5%, followed by 6%–10%. Conversely, 10% of the sample did not know the potential change in value, and 13% indicated no difference between conventional and alternative landscape options. The 25% turfgrass to 75% non-turfgrass plant alternative landscape design had a similar pattern, with most participants indicating the property value would increase up to 5% and 5%–10%, followed by 11%–15%, 16%–20%, and over 20%. Approximately 12% of the sample did not know the value change, and 13% indicated no difference between the alternative and conventional landscape options. For the 100% non-turfgrass option, 18% of the sample did not know the potential value change, while 25% indicated no difference. Fewer participants perceived this option (compared to the landscapes that included turfgrass) as adding value to the property. Those who perceived this option as adding value followed the same ranking pattern for the other two design options.
Credit: UF/IFAS
Financial Incentive
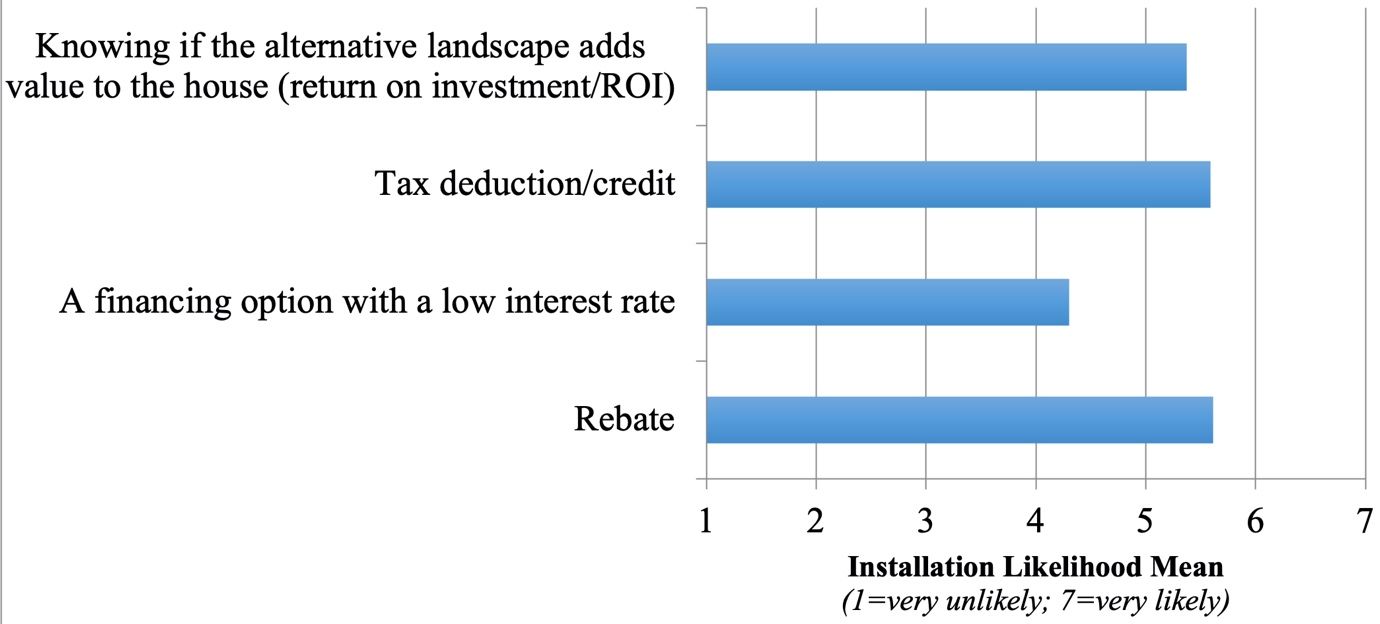
Participants indicated that a rebate or tax deduction/credit would be the most effective at improving their likelihood of installing an alternative landscape (Figure 5). Knowing the value that the alternative landscape would add to the property also improved their installation likelihood. Low interest rate financing was less appealing.
Credit: UF/IFAS
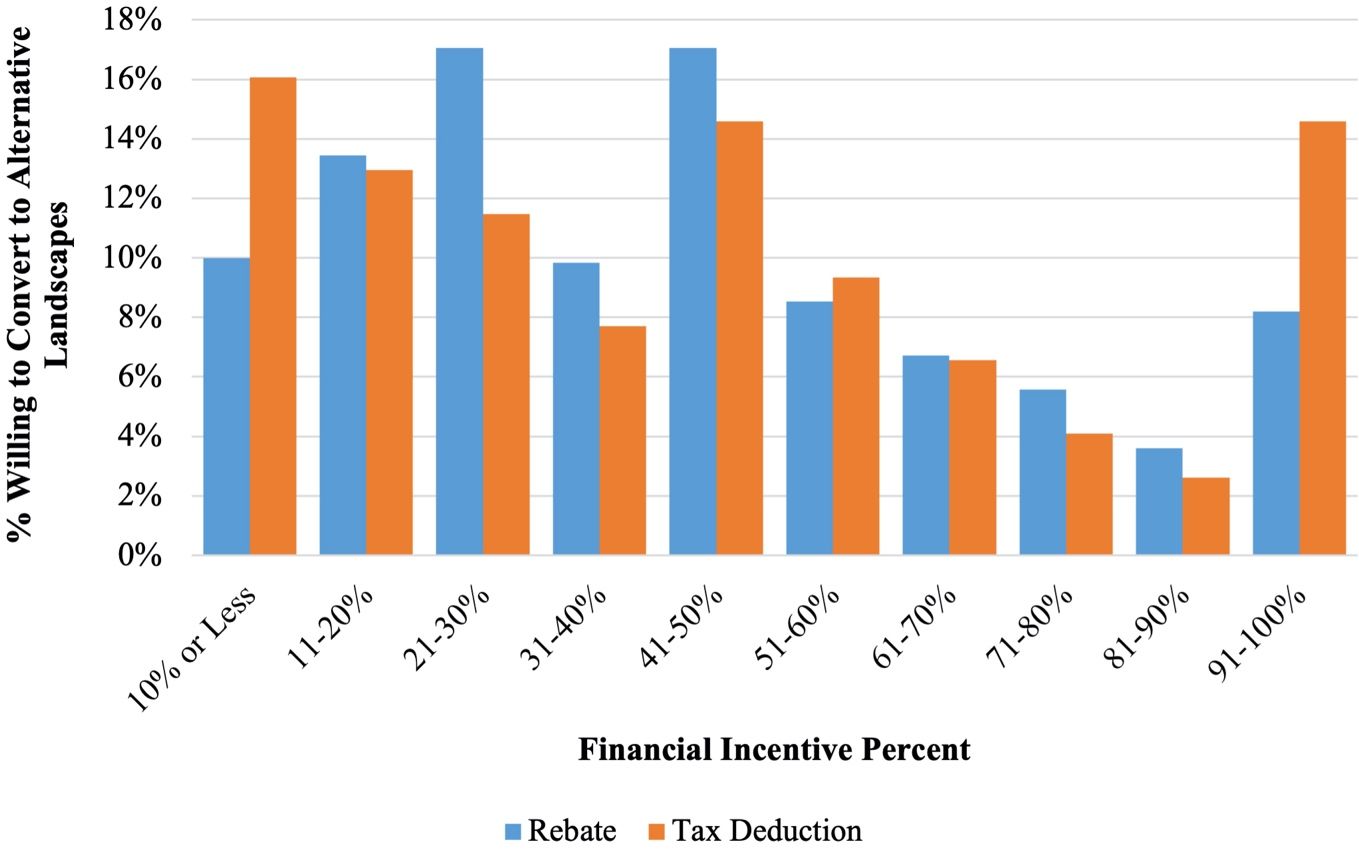
Prior to the study, 73% of participants indicated they had not received any financial incentives to purchase/install water-efficient technologies and/or landscape plants/products. Nearly 8% had received a tax deduction/credit while 14% received a rebate. On average, participants indicated they needed a 44% rebate or 46% tax incentive to change their existing landscape into an alternative design option. However, if one views the distribution of participants’ financial incentive percentages, differences between the two options become apparent (Figure 6). When considering rebates, participants were primarily in the 21%–30% or the 41%–50% categories. Rebates above 51% were selected less frequently by participants. For the tax deduction option, participants primarily selected the 10% or less, the 41%–50%, and the 91%–100% categories. These results may suggest that rebates are more straightforward and allow participants to gain money back for their purchase, regardless of income. Tax deductions may be less impactful for individuals with higher incomes given that they need to reach a higher deduction level in order to gain financial benefits.
Credit: UF/IFAS
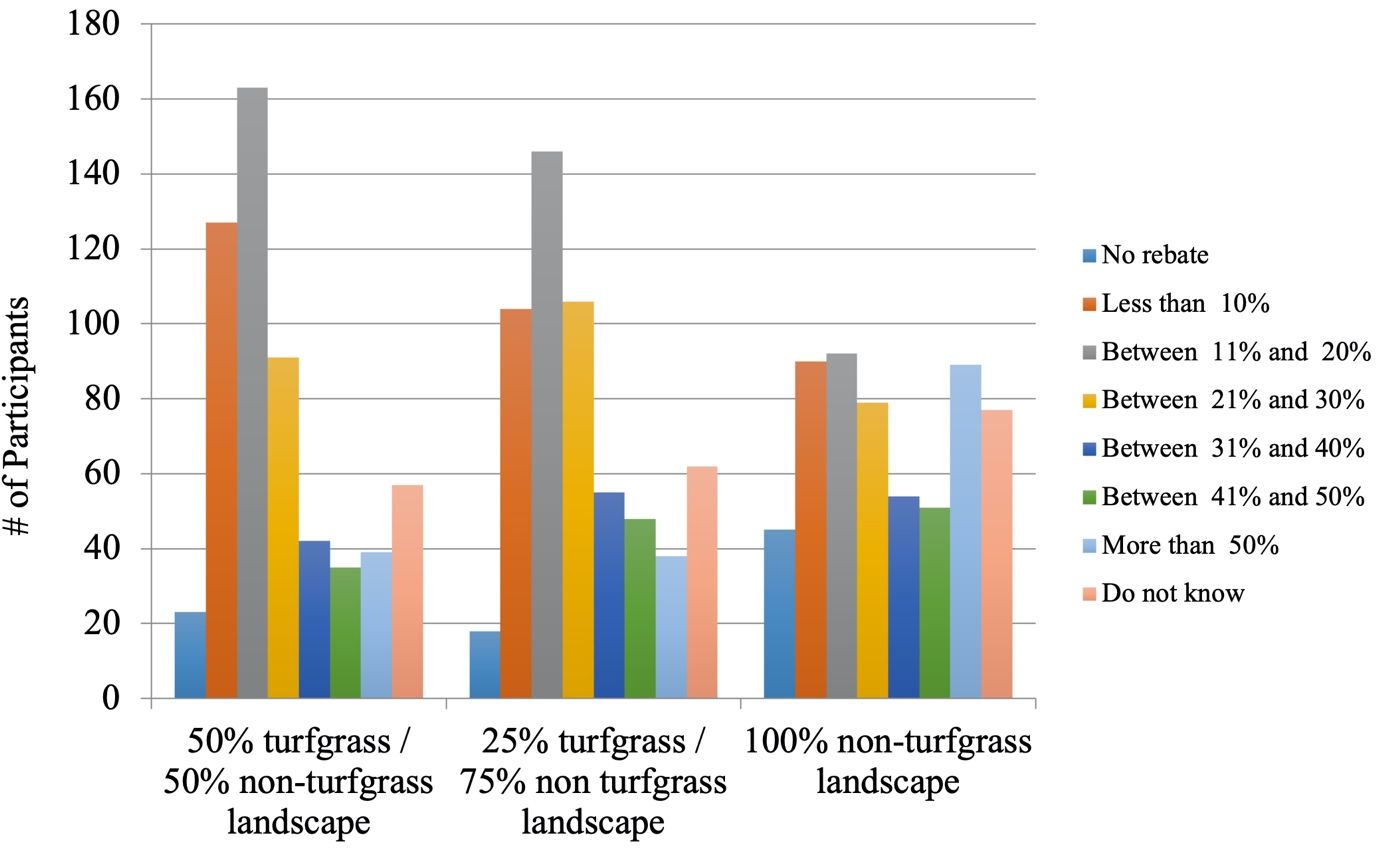
Next, participants indicated the minimum rebate they would accept for the different alternative landscape designs (50% turfgrass and 50% non-turfgrass; 25% turfgrass and 75% non-turfgrass; 100% non-turfgrass). For the 50% turfgrass and 50% non-turfgrass design, most participants indicated they would accept an 11%–20% rebate, followed by a less than 10% rebate, and the 21%–30% rebate (Figure 7). For the 25% turfgrass and 75% non-turfgrass design, most participants would accept an 11%–20% rebate, followed by the 21%–30% rebate, and then the less than 10% rebate. For the 100% non-turfgrass design, the 11%–20% rebate and the less than 10% rebate options were preferred. However, participants indicated a stronger preference for the more than 50% rebate along with the “do not know” and “no rebate” options.
Credit: UF/IFAS
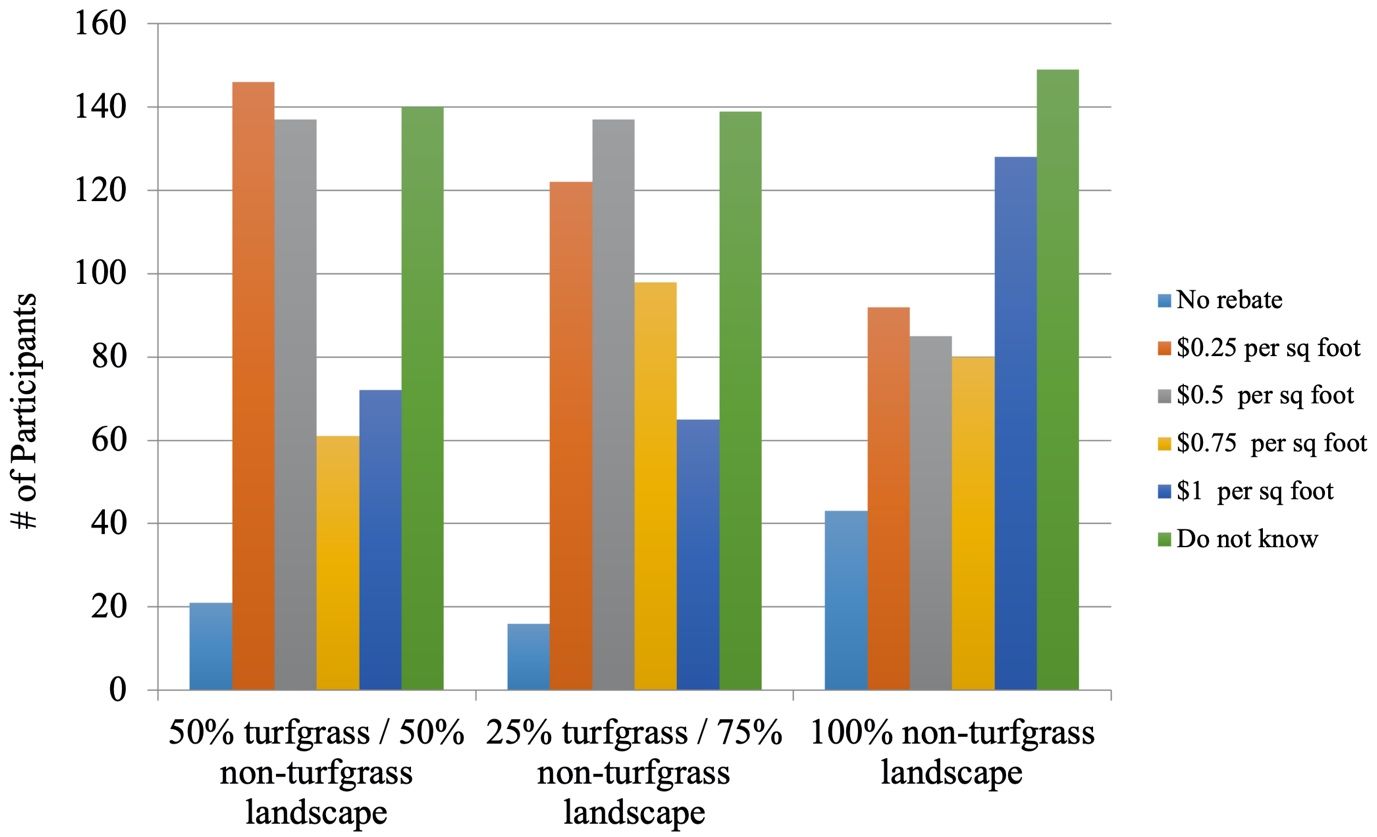
Participants also indicated the minimum dollar amount per square foot (presented as a rebate) that they would accept for the different landscape designs. For the 50% turfgrass/50% non-turfgrass and the 25% turfgrass/75% non-turfgrass designs, participants indicated they wanted $0.25–$0.50 rebate per square foot (Figure 8). For the 100% non-turfgrass design, participants indicated they would accept $1.00 per square foot. Regardless of the design, many participants indicated they did not know what their minimum dollar amount was for changing their landscapes to the presented designs.
Credit: UF/IFAS
Key Implications
- Floridian homeowners perceive residential landscapes as improving a property’s value with an expected return-on-investment of approximately 23%.
- Alternative, environmentally friendly landscapes are perceived as increasing a property’s value more than a traditional landscape.
- Rebates and tax deductions/credits are the most effective financial incentives to increase installation of more environmentally friendly landscapes.
- Consumers are willing to accept slightly lower rebates (44%) than tax deductions/credits (46%), which may reflect the changing impact of tax deductions/credits based on income.
- For the mixed turfgrass/non-turfgrass alternative landscape designs, the most preferred minimum rebate was 11%–20%, while the minimum dollar amount was $0.25–$0.50 per square foot.
- For the 100% non-turfgrass alternative landscape design, homeowners expressed less certainty and required a higher dollar amount ($1.00 per square foot).
References
Addink, S. 2008. “‘Cash for Grass’—A Cost Effective Method to Conserve Landscape Water?” Accessed September 15, 2022. https://turfgrass.ucr.edu/reports/topics/Cash-for-Grass.pdf
Alachua County Florida. 2018. “Up to $2,000 in Rebates Available Through the Turf Swap Program.” Accessed February 6, 2020. https://www.alachuacounty.us/News/Article/Pages/Up-to-$2,000-in-Rebates-Available-Through-the-Turf-Swap-Program.aspx
Hall, C. R., and M. W. Dickson. 2011. “Economic, Environmental, and Health/Well-Being Benefits Associated with Green Industry Products and Services: A Review.” Journal of Environmental Horticulture 29(2): 96–103.
Hall, C. R., and M. J. Knuth. 2019a. “An Update of the Literature Supporting the Well-Being Benefits of Plants: A Review of the Emotional and Mental Health Benefits of Plants.” Journal of Environmental Horticulture 37(1): 30–38.
Hall, C. R., and M. J. Knuth. 2019b. “An Update of the Literature Supporting the Well-Being Benefits of Plants: Part 2—Physiological Health Benefits.” Journal of Environmental Horticulture 37(2): 63–73.
Nowak, D. J., S. M. Stein, P. B. Randler, E. J. Greenfield, S. J. Comas, M. A. Carr, and R. J. Alig. 2010. “Sustaining America’s Urban Trees and Forests.” United States Department of Agriculture, Forest Service, General Technical Report NRS-62.
Southern Nevada Water Authority. 2020. “Water Smart Landscapes Rebate.” Retrieved February 6, 2020. https://www.snwa.com/rebates/wsl/index.html
Suh, D. H., H. Khachatryan, A. Rihn, and M. Dukes. 2017. “Relating Knowledge and Perceptions of Sustainable Water Management to Preferences for Smart Irrigation Technology.” Sustainability 9(4): 1–21.
U.S. Census Bureau. 2015. “2010 Census Urban and Rural Classification and Urban Area Criteria.” Accessed September 15, 2022. https://www.census.gov/programs-surveys/geography/guidance/geo-areas/urban-rural/2010-urban-rural.html
Yue, C., K. Hugie, and E. Watkins. 2012. “Are consumers willing to pay more for low-input turfgrasses on residential lawns? Evidence from choice experiments.” Journal of Agricultural and Applied Economics 44(4): 549–560.