Mexico is the largest source of US fresh fruit and vegetable imports (Huang et al. 2022). In 2019, over 50% of US agricultural imports from Mexico were fruit and vegetables (USDA FAS 2021). Protected agriculture plays a critical role in the rapid growth of Mexican export agriculture, particularly the fruit and vegetable industry. This publication provides a comprehensive overview of protected agriculture in Mexico to help industry stakeholders and policymakers understand this fast-growing sector.
Protected agriculture is agricultural production utilizing protective structures such as greenhouses and shade houses to protect crops from climatic and biological damages and improve growth conditions. The sector includes the floriculture subsector producing for the domestic market and the fruit and vegetable subsector producing mainly for export markets. Compared to open-field production, protected production has many advantages, including higher yield, better product quality, and improved access to the export market. Due to protected production technology, the fruit and vegetable industry in Mexico has grown rapidly with surging export of fresh produce in recent years. For example, about 78% of the vegetables produced under protected agriculture are exported to the United States and 5% are destined to Canada (Burfield 2019). In 2019, Mexican exports of fruit and vegetables to the United States reached about 11 million metric tons, with a total value of $15.7 billion (fresh $13.4 billion and processed $2.3 billion), almost two times that (both volume and value) in 2011 (USDA NASS 2021; USDA FAS 2021).
Protected agriculture is used mainly to produce high-value crops. According to the Office of Mexico’s Secretary of Agriculture, 17% of the specialty crops (in terms of production value) are produced under protected structures (SIAP 2020). Protected agriculture accounts for an even higher percentage in terms of agricultural export value. For example, the value of tomatoes produced under protected structures made up 61% of the total value of tomatoes exported to the US market in 2019 (SIAP 2020). As a result, protected agriculture has been promoted by the Mexican government as a strategic project to improve the competitiveness of Mexican agricultural products and economic growth (Wu et al. 2018).
Given the important role that Mexican protected agriculture plays in the US fresh produce market, this publication investigates the development of Mexican protected agriculture between 2009 and 2019, with a focus on protected production of fruit and vegetable crops. We first examine protected agriculture in terms of acreage, yield, and crop mix and then explore the driving force behind this growth, including the advantages of this technology, government support, and international market demand.
Development of Protected Agriculture
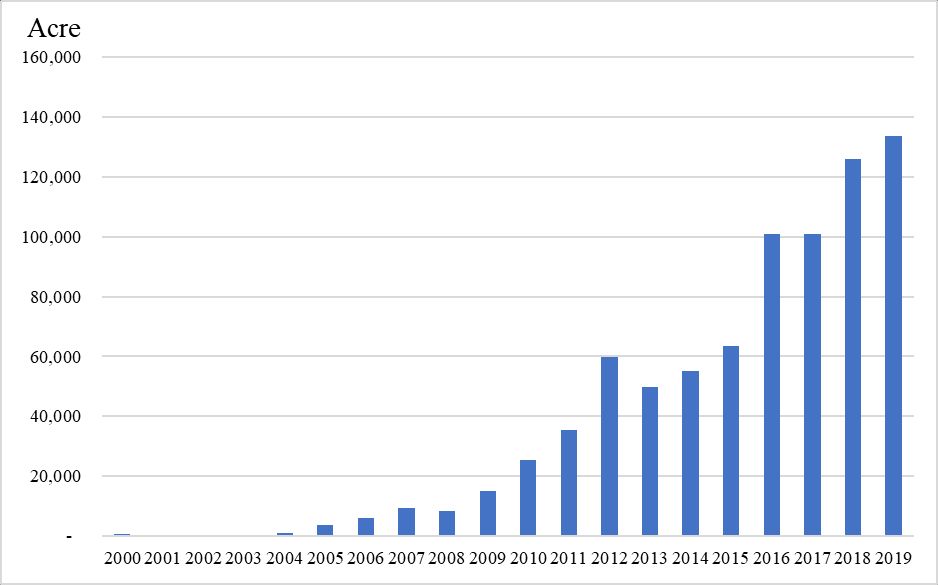
Protected agriculture started in Mexico in the 1990s. According to the Secretariat of Agriculture and Rural Development of Mexico, there were only 741 acres of protected agriculture in 2000. When more and more producers recognized the benefits of protected agriculture in yield, quality, pest control, and reduced risks associated with weather and climate variability, the growth of the sector accelerated. Figure 1 shows the change of protected agricultural area in Mexico from 2000 to 2019. The growth of protected agriculture started to take off in 2009 when the Mexican government launched the Strategic Project (National Strategy) for protected agriculture under the 2007–2012 National Development Plan. With an average annual growth of 7,004 acres per year, protected area had increased to 133,808 acres by 2019. Although most states in Mexico have protected agriculture, 57% of the area of protected agriculture is concentrated in three states: Sinaloa (20%), Jalisco (20%), and Michoacan (17%) (AMHPAC 2017).
Credit: Agrifood and Fisheries Information Service, Mexico; Servicio de Información Agroalimentaria y Pesquera (SIAP), 2020
Protection structures in Mexican agriculture include three major types: high-tech greenhouses, low-tech micro and macro tunnels with plastic covers resting on semi-rigid supports (called plastic tunnels or macro tunnels), and open-sided shade houses that protect plants using permeable covers. Among these structures, shade houses are the least expensive and often the first step in the adoption of protected production for most open-field growers. The popular types of protection structures are different across geographic regions, farm sizes, and crops. Growers in central states such as Queretaro and the State of Mexico have widely adopted greenhouse technology due to lower temperatures, while growers in Sinaloa prefer shade houses because of their warmer weather. Typically, most large farms (more than 15 ha) use better technologies compared to smaller farms, as large farms have more access to capital. In 2019, three types of cover structures—greenhouses, plastic tunnels, and shade houses—accounted for 26%, 28%, and 46%, respectively, of total protected production area.
Almost all protected structures in Mexico are used to produce horticultural crops. In 2019, 4,675 acres (3.5%) of protected area were used to produce floricultural crops, while 129,135 acres (96.5%) of protected area were used to produce fruit and vegetables. The leading fruit and vegetable crops produced under protected structures were tomato (40,846 acres), pepper (16,235 acres), strawberry (15,385 acres), raspberry (14,902 acres), cucumber (11,231 acres), apple (11,013 acres), blueberry (7,211 acres), and eggplant (2,627 acres) (Table 1). Grapes, rose, and blackberries are the leading crops in the “other” category in Table 1 and grew quickly in recent years. Figure 2 shows the distributions of protected area among major crops in 2009 and 2019. In 2009, tomatoes had by far the largest percentage (65%) under protected structure, but over time, this crop’s growth in acreage has slowed. Conversely, other crops, in particular, berries, have seen fast growth after the Mexican government pushed to double the sector’s production capacity (Guan et al. 2015). By 2019, strawberries, raspberries, and blueberries made up 28% of total protected area in Mexico. Cucumber acreage under protected production saw a seven-fold growth during 2009–2019 (Table 1).
Table 1. Area (acres) of major crops under protected structures in Mexico, 2009–2019.

Credit: Agrifood and Fisheries Information Service, Mexico; Servicio de Información Agroalimentaria y Pesquera (SIAP), 2020
Factors Driving the Growth
As can be seen from Figure 1 and Table 1, protected agriculture has grown rapidly in Mexico since 2009. Several factors have contributed to the rapid growth of the sector. First, the significant advantages of protected production over open-field production have made it an attractive technology for adoption. Second, the adoption is embraced by the Mexican government, which has provided generous support to facilitate the investment and accelerate the adoption. Third, strong demand from the North American market has sustained continued expansion of protected production in Mexico.
Benefits of Protected Agriculture
Compared to open-field production, protected production brings significant benefits, including increased yield and quality, higher prices, reduced vulnerability to environmental factors, increased water and chemical use efficiency, extended production windows, and in some locations, year-round production and supply that is important to many clients. These advantages coupled with subsidies (to be discussed shortly) translate to higher profitability and better market access, which has attracted producers to switch from open field production to protected production.
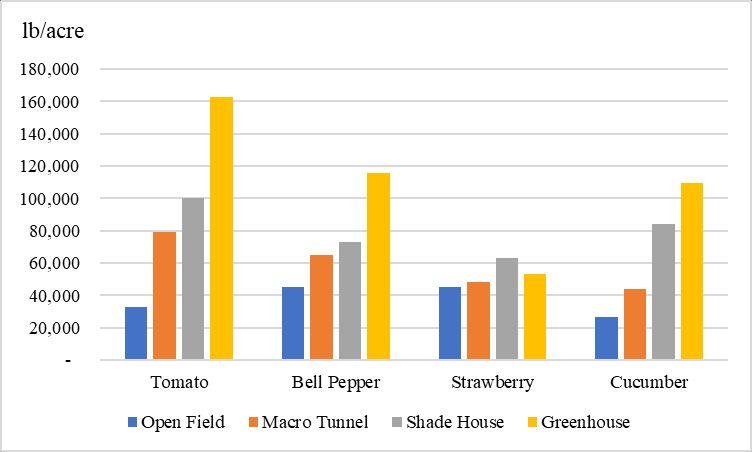
Figure 3 compares crop yield across different cultivation types in Mexico. Productivity under protection structures is much higher than that in open field. Furthermore, productivity gains increase significantly as the level of technology rises. Take tomatoes and cucumber as examples. In 2019, tomato yields under macro tunnels, shade houses, and greenhouses were 79,163, 100,013, and 162,600 pounds per acre, respectively, which are over two, three, and five times the average open-field yield in Mexico, respectively. Similarly, cucumber yields under these three structures were 44,136, 84,311, and 109,640 pounds per acre, respectively, while open-field yield was only 26,712 pounds per acre (Figure 3).
Credit: Agrifood and Fisheries Information Service, Mexico; Servicio de Información Agroalimentaria y Pesquera (SIAP), 2020
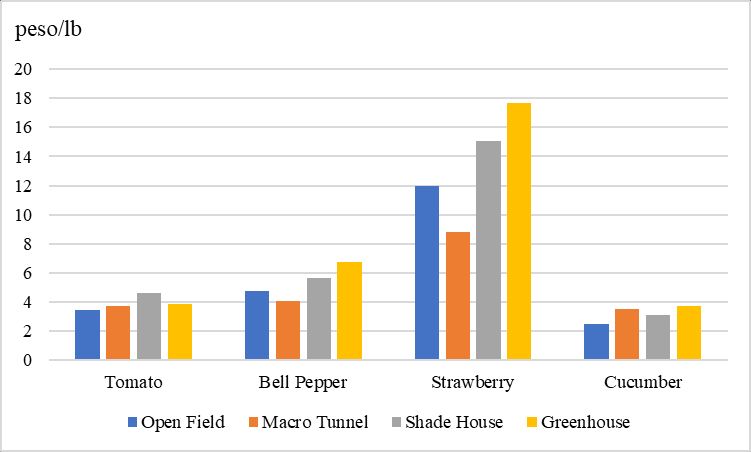
In addition, producers receive higher prices for products under protected production. Figure 4 shows farm-level prices of tomatoes, strawberries, bell peppers, and cucumber produced under different technologies. Those produced in greenhouses bring the highest prices, except for tomatoes. Prices for bell peppers, strawberries, and cucumber produced under protected structures are approximately one and a half times the prices of those produced in open fields due to higher quality. Furthermore, protected structures can extend the production season to winter time when crop prices are usually higher. Increased yields and prices help secure higher revenues for producers.
Credit: Agrifood and Fisheries Information Service, Mexico; Servicio de Información Agroalimentaria y Pesquera (SIAP), 2020
There are other factors that increase the competitiveness of exported Mexican produce. In 2019, the average wage rate of farmworkers in Mexico was 225.57 pesos per day (for a 10-hour workday), equivalent to $1.2 per hour. For comparison, the average wage rate paid to hired field workers in the United States was $14.11 per hour in 2019 (USDA NASS 2021). A survey study further showed that the average labor cost for Mexican strawberries exported to the United States was $1.27 (18.27 pesos) per flat compared to $2.81 per flat for Florida strawberries (Wu, Guan, and Garcia-Nazariega 2018). Also, the continued devaluation of the Mexican peso over the years has given Mexican produce an extra edge in competitiveness compared to US-grown produce (Congressional Research Service 2020). Since 2011, the Mexican peso has lost 45% of its value measured in US dollars (USD) (OECD 2021). Although low labor costs and peso devaluation are general factors not directly tied to protected agriculture, they do magnify the competitive advantage of the Mexican produce grown under protected agriculture against the US produce in the fruit and vegetable market.
Generous Government Support
One obstacle for the adoption of protected agriculture is the high initial investment requirement. For producers in developing countries, capital usually is a major constraint that would limit the development of protected agriculture. In Mexico, the government has been subsidizing protected agriculture, providing producers with much-needed capital, which reduces producers’ cost of production and their capital constraints in investment, thus driving technology adoption and industry expansion (Wu et al. 2018).
The government support in protected agriculture was part of the strategic project under the National Development Plan, which established programs to increase the production capacity and competitiveness of Mexican agricultural products. The details of the major support programs have been studied in the literature (Wu et al. 2018; Wu, Soto-Caro, and Guan 2021). One of the government programs provides support for the equipment and infrastructure of protected agriculture and related services, including training and technical assistance. The subsidy rates depend on the technologies used and vary across the years, with total subsidy amounts up to 50% of the project costs. The maximum subsidy amount per project in 2013 was 1.5 million pesos ($113,000) for macro-tunnels, 2.4 million pesos ($181,000) for shade houses, and 3 million pesos ($226,000) for greenhouses (Table 2). In 2019, the maximum amount increased to 4 million pesos per project ($208,000, based on the 2019 exchange rate) for all types of eligible structures. The support for protected structures totaled 2.35 billion million pesos ($150 million) during 2013–2018 under the previous National Development Plan (Table 3). The total estimate of subsidies for protected production in Mexico over the period 2001–2018 was approximately 7 billion pesos ($550 million) (Garcia Victoria et al. 2011; Wu et al. 2018). The strategic government support for protected agriculture has been a driving force behind the industry’s rapid growth, accelerating the adoption of protected agricultural structures.
Table 2. Support rules for intensive production and agricultural covers (IPAC) subprogram, 2013–2019.
Table 3. Expenditures of intensive production and agricultural covers (IPAC) subprogram, 2013–2018.
Strong International Demand and Growth in Exports
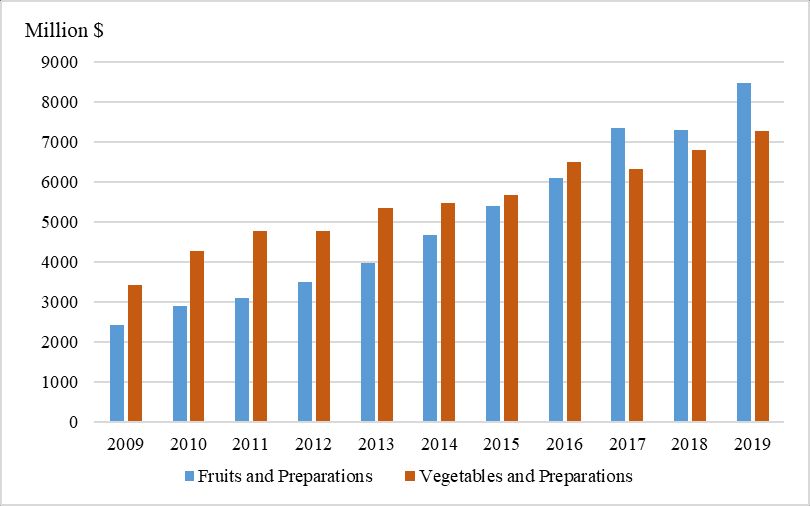
The strong demand for Mexican fruit and vegetables is also essential to Mexico’s protected agriculture. Mexico has been the largest source of US fruit and vegetable imports since 1967 (the earliest year data were available in the USDA FAS database) (USDA FAS 2021). According to the US Department of Commerce, fresh fruit and vegetables have been the leading categories in imported agricultural products from Mexico since 1967. In 2019, US imports of fresh fruit and vegetables from Mexico were $13.4 billion, representing 48% of the 2019 US total agricultural imports from Mexico ($28 billion). Besides fresh produce, the United States also imported large amounts of processed fruit and vegetables. Figure 5 shows the growth in US fruit and vegetable imports (fresh and processed) from Mexico from 2009 to 2019. During this period, the value of US imports of fruits and preparations from Mexico more than tripled while imports of vegetables and preparations more than doubled. In 2019, total imports of fruit and vegetables (including preparations) from Mexico reached $15.7 billion (Figure 5), representing 56% of the total agricultural imports from Mexico.
Credit: USDA Foreign Agricultural Service (USDA FAS), 2021
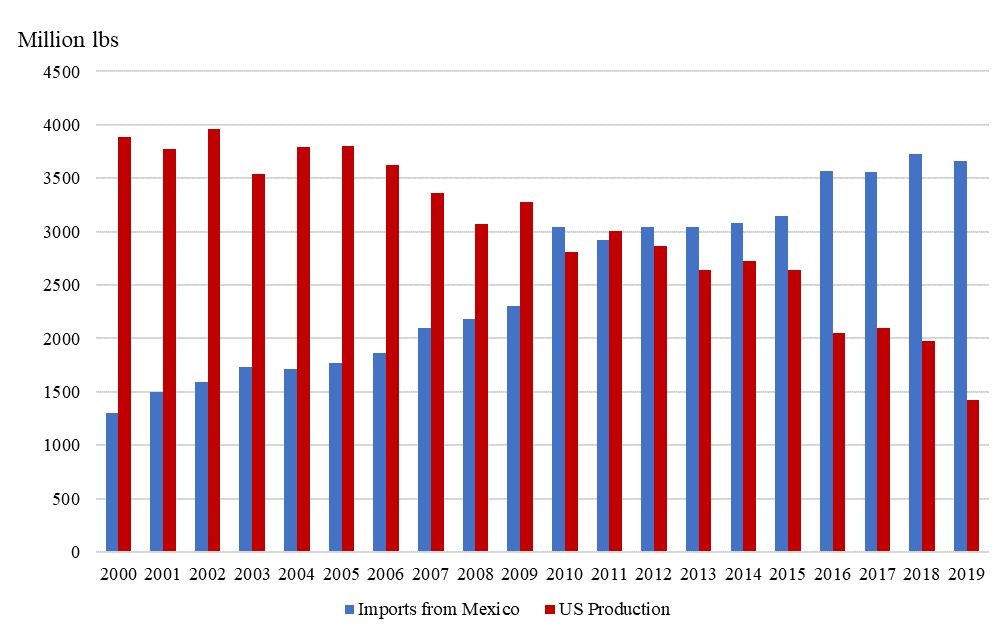
It is worth noting that the increased imports from Mexico in the US market corresponded to declines in the production of the same crops in the US fruit and vegetable industry. Figure 6 provides an example of increasing Mexican imports and declining US production of fresh market tomatoes. The US production in Figure 6 represents open-field production that was utilized; a small percentage of unsold production is not included. In recent years, protected agriculture tomatoes are gaining popularity in the US retail food industry. For example, Wendy’s (a US fast-food service) has announced that it will be sourcing only greenhouse-grown tomatoes, which are mostly from Mexico, at all of its US and Canadian fast-food locations. Tomatoes are the leading US vegetable import from Mexico, accounting for 85.5% of the value of total US tomato imports and 91% of imported tomato volume in 2019. Among the imported Mexican tomatoes, 61% of the value of imports and 50.5 % of volume are sourced from protected culture structures in 2019, compared to 44% and 34% in 2009, respectively. This shows the significant role protected agriculture has played in the rising imports of Mexican tomatoes in the US market. Furthermore, competitive pricing, product features, year-round supply of products, and government promotion have all contributed to the growing market share of Mexican produce in the international market.
The declining trend of US fruit and vegetable production is especially significant in the southeastern states where growing seasons of major crops overlap with those in Mexico. For instance, Florida, the major strawberry and fresh tomato supplier in the US market in wintertime, has a harvesting window from November to April for strawberries and from October to June for tomatoes. The harvesting windows of both crops overlap with those in Mexico, causing direct competition in the market (Huang et al. 2022).
Credit: USDA Foreign Agricultural Service (USDA FAS) and USDA National Agricultural Statistics Service (USDA NASS), 2021
Concluding Remarks
Protected agriculture is the fastest growing sector in Mexican agriculture, with an annual growth rate of protected area at 31.7% during 2000–2019 (Figure 1). This high growth rate has been largely driven by Mexico’s rapidly growing exports to the US market as well as government support and promotion. The large US demand for Mexican fruit and vegetables has sustained the continued growth of export-oriented protected production. The changing consumer preference for vine-ripe tomatoes and tomatoes on the vine (TOV) has also contributed to the growth. The major protected production systems include greenhouses, macro-tunnels, and shade houses. Tomatoes, peppers, cucumbers, and berries are the most planted crops under protection structures. Considered a strategic sector by the Mexican government, protected production has received generous government support, covering both investment in protection structures and relevant services, which has accelerated the adoption of protected agriculture in Mexico.
The move toward protected agriculture has been an important driver of the growth of the export sector of the Mexican fruit and vegetable industry. This technology enables a significant increase in production volume with better controls over weather and climate factors (e.g., temperature, humidity, CO2 concentration) and extremely efficient use of land. The value of Mexico fresh produce exports to the United States has increased from about $5 billion in 2009 to almost $15 billion in 2020 (USDA FAS 2021). The rising exports have led to intense competition in the US market. Tomatoes (Guan, Biswas, and Wu 2018; Wu, Guan, and Suh 2018; Li et al. 2021), peppers (Biswas, Guan, and Wu 2018), and berries (Suh, Guan, and Khachatryan 2017; Wu and Guan 2021) provide perfect examples of this. While inflation over a 15-year period during 2005–2019 amounted to 31%, the prices tomato growers received in major production areas such as Florida have remained virtually flat over the period, resulting in decreased real prices. Increasing cost of US production and depressed prices with the influx of Mexican produce into the US market have caused tensions and a series of trade disputes between the two countries involving multiple crops.
References
Biswas, Trina, Zhengfei Guan, and Feng Wu. 2018. "An overview of the US bell pepper industry." EDIS FE1028. https://doi.org/10.32473/edis-fe1028-2017
Burfield, T. 2019. "Protected Agriculture reaches 126,000 acres in Mexico." The Packer September 17. https://www.thepacker.com/markets/shipping/protected-agriculture-reaches-126000-acres-mexico
Congressional Research Service. 2020. "U.S.-Mexico Economic Relations: Trends, Issues, and Implications." Congressional Research Service Report RL32934. https://sgp.fas.org/crs/row/RL32934.pdf
Guan, Zhengfei, Trina Biswas, and Feng Wu. 2018. "The US Tomato Industry: An Overview of Production and Trade." EDIS FE1027. https://doi.org/10.32473/edis-fe1027-2017
Guan, Zhengfei, Feng Wu, Fritz Roka, and Alicia Whidden. 2015. "Agricultural Labor and Immigration Reform." Choices 30 (4): 1–9. http://www.jstor.org/stable/choices.30.4.03
Huang, Kuan-Ming, Zhengfei Guan, and AbdelMalek Hammami. 2022. “The U.S. Fresh Fruit and Vegetable Industry: An Overview of Production and Trade.” Agriculture 12, 1719.
Li, Sheng, Feng Wu, Zhengfei Guan, and Tianyuan Luo. 2021. "How trade affects the US produce industry: the case of fresh tomatoes." International Food and Agribusiness Management Review 25 (1): 121–133. https://doi.org/10.22434/IFAMR2021.0005
Mexican Association of Protected Horticulture (AMHPAC). 2017. "Agricultura Protegida en Mexico." http://amhpac.org/2018/images/PDFoficial/HorticulturaenMexico.pdf
Organization for Economic Co-operation and Development (OECD). 2021. "Exchange rates: National currency units/US dollars." Accessed 1 March 2022. https://data.oecd.org/conversion/exchange-rates.htm
Servicio de Información Agroalimentaria y Pesquera (SIAP). 2020. "2019 Food and Agricultural Atlas." Ciudad de México: SIAP. http://nube.siap.gob.mx
Suh, Dong Hee, Zhengfei Guan, and Hayk Khachatryan. 2017. "The impact of Mexican competition on the US strawberry industry." International Food and Agribusiness Management Review 20 (4): 591–604. https://doi.org/10.22434/IFAMR2016.0075
USDA Foreign Agricultural Service (USDA FAS). 2021. "Global Agricultural Trade System Online." Accessed 8 December 2021. https://apps.fas.usda.gov/GATS/default.aspx
USDA National Agricultural Statistics Service (USDA NASS). 2021. "Quick Stats." Accessed 8 December 2021. https://quickstats.nass.usda.gov/
Victoria, N Garcia, OMC van der Valk, and Anne Elings. 2011. "Mexican Protected Horticulture: Production and market of Mexican protected horticulture described and analysed." Wageningen UR Greenhouse Horticulture Rapport GTB-1126. https://www.cabi.org/wp-content/uploads/Garcia-Victoria-2011-Mexican-Protected-Horticulture.pdf
Wu, Feng, and Zhengfei Guan. 2021. "An Overview of the Mexican Blueberry Industry." EDIS FE1106. https://doi.org/10.32473/edis-fe1106-2021
Wu, Feng, Zhengfei Guan, and Melvin Garcia-Nazariega. 2018. "Comparison of Labor Costs between Florida and Mexican Strawberry Industries." EDIS FE1023. https://doi.org/10.32473/edis-fe1023-2017.
Wu, Feng, Zhengfei Guan, and Dong Hee Suh. 2018. "The Effects of Tomato Suspension Agreements on Market Price Dynamics and Farm Revenue." Applied Economic Perspectives and Policy 40 (2): 316–332. https://doi.org/10.1093/aepp/ppx029
Wu, Feng, Berdikul Qushim, Marcelo Calle, and Zhengfei Guan. 2018. "Government Support in Mexican Agriculture." Choices 33 (3): 1–11. https://www.choicesmagazine.org/UserFiles/file/cmsarticle_647.pdf
Wu, Feng, Ariel Soto-Caro, and Zhengfei Guan. 2021. "Government Support in Mexican Agriculture: The Agri-Food Productivity and Competitiveness Program." EDIS FE1107. https://doi.org/10.32473/edis-fe1107-2021