Cucumbers and squash are important vegetable crops. In the last two decades, the US domestic production of the two crops has been declining while imports have been growing rapidly. Imports from Mexico have surpassed US domestic production and have become a major source of cucumber and squash supply in the US market. This shift has also occurred in other fresh produce sectors such as fresh market tomatoes (Guan et al. 2018; Wu et al. 2018b; Li et al. 2021) and peppers (Biswas et al. 2018). The trend observed in fresh produce is consistent with the overall fast pace of growth of US agricultural imports from Mexico (Huang et al. 2022). Between 1993 (the year before NAFTA’s implementation) and 2020, US agricultural exports to Mexico grew fivefold, from 3.7 billion USD to 18 billion USD (currency in US dollars [USD]), while agricultural imports from Mexico grew more than eleven-fold, from 2.9 billion USD to 33 billion USD (USDA-FAS 2021), resulting in a large agricultural trade deficit of 14.6 billion USD in 2020 (Huang et al. 2022).
The shift from surplus to a large deficit with Mexico in agricultural trade was mainly driven by the rapid growth in fruit and vegetable imports from Mexico, which reached 16.4 billion USD in 2020, more than double the amount in 2010 (USDA-FAS 2021). To put it in perspective, the combined US exports of corn and soybeans, the two largest US agricultural commodities exported to Mexico, were only 4.6 billion USD in 2020 (USDA-FAS 2021).
This publication provides an overview of cucumber and squash production and trade to help growers, policymakers, business communities, and researchers understand the structural changes in the market.
Cucumber Production and Trade
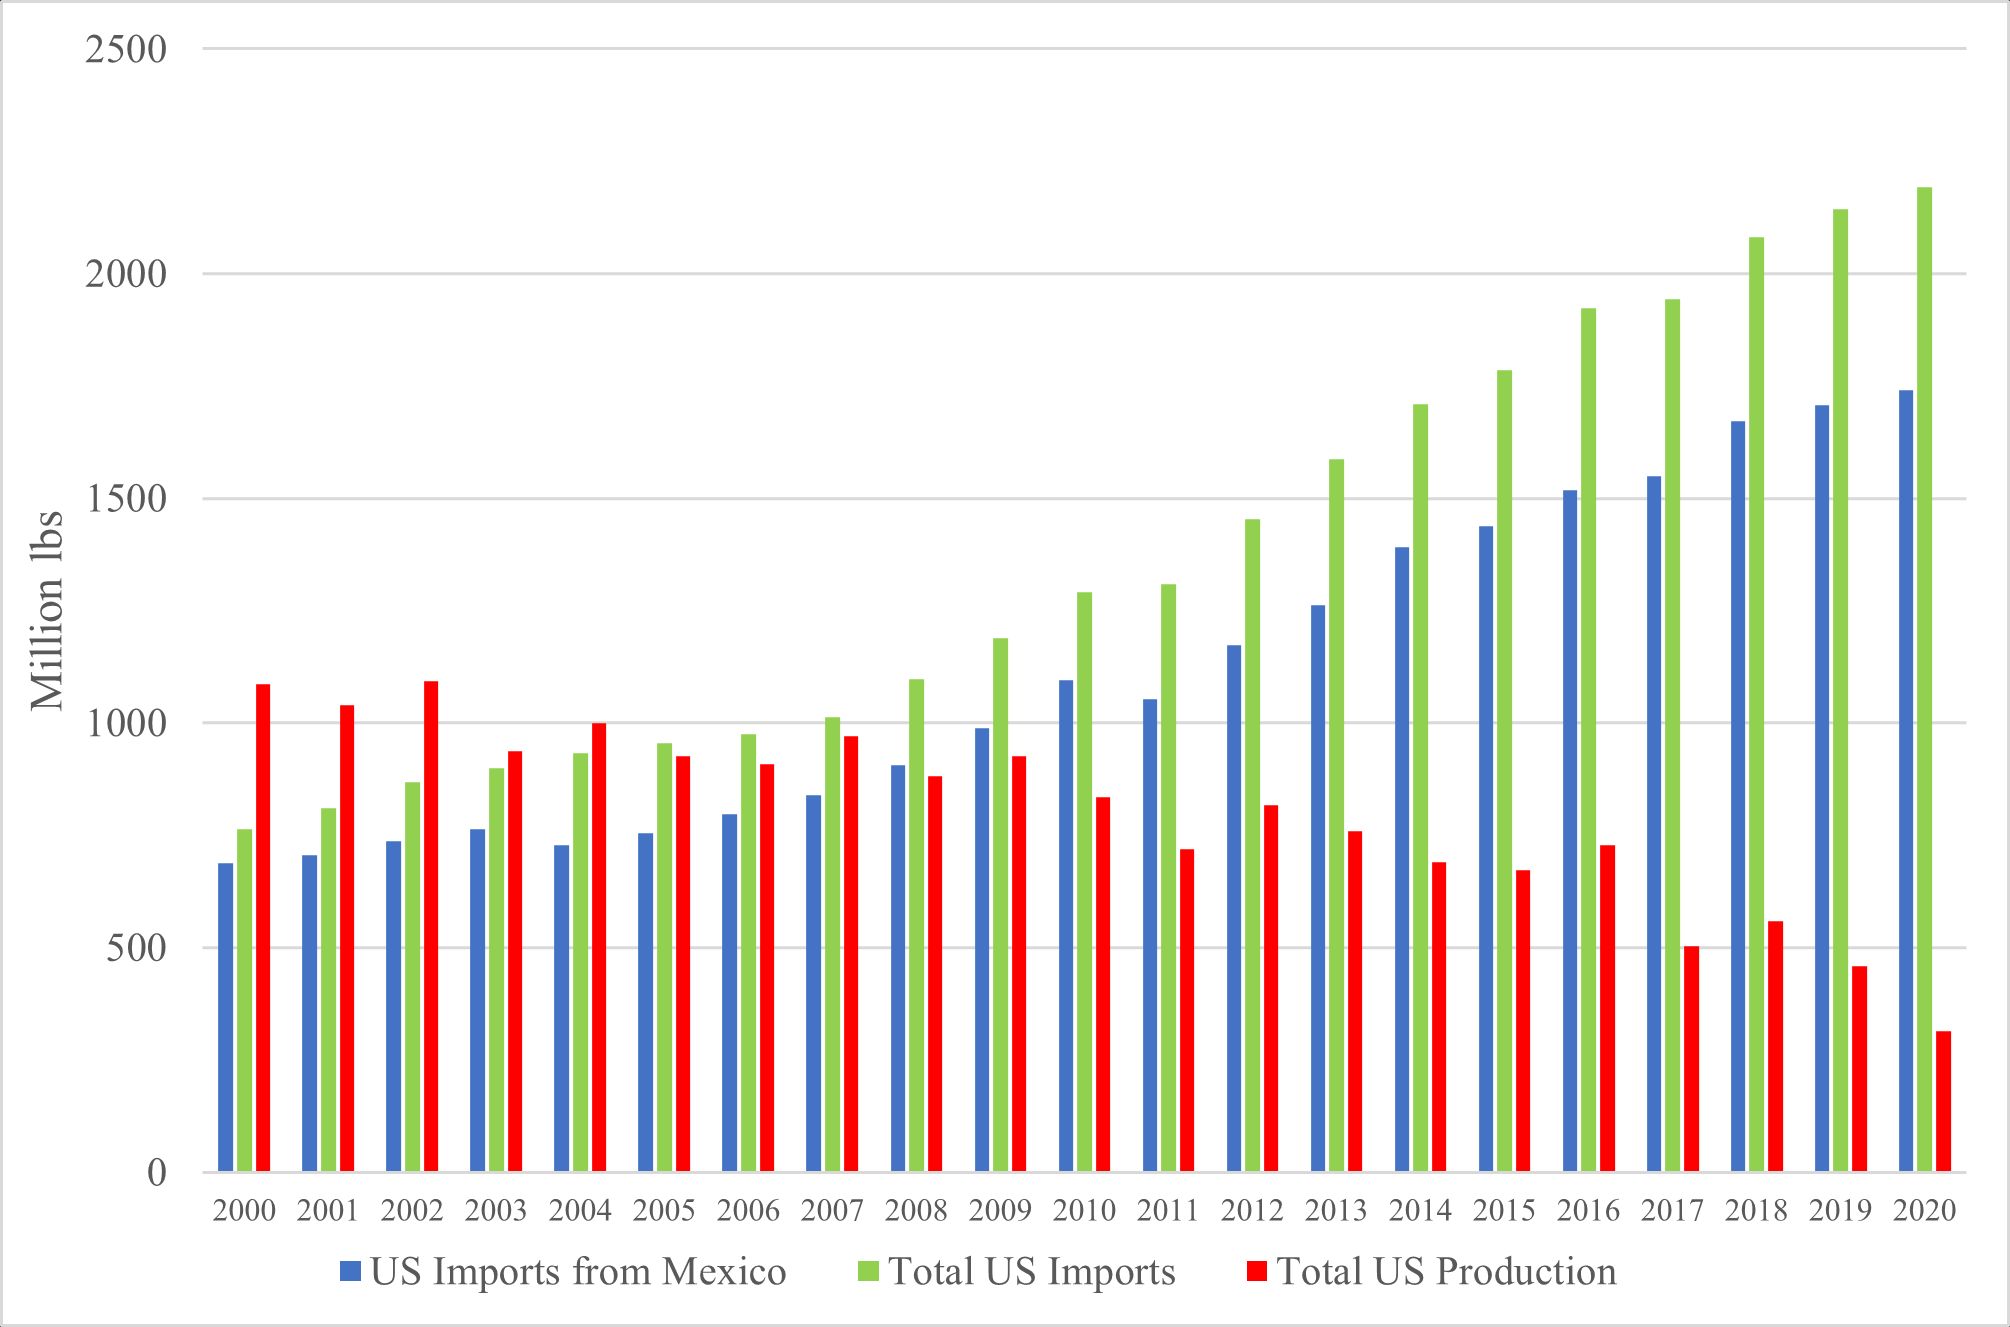
Fresh market cucumber production (excludes processing) in the United States has been declining for the last 20 years. Total US production of fresh cucumbers dropped from 1087 million pounds in 2000 to 314 million pounds in 2020, down 71% over 20 years (Figure 1). During this period, imports grew consistently. Total US imports of fresh cucumbers in 2000 totaled 763 million pounds, 30% less than total US production; by 2020, US imports had nearly tripled to 2,193 million pounds in 2020, or seven times higher than US production.
Credit: USDA-NASS and US Census Bureau
United States fresh market cucumber imports from Mexico alone increased from 689 million pounds in 2000 to 1740 million pounds in 2020, growing approximately 250% over the 20-year period (Figure 1). In 2000, imports from Mexico were 37% less than US production, while, in 2020, imports from Mexico were over five times greater than US production. The surge of imports from Mexico, which accounted for 90% of the US total imports in 2000 and about 80% in 2020 has created great pressure on the US cucumber industry.
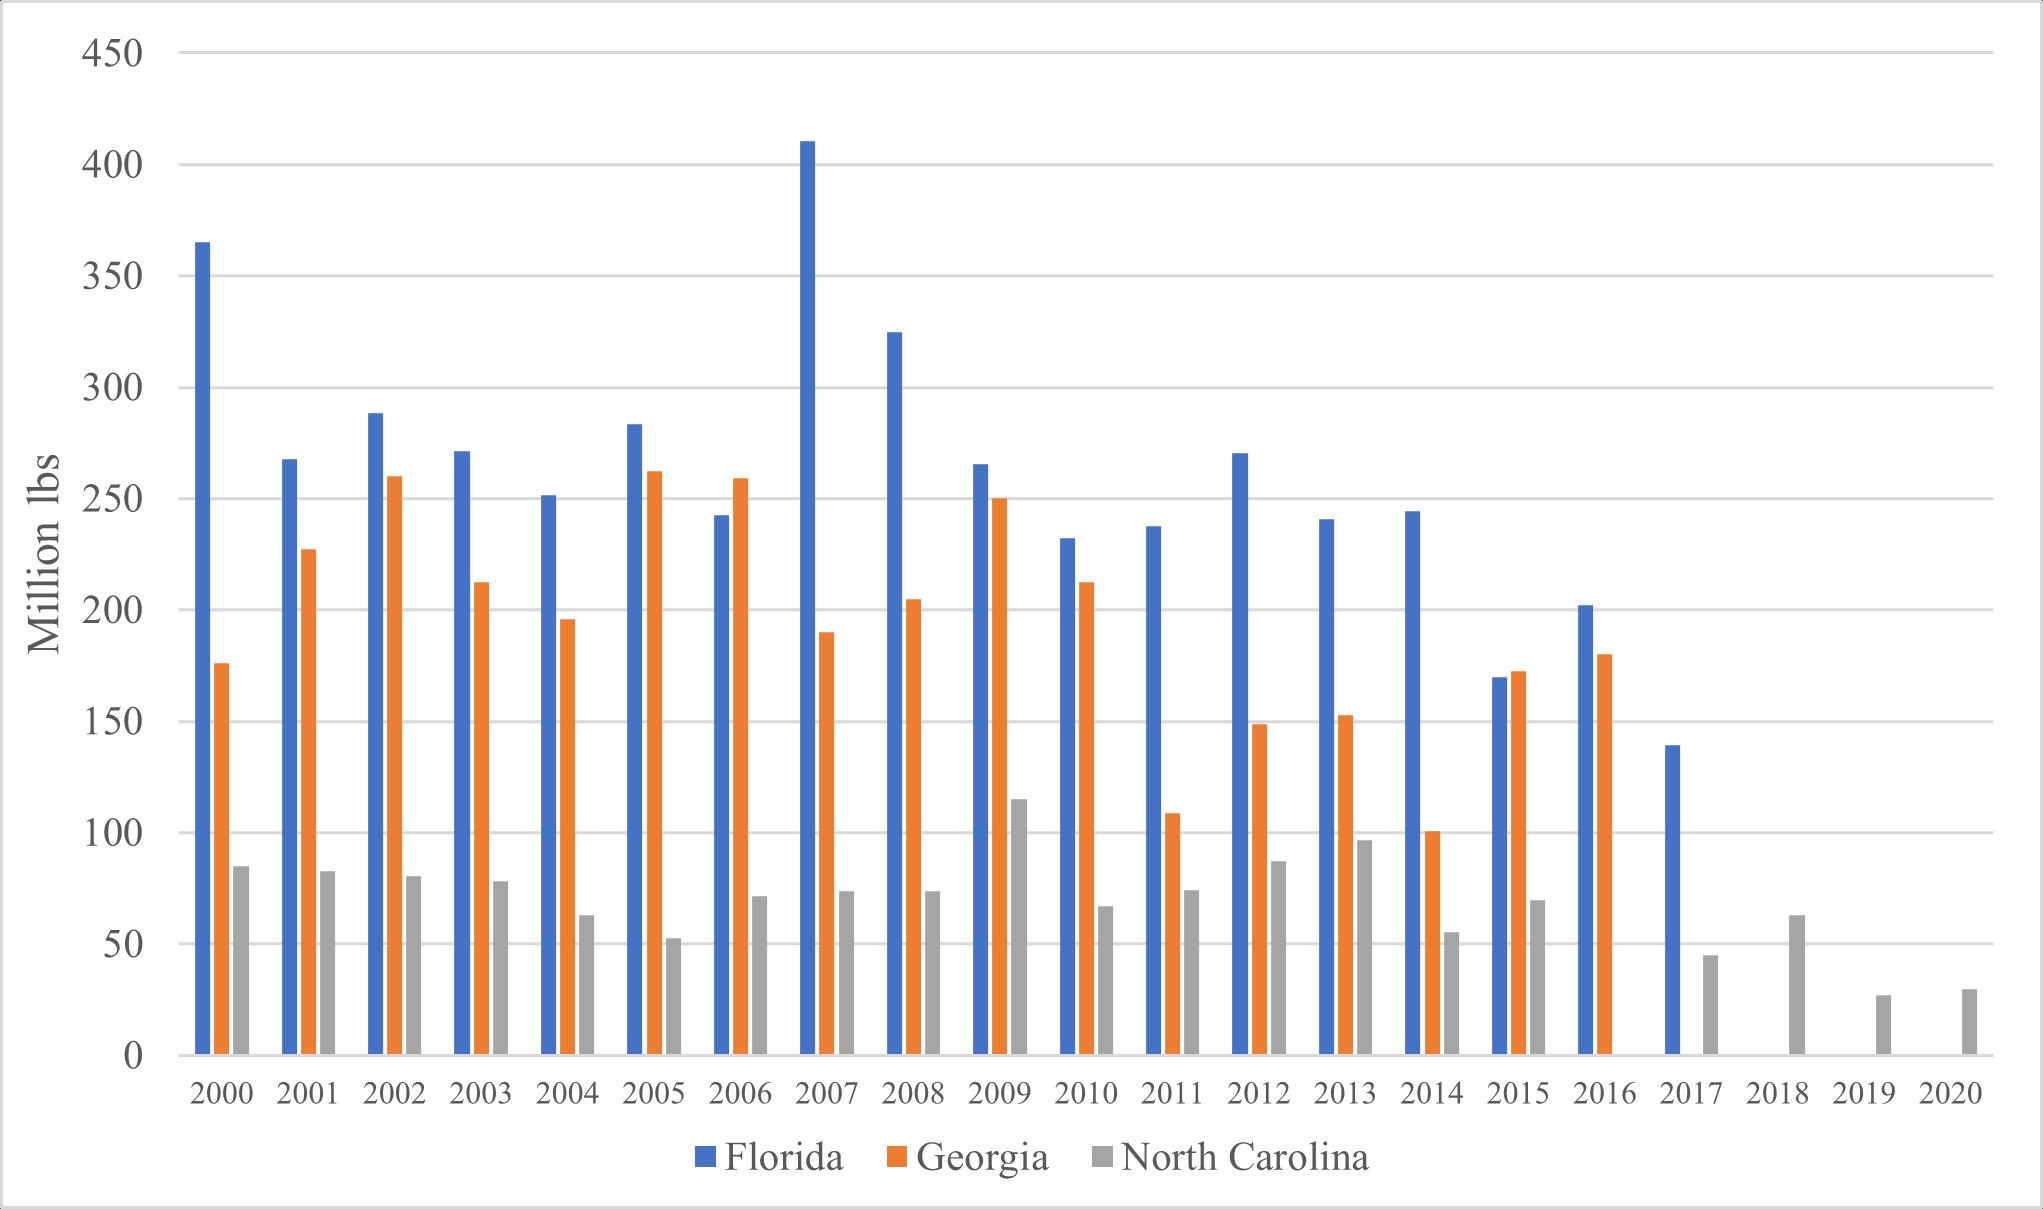
The main cucumber production season in Mexico overlaps that of the Southeast region of the United States (Huang et al. 2022). While Florida, Georgia, and North Carolina are among the top suppliers of cucumbers in the United States, their market shares have exhibited a significant downward trend since 2000, especially for the state of Florida. Figure 2 shows production of fresh market cucumbers in all three states over the period of 2000 to 2020. The total production of these three states accounted for 61% of US production in 2015 (the most recent year that fresh market cucumber information for all three states is available from USDA National Agricultural Statistics Service [USDA-NASS]). Total fresh cucumber production in these three states dropped from 626 million pounds in 2000 to 412 million pounds in 2015, down nearly 35%. Notably, Florida production dropped from 410 million at its peak in 2007 to 139 million pounds in 2017 (latest year in which fresh market cucumber production data are available from USDA-NASS). It was down 66% over a period of 10 years.
Credit: USDA-NASS
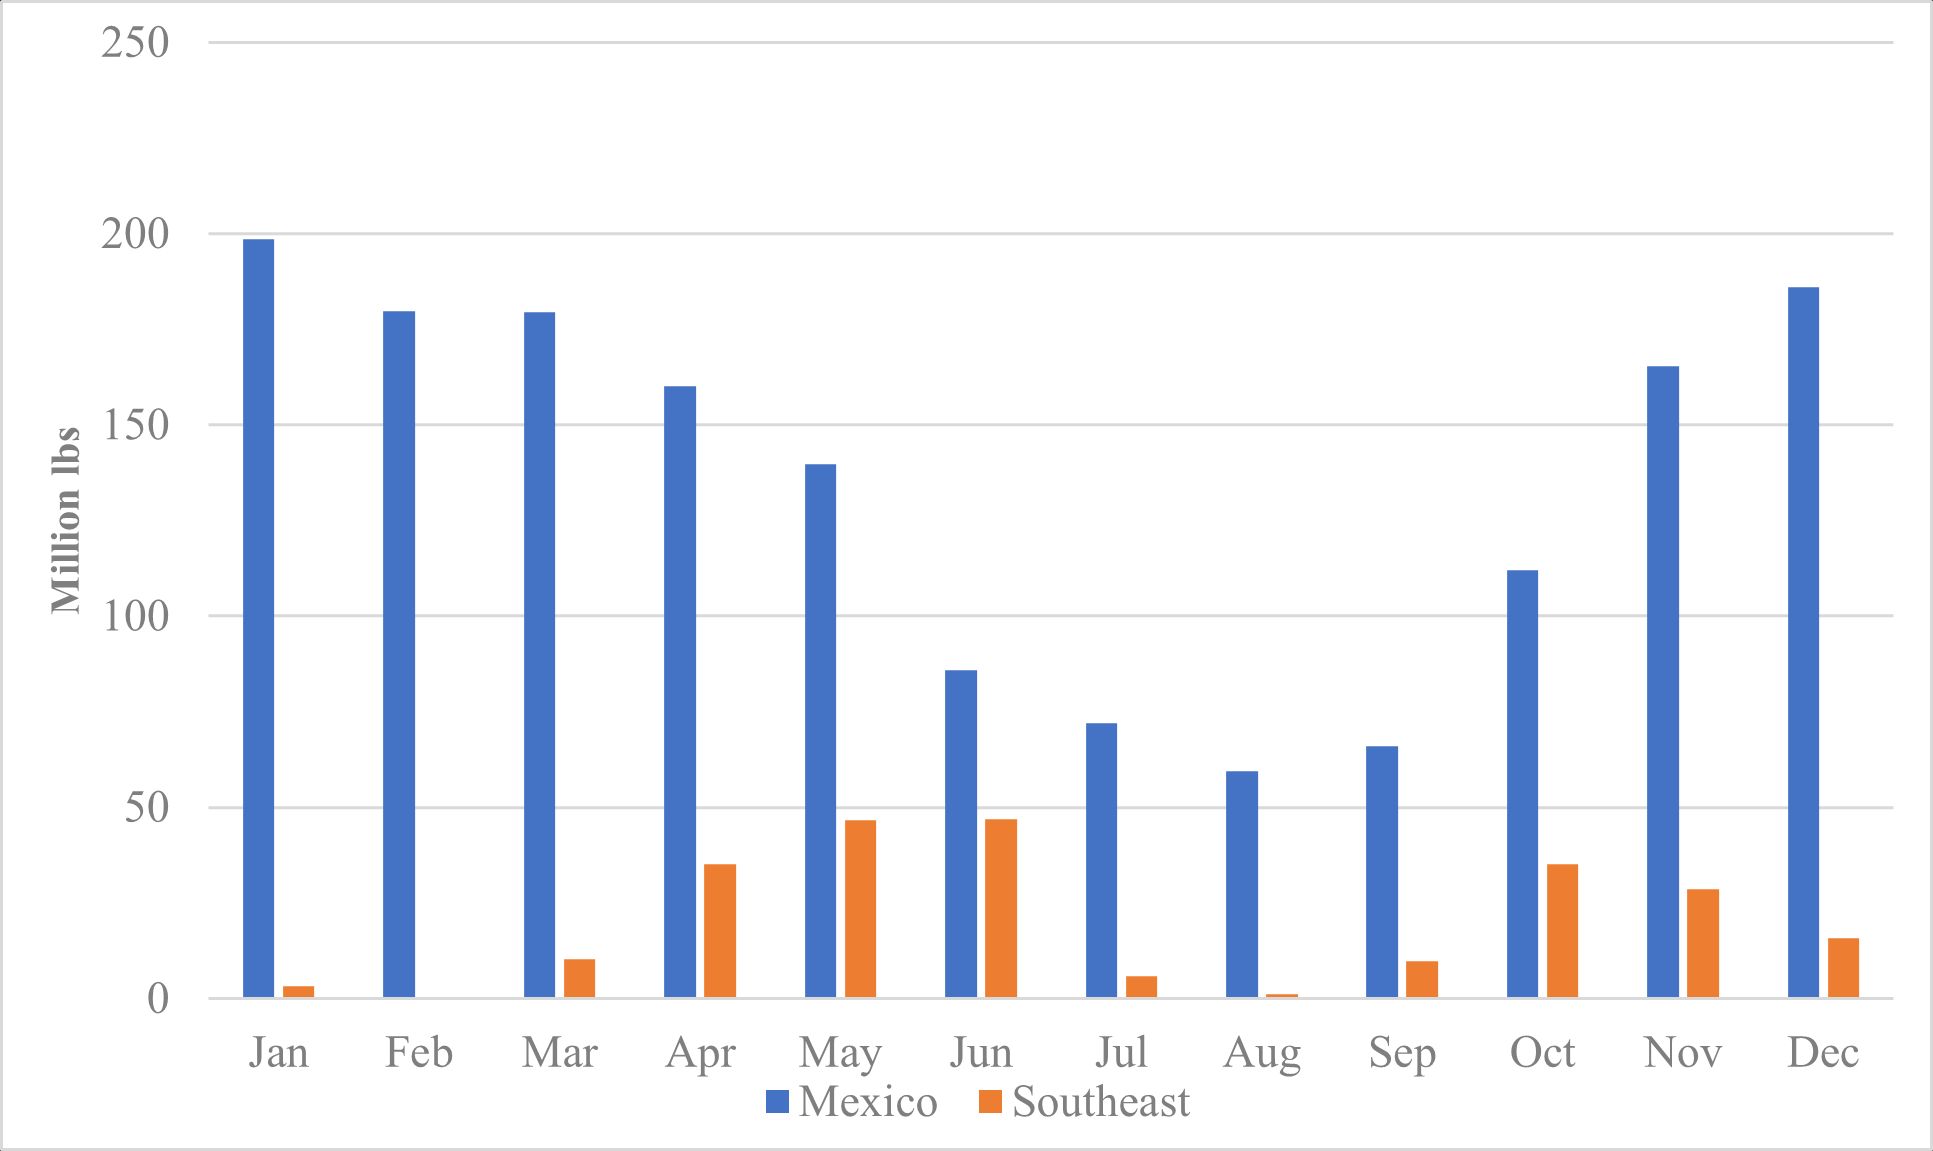
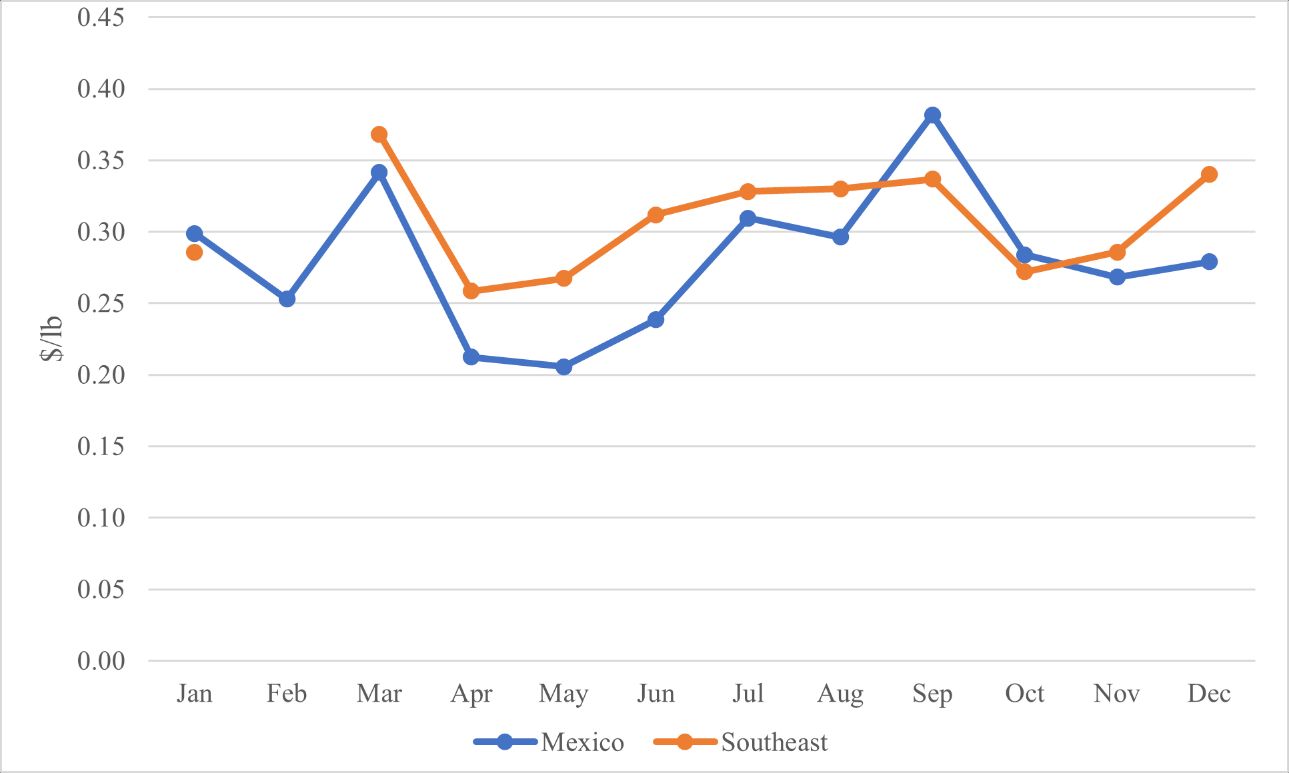
Roughly 85% of the Mexican imports over the period 2015–2020 occurred between October and May (Figure 3). The average monthly prices of Mexican fresh cucumbers during 2015–2020 were lower than the average prices (weighted by production volume) of cucumbers in the three US Southeast states in most months except January, September, and October (Figure 4). The low import price of fresh market cucumbers from Mexico was one of the main forces driving down the prices of domestic fresh cucumbers. In Florida, the largest fresh market cucumber-producing state among the three Southeast states for the past two decades, the real price (measured in year 2000 US dollar value after accounting for inflation) the fresh cucumber growers received decreased by 7% between 2000 and 2020, and by 20% between 2016 and 2020 (USDA-NASS 2021 and USDA-AMS 2021). This decreasing trend contrasts with the rising cost of production over the same years.
Credit: US Census Bureau and USDA-AMS
Credit: USDA-AMS
1 In the calculations for the two percentage changes,the prices during 2000–2017 are from USDA-NASS, and prices during 2018–2020 are the weighted average shipping point prices from USDA-AMS.
Squash Production and Trade
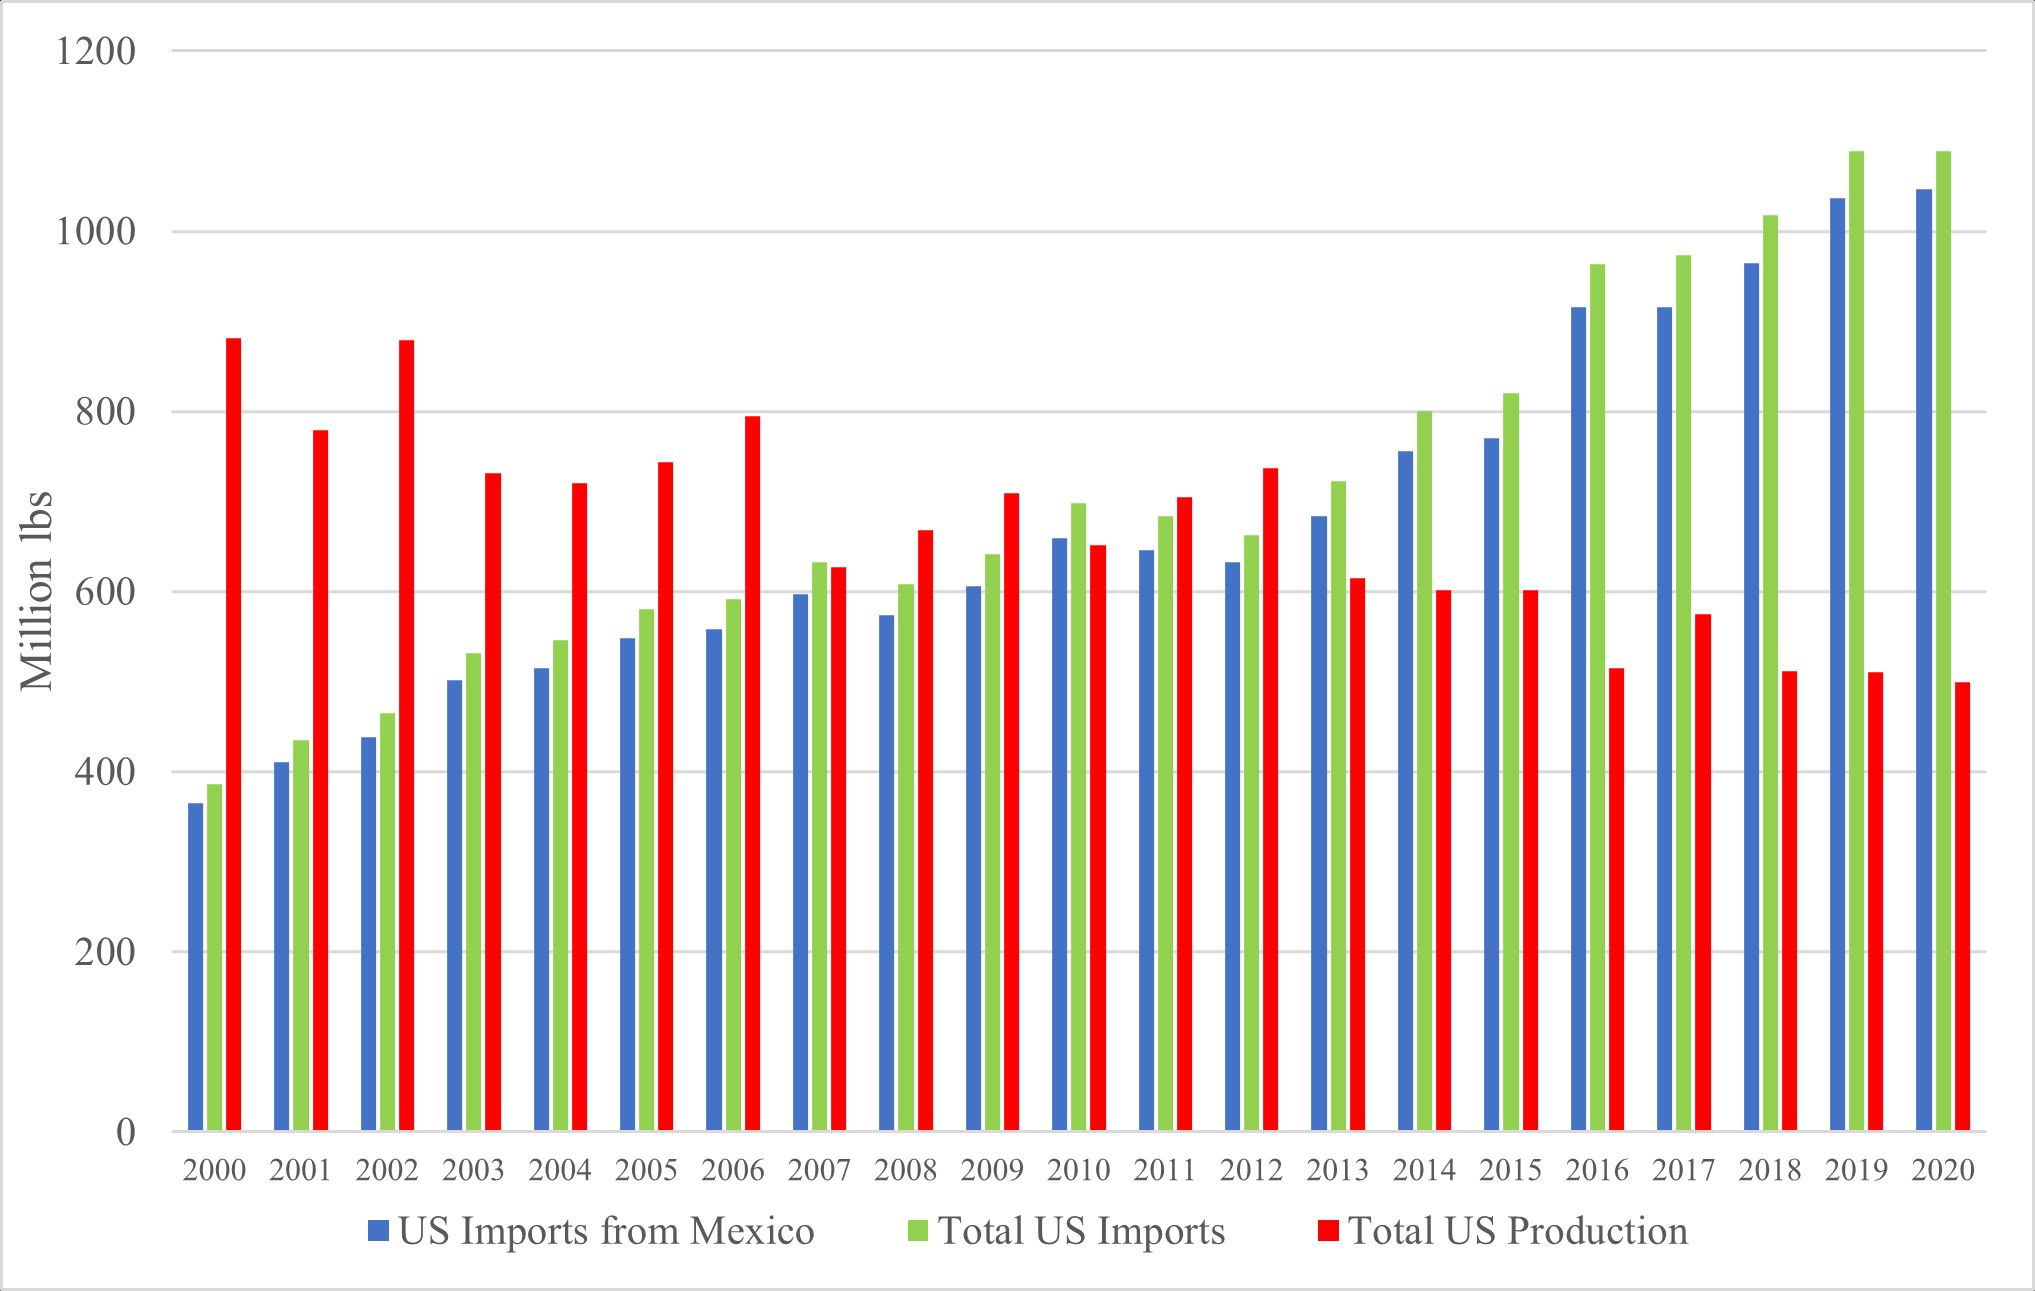
Squash production in the United States has been declining as well. United States total production of fresh squash dropped from 881 million pounds in 2000 to 499 million pounds in 2020, down 43% over 20 years (Figure 5). In contrast, imports consistently grew during this period. Total US imports in 2000 were 386 million pounds, 56% less than US production, compared to 1089 million pounds in 2020, two times higher than US production. Nearly all squash imports were from Mexico, which accounted for 96% of US total imports of fresh squash in 2020.
Credit: US Census Bureau
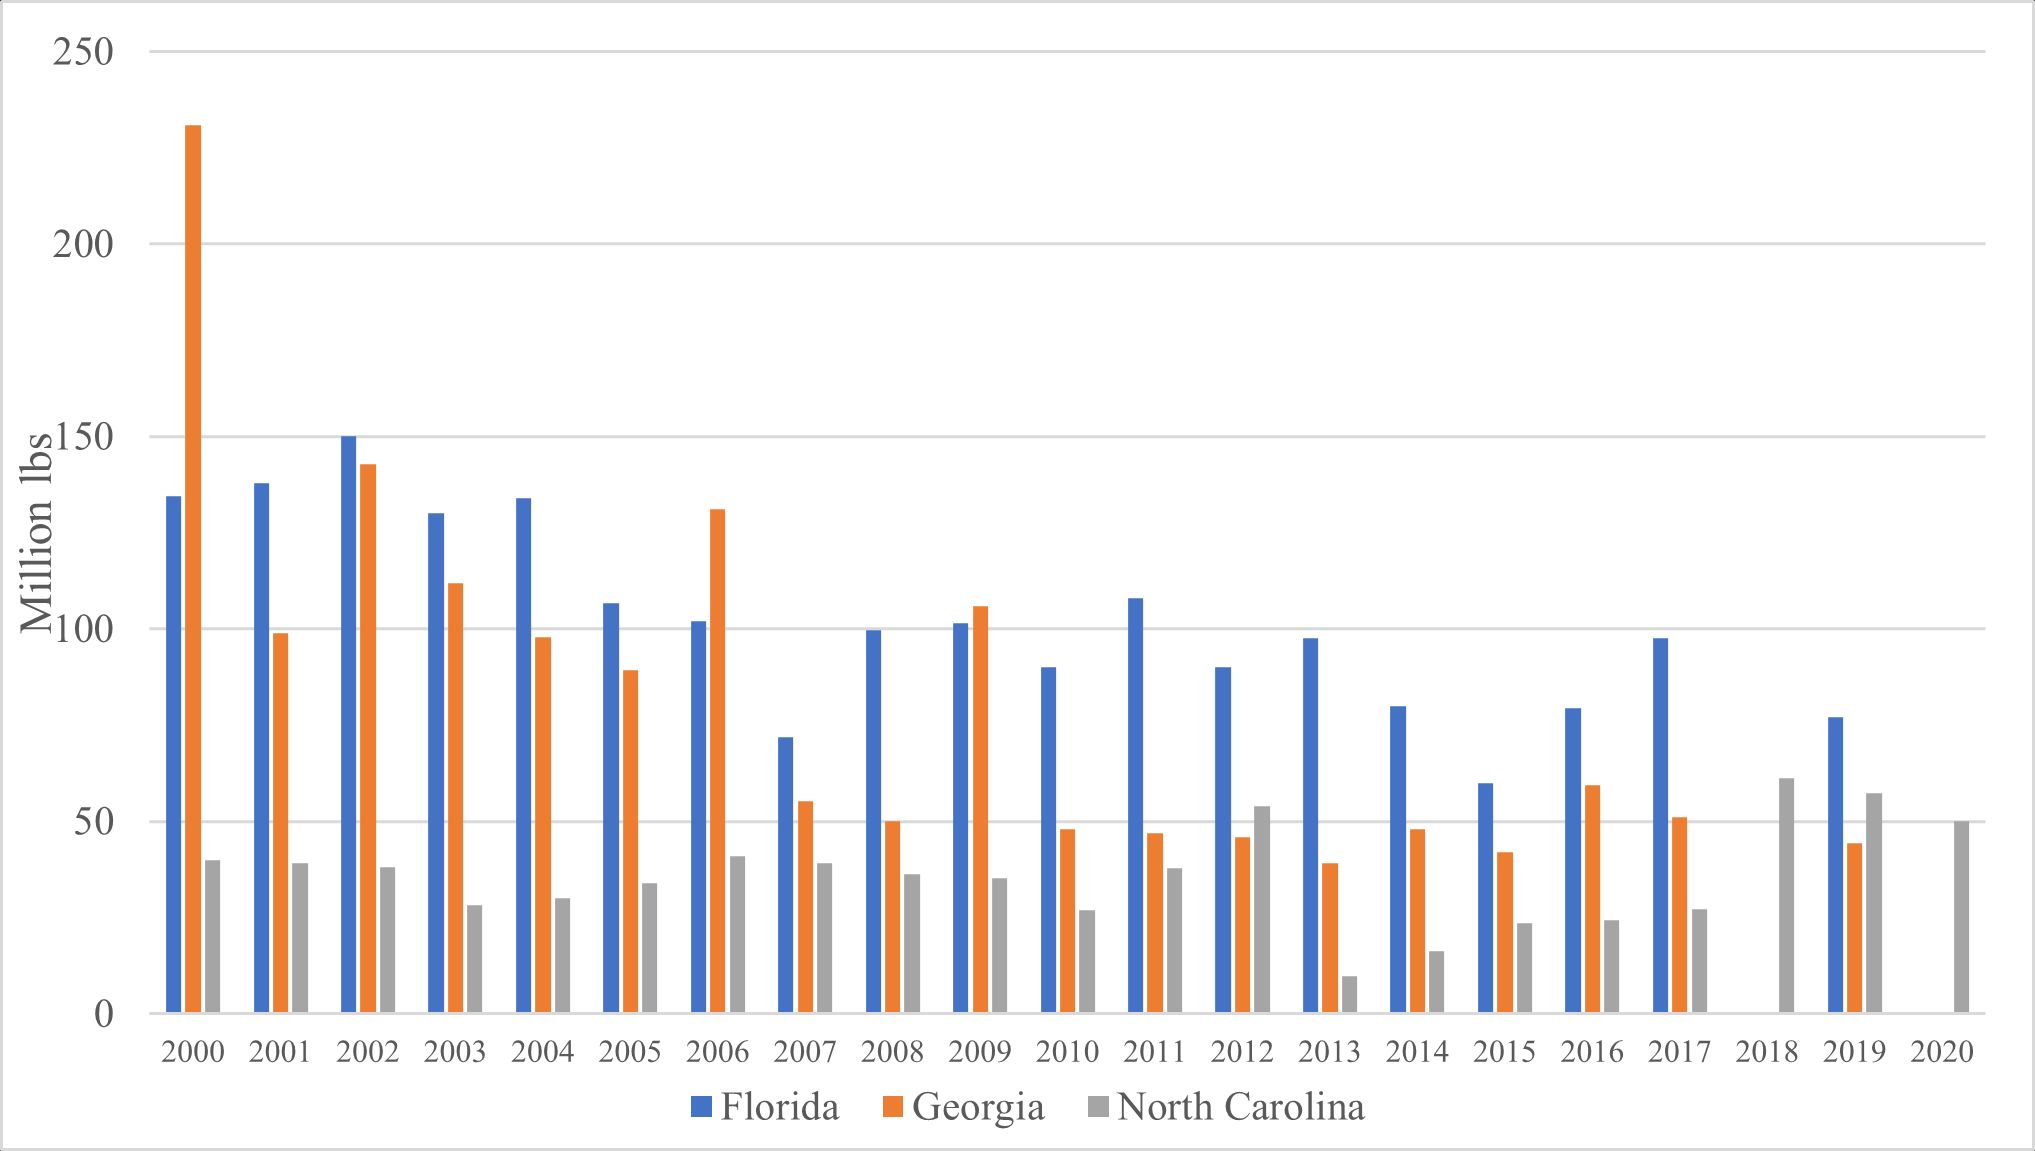
Florida, Georgia, and North Carolina in the US Southeast region are major producers of fresh squash, accounting for 46% of US production in 2000. Their market share decreased to 35% in 2019 due to the rising imports. During the period 2000–2019, production in these three Southeast states dropped from 405 million pounds to 179 million pounds, down nearly 56% (Figure 6). Production in Florida and Georgia over the period dropped by 43% (from 134 million pounds to 77 million pounds) and 81% (from 231 million pounds to 44 million pounds), respectively. In 2000, fresh squash imports from Mexico totaled 365 million pounds, 10% less than the production in the noted three US Southeast states. In 2019, imports from Mexico increased to 1037 million pounds, six times the amount produced in these three US Southeast states and two times the total US production (Figure 6).
Credit: USDA-NASS
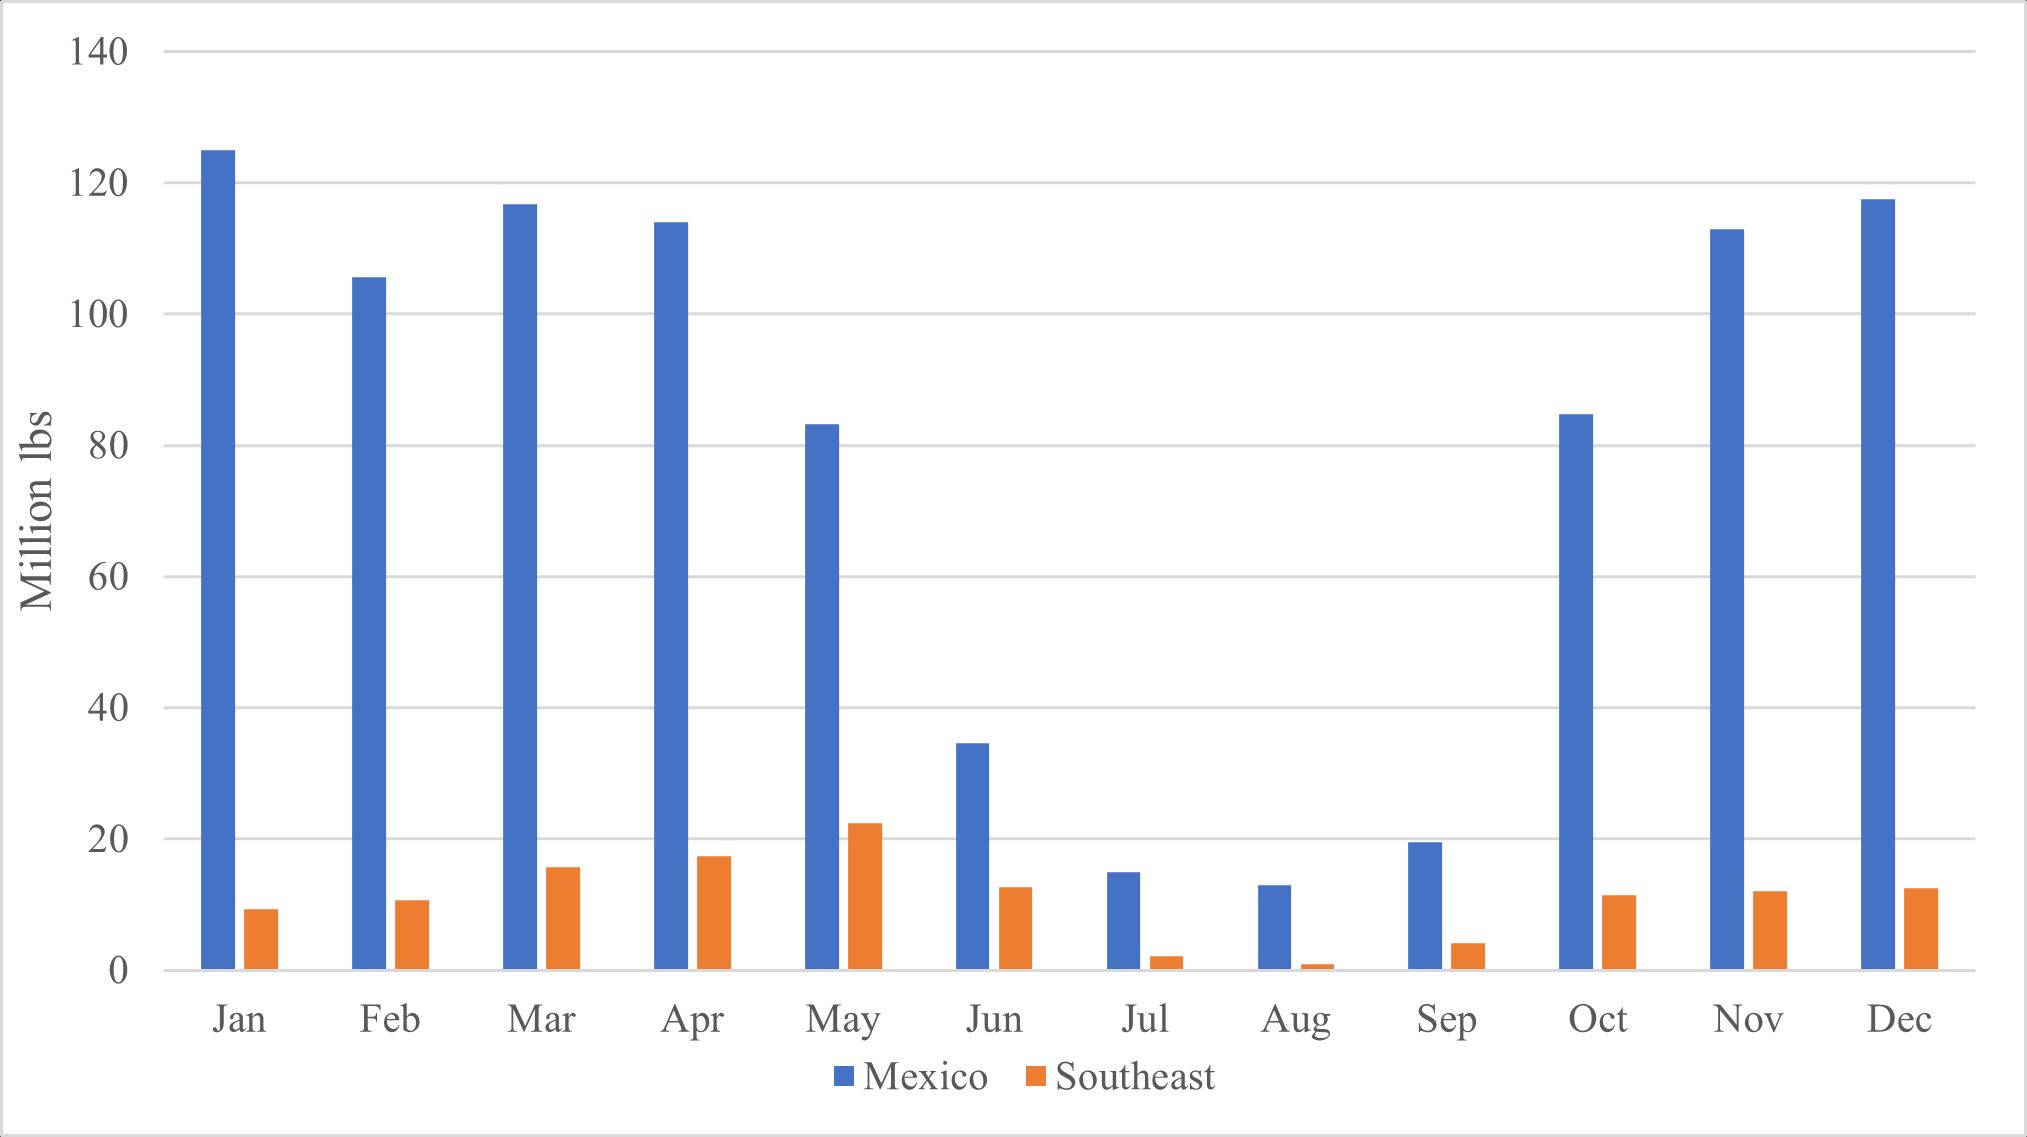
Roughly 70% of the fresh squash production in Mexico was exported to the United States in 2019 (SIAP 2021; US Census Bureau 2021). The Mexican squash production window overlaps that of the three states in the US Southeast region (Huang et al. 2022), concentrated in the fall and spring seasons (Figure 8). Among the Southeast states, the squash harvesting window in Florida is from October through June of the next year (Huang et al. 2022), a period during which over 90% of US imports from Mexico occur (Figure 7).
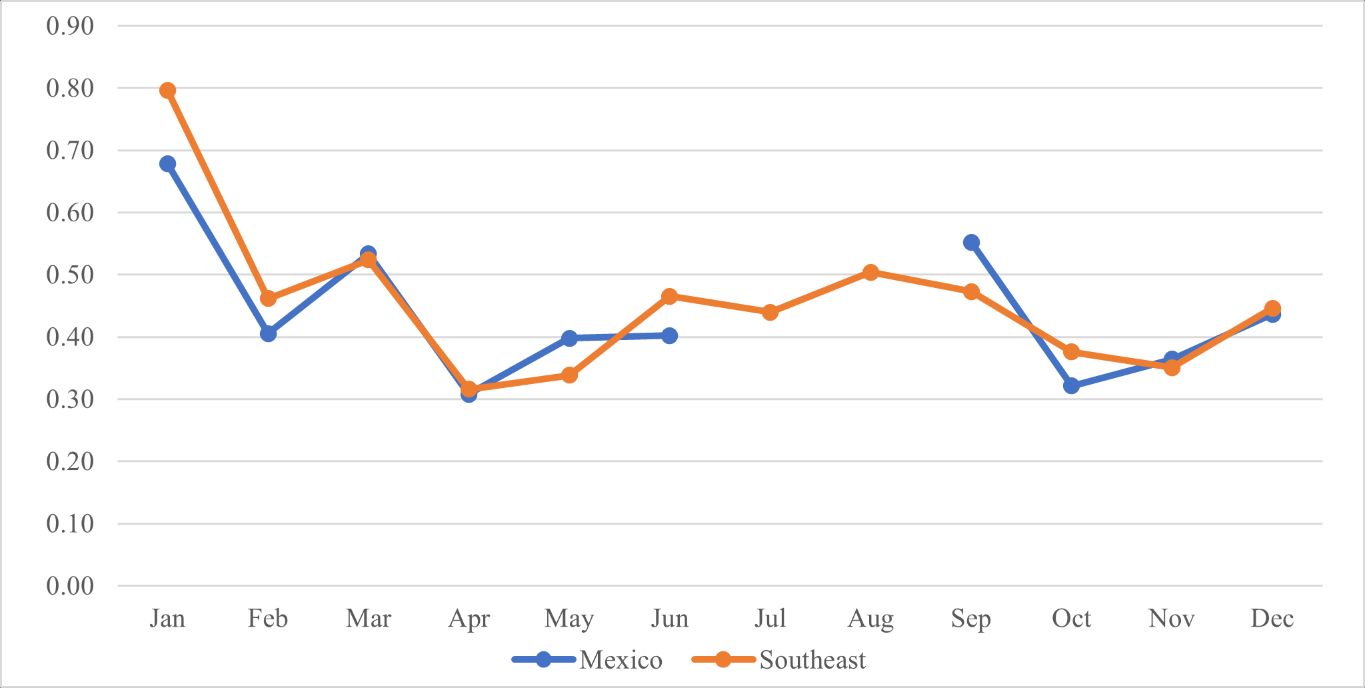
The prices of imported fresh squash were lower than or similar to those of the three US Southeast states, except for May and September (Figure 8). Since 2013, US squash imports from Mexico have accelerated at a fast pace (Figure 5). In Florida, the real price (measured in the year 2000 US dollar value) squash growers received decreased by 6% over the period 2000–2019 and by 45% over the period 2013–2019 (USDA-NASS 2021).
Credit: US Census Bureau; USDA-AMS
Credit: USDA-AMS
2 Total imports from Mexico during 2000–2011 were estimated at 94.4% of total US imports.
Mexican Government Support
Mexico has a significant competitive advantage in labor costs, which is often considered the major factor driving its increasing market share. For producers in developing countries, however, capital usually is a major constraint that could limit the potential of their competitive advantages in labor. To address this challenge, the Mexican government has been subsidizing its fruit and vegetable industry, providing much needed capital to support its development (Wu et al. 2018a).
Mexico’s agricultural subsidy programs, administered by the Secretariat of Agriculture and Rural Development (SADER) under the “National Development Plan” to modernize the Mexican agri-food sector, have boosted its productivity and competitiveness. Under the 2013–2018 National Plan, 11 federal programs were established to achieve the objective. The largest subsidy program is the Agriculture Promotion Program, accounting for 31% of the total subsidy budget in 2018 (Gobierno De Mexico 2021). Another important program that provides subsidies to the Mexican fruit and vegetable industry is the Agri-Food Productivity and Competitiveness Program (AFPCP) (Wu et al. 2021).
The Agriculture Promotion Program contained 11 subprograms in 2014 (SAGARPA 2015). The subprogram of Intensive Production and Agricultural Covers (IPAC) provided support for macro-tunnels, shade houses, anti-hail mesh, and greenhouses. The maximum subsidy amount per project in 2013 was 1.5 million pesos (113,000 USD) for macro-tunnels, 2.4 million pesos (181,000 USD) for shade houses, and 3 million pesos (226,000 USD) for greenhouses (Table 1). In 2019, the maximum amount increased to 4 million pesos (208,000 USD based on the 2019 exchange rate) per project for all four types of protected structures (Table 1) (SAGARPA 2019). The total estimate of subsidies for protected production in Mexico over the period 2001–2018 was approximately 7 billion pesos (550 million USD), primarily for fruit and vegetable production, especially export-oriented production (Wu et al. 2022). In 2019, 96% of the protected acreage was used to produce fruits and vegetables (SIAP 2021).
Table 1. Support rules for intensive production and agricultural covers (IPAC) subprogram, 2013–2019.
Protected Production for Cucumbers
With generous support from the government, protected agriculture has been a fast-growing sector in Mexico. The area dedicated to cucumber production increased sevenfold, from only 1614 acres in 2009 to 14,160 acres in 2018 (Figure 9), accounting for 11.3% of Mexico’s total protected acreage and 29.2% of Mexico’s total cucumber production area (SIAP 2021). The production under protected structures in 2019 reached 1059 million pounds (SIAP 2021), which were primarily for the export market (Wu et al. 2022).
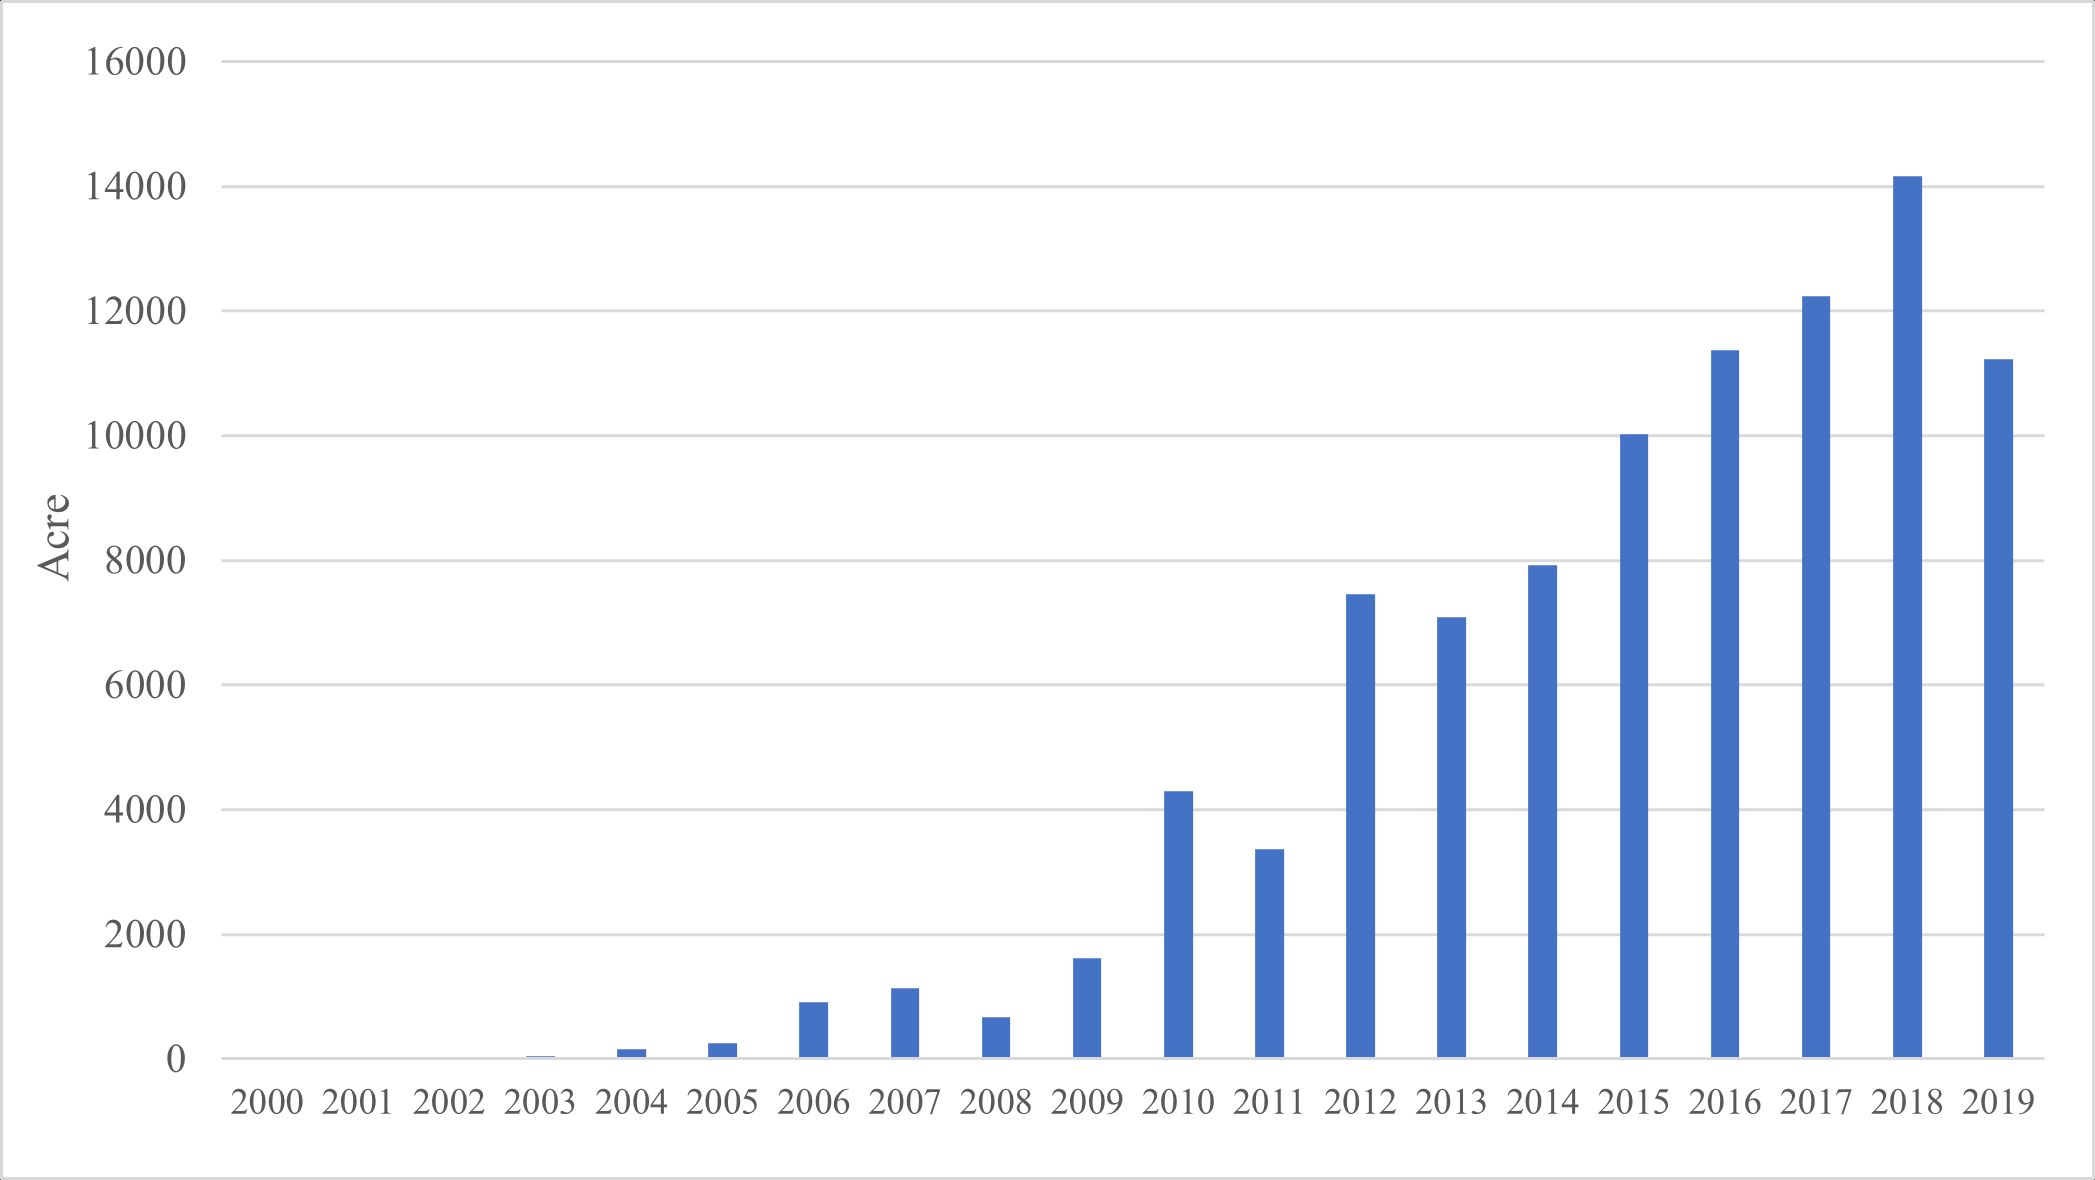
Credit: SIAP Mexico
The use of protected production brings many benefits, including higher yield, better food quality, and extended production and marketing windows. In contrast to the protected production technology used in Mexico, production in the three US Southeast states is mostly open-field. In 2019, Mexico’s cucumber yield under protected structures was 94,310 pounds per acre, almost six times the average yield in the three US Southeast states (SIAP 2021; USDA-NASS 2021). The adoption of protected production technology has enhanced Mexico’s competitiveness. The protected production technology such as the greenhouse systems is also used by some growers in the United States, but the adoption rate is low (Huang et al. 2022). The low adoption rate may be due to the high capital investment requirement and climate factors.
Support for Squash Production
Squash production in Mexico is almost all open-field. Three subprograms (IAP, PP, and AP) under the Agriculture Promotion Program were relevant for squash production. Integral Agricultural Production (IAP) provides incentives to invest in equipment and installations and to purchase vegetative materials. Productive PROAGRO (PP) provides incentives to encourage investment in productive activities, while Agro-Production (AP) provides incentives to improve technologies in crop production.
In addition, three subprograms (AF, AFP, and SSPD) in the Agri-Food Productivity and Competitiveness Program are also relevant (Wu et al. 2021). Access to Financing (AF) provides subsidies to reduce financing costs and expand access to competitive financing. Agri-Food Productivity (AFP) provides subsidies to expand and modernize the capacity of processing and handling of agricultural and fishery products. South-Southeast Productive Development (SSPD) promotes agriculture, fishing, and aquaculture in the South-Southeast area of Mexico.
Government support typically accelerates technology adoption, thus increasing the capacity and competitiveness of the industry. The average yield of Mexican squash in 2019 was about 18,000 pounds per acre, while the yield in the US Southeast states of Florida, Georgia, and North Carolina was only 10,000, 12,000, and 13,000 pounds per acre, respectively (SIAP 2021; USDA-NASS 2021).
Other Support
The government support discussions above are limited to the subsidies given to producers of specific crops under certain programs that could be identified with the available data. There are other programs that provided large support to the fruit and vegetable industry, but the subsidy amount at the crop level is not publicly disclosed. For example, the Irrigation Technology subprogram under the Agriculture Promotion Program is the largest subprogram in terms of budget. In 2014, this subprogram had a budget of 1.6 billion pesos (115 million USD). But information at the crop level is not available. In addition, there are other government support programs targeting various activities throughout the supply chain, from production to postharvest management and marketing (Wu et al. 2018a).
Concluding Remarks
Over the past two decades, cucumber and squash production in the United States has been declining while imports have been increasing rapidly. Among all trading partners, Mexico is the largest source of imports of cucumber and squash into the US market. The rapid growth of imports from Mexico has posed challenges to US domestic cucumber and squash producers. The US southeastern states are the most affected regions as their seasons overlap with those of Mexico. Other crops in the region such as tomatoes (Guan et al. 2018; Wu et al. 2018b; Li et al. 2021), peppers (Biswas et al. 2018), and berries (Suh et al. 2017; Wu and Guan 2021) also face similar challenges.
Given Mexican cost advantages and large production and export capacities boosted by government support, US imports of cucumbers and squash from Mexico are expected to continue to increase, and US domestic production may see further declines. This situation has caused concerns about US domestic industry viability. The rapid decline of domestic production has been under heated debate among policymakers and industry stakeholders. Some of the major concerns include increasing dependence on foreign food supply and the consequences of a declining agricultural sector, especially in the southeastern states such as Florida that face both subsidized foreign competition and high urbanization pressure.
References
Biswas, T., Z. Guan, and F. Wu. 2018. An Overview of the US Bell Pepper Industry. FE1028. EDIS 2018 (2). https://doi.org/10.32473/edis-fe1028-2017
Gobierno De Mexico, 2021. Proyecto del Presupuesto de Egresos de la Federación 2018. Available online: https://www.ppef.hacienda.gob.mx/es/PPEF2018/analiticos_presupuestarios
Guan, Z., T. Biswas, and F. Wu. 2018. The US Tomato Industry: An Overview of Production and Trade. FE1027. EDIS 2018 (2). https://doi.org/10.32473/edis-fe1027-2017
Huang, K.M., Z. Guan, and A.M. Hammami. 2022. The U.S. Fresh Fruit and Vegetable Industry: An Overview of Production and Trade. Agriculture 2022, 12(10), 1719. https://doi.org/10.3390/agriculture12101719
Li, S., F. Wu, Z. Guan, and T. Luo. 2021. How Trade Affects the US Produce Industry: The Case of Fresh Tomatoes. International Food and Agribusiness Management Review 25(1), 121–133. https://doi.org/10.22434/IFAMR2021.0005
Secretaría de Agricultura, Ganadería, Desarrollo Rural, Pesca, y Alimentación (SAGARPA). 2015. Diario Oficial de la Federación.
Secretaría de Agricultura, Ganadería, Desarrollo Rural, Pesca, y Alimentación (SAGARPA). 2019. Diario Oficial de la Federación.
Servicio de Información Agroalimentaria y Pesquera (SIAP). 2021. Food and Agricultural Atlas. Ciudad de México: SIAP. Available online: http://nube.siap.gob.mx
Suh, D. H., Z. Guan, and H. Khachatryan. 2017. The impact of Mexican Competition on the US Strawberry Industry. International Food and Agribusiness Management Review 20:591–604. https://doi.org/10.22434/IFAMR2016.0075
U.S. Census Bureau. 2021. USA Trade Online. Washington, D.C.: U.S. Census Bureau. Available online: https://usatrade.census.gov
U.S. Department of Agriculture, Agricultural Marketing Service (USDA-AMS). 2021. Specialty Crop Market News Portal. Washington, D.C.: U.S. Department of Agriculture. Available online: https://www.marketnews.usda.gov/mnp/fv-home
U.S. Department of Agriculture, Foreign Agricultural Service (USDA-FAS). 2021. Global Agricultural Information Network. Washington, D.C.: U.S. Department of Agriculture. Available online: https://gain.fas.usda.gov/Pages/Default.aspx
U.S. Department of Agriculture, National Agricultural Statistics Service (USDA-NASS). 2021. Quick Stats. Washington, D.C.: U.S. Department of Agriculture.
Wu, F., B. Qushim, M. Calle, and Z. Guan. 2018. “Government Support in Mexican Agriculture.” Choices 33 (3): 1–11.
Wu, F., A. Soto-Caro, and Z. Guan. 2021. “Government Support in Mexican Agriculture: The agri-food productivity and competitiveness program.” FE1107, EDIS 2021(6). https://doi.org/10.32473/edis-fe1107-2021
Wu, F., Z. Guan and D. H. Suh. 2018b. “The Effects of Tomato Suspension Agreements on Market Price Dynamics and Farm Revenue.” Applied Economic Perspectives and Policy 40 (2): 316–332. https://doi.org/10.1093/aepp/ppx029
Wu, F., and Z. Guan. 2021. An Overview of the Mexican Blueberry Industry. FE1106. EDIS 2021 (6) https://doi.org/10.32473/edis-fe1106-2021
Wu, F., Z. Guan, and K. Huang. 2022. “Protected Agriculture in Mexico.” University of Florida, FE1124. EDIS 2022 (6). https://doi.org/10.32473/edis-FE1124-2022