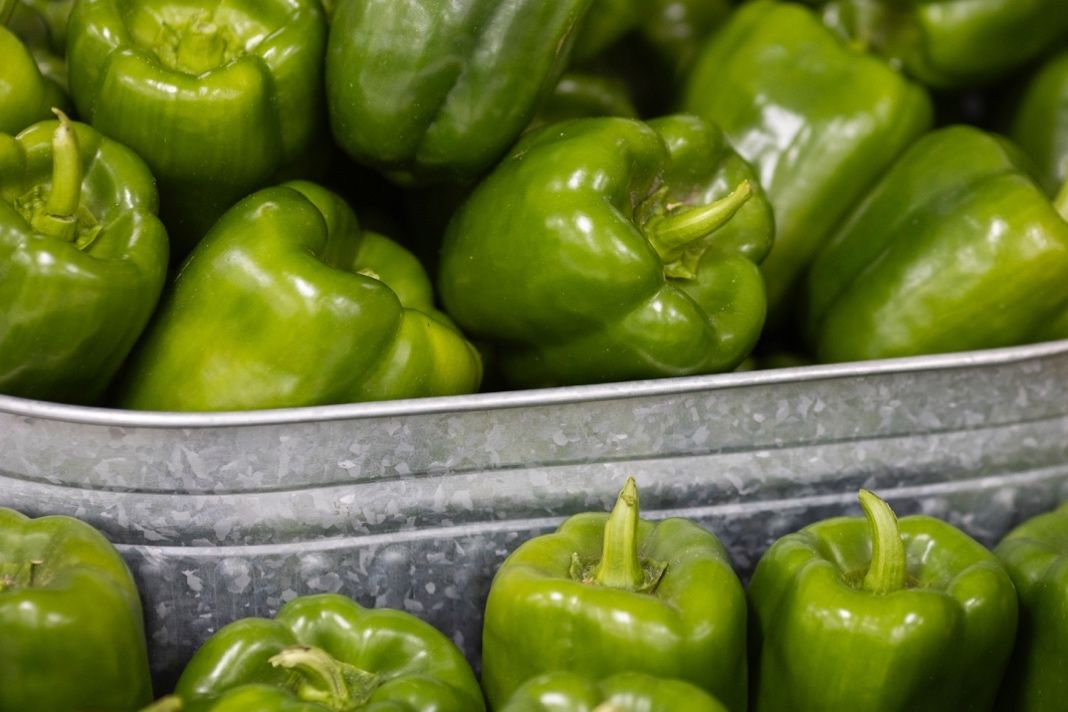
Credit: UF/IFAS Extension file photo
Introduction
Bell pepper is a warm-season crop grown during frost-free periods. In the United States, bell peppers are cultivated for both fresh and processed markets, with California, Florida, and Georgia producing most of the crop. Production practices vary across states, with most bell peppers transplanted in double rows on plastic-covered raised beds and irrigation ranging from drip to seepage systems (Western Institute for Food Safety and Security 2016). The harvest windows among these states also vary greatly, affecting production and prices. The Georgia harvest window is from May to October, a similar timeframe as many other pepper-producing states. The California and Florida harvest windows are much longer, with the Florida harvest window extending from October to June (FDACS 2020) and the California window extending year-round (The Blue Book 2024).
This report provides information on conventional bell pepper acreage, volume, and pricing for the top three producing states: California, Florida, and Georgia. These top three states account for 82.7% of volume produced in 2022 (USDA-NASS 2023). Michigan, New Jersey, and North Carolina also produce large quantities of bell pepper (17.3% of volume produced in 2022 [USDA-NASS 2023]) but are not included in this report because of inconsistencies regarding how acres are reported, prices received, and yield over the 13-year period. This is one of a series of EDIS publications that illustrate trends in Florida’s five most economically important specialty crops, excluding citrus: bell peppers, tomatoes, watermelons, sweet corn, and strawberries. The information in it will be useful to producers, Extension agents, and others interested in specialty commodity crop trends. Each report serves as a single location where important information about the market and production trends for that specialty crop can be found.
Data
Data on acres harvested, prices received, and the production value per acre for conventional bell peppers were obtained from the United States Department of Agriculture National Agricultural Statistics Services (USDA-NASS). We averaged the data over the market year, which allowed us to show trends in bell pepper production and prices over time. The 2020 data for harvest acres were missing for Georgia and Florida, so we imputed them using a linear average extrapolation approach. To assess marketable bell pepper volume on a year-to-year basis, we examined truck shipment (movement) data from the USDA Agricultural Marketing Service (USDA-AMS). Movement data describes the volume of bell pepper transported domestically in 40,000-lb-capacity refrigerated trucks. These transportation data show movement across the interstate highway system from farms to distribution centers and to destinations for international shipments. They do not include bell peppers transported via box trucks or by rail or other means.
We obtained aggregate yearly data for bell pepper from 2010 to 2023 in the top three producing states listed above. Below, we show trends of acres of conventional bell pepper harvested, price per cwt (100 pounds), the value of production per acre, and volume of bell pepper transported by 40,000-lb-capacity refrigerated trucks.
Harvested Acreage
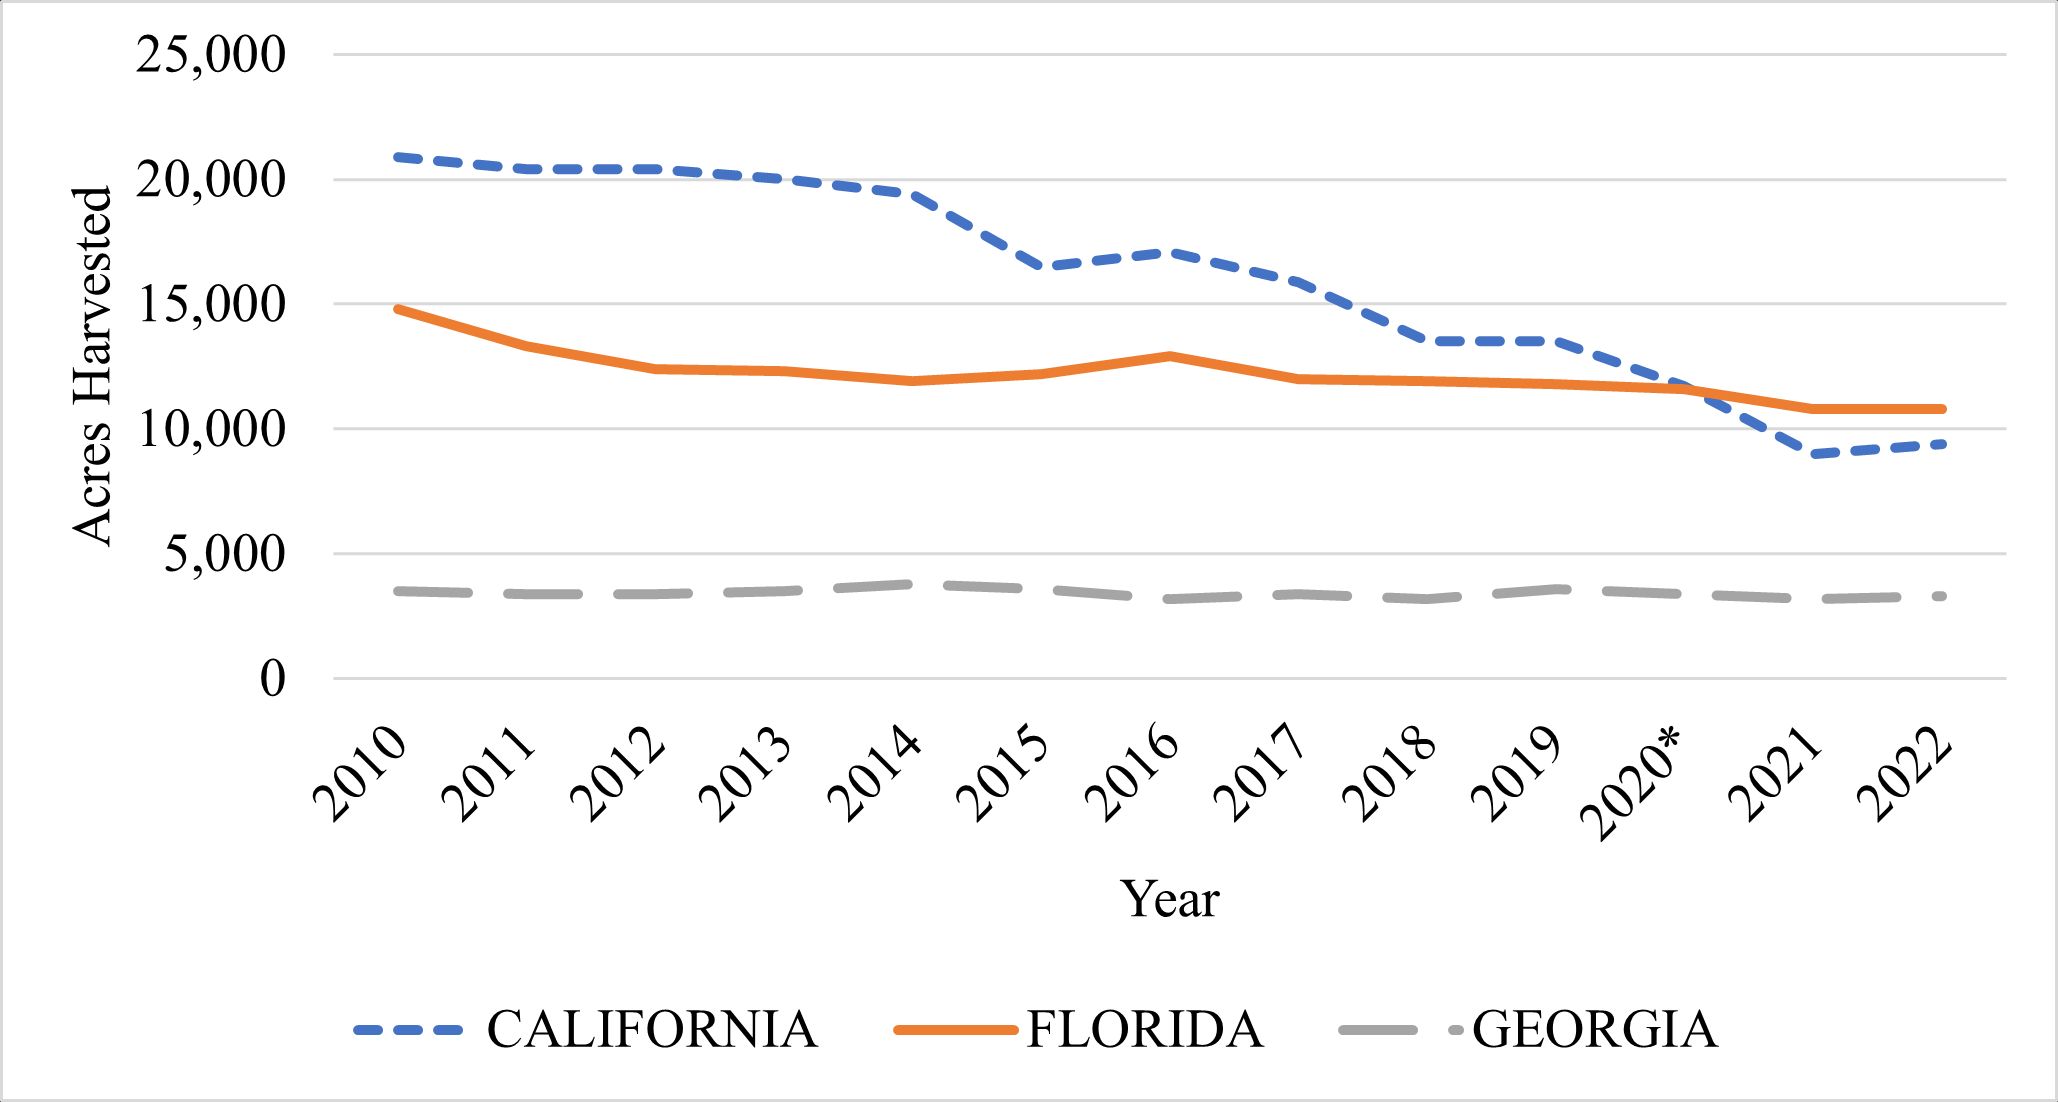
On average, over the past 12 years (excluding 2020), California led bell pepper harvested acres with 15,976 acres per year. In Florida and Georgia, the average acres harvested were 12,258 and 3,425 acres per year, respectively, over the past 12 years, excluding 2020. California and Florida are the two largest producers in the nation, but each saw steady declines in bell pepper harvested acres over the past 13 years. One reason for this is increased import competition from Mexico and Canada (Biswas et al. 2018; USDA-ERS 2020). For example, while total United States pepper production from 2000 to 2015 remained steady at around 1.6 billion lb., Mexican imports rose by approximately 294%, from 300 million to 900 million lb. (Biswas et al. 2018). In more recent years, reasons for declines in harvested acres may also include unfavorable weather conditions. For example, in 2020, California saw a sharp decline in acres due to high temperatures during the summer accompanied by fires on croplands and thick layers of smoke limiting sunlight for months (USDA-NASS 2021a). In 2021 and 2022, harvested acres in Florida surpassed those in California. Acres harvested in Georgia were steady over the 13-year period.
Credit: USDA-NASS
*Bell pepper acres values in 2020 for Florida and Georgia are missing. These data were estimated using linear average extrapolation.
Price Trends
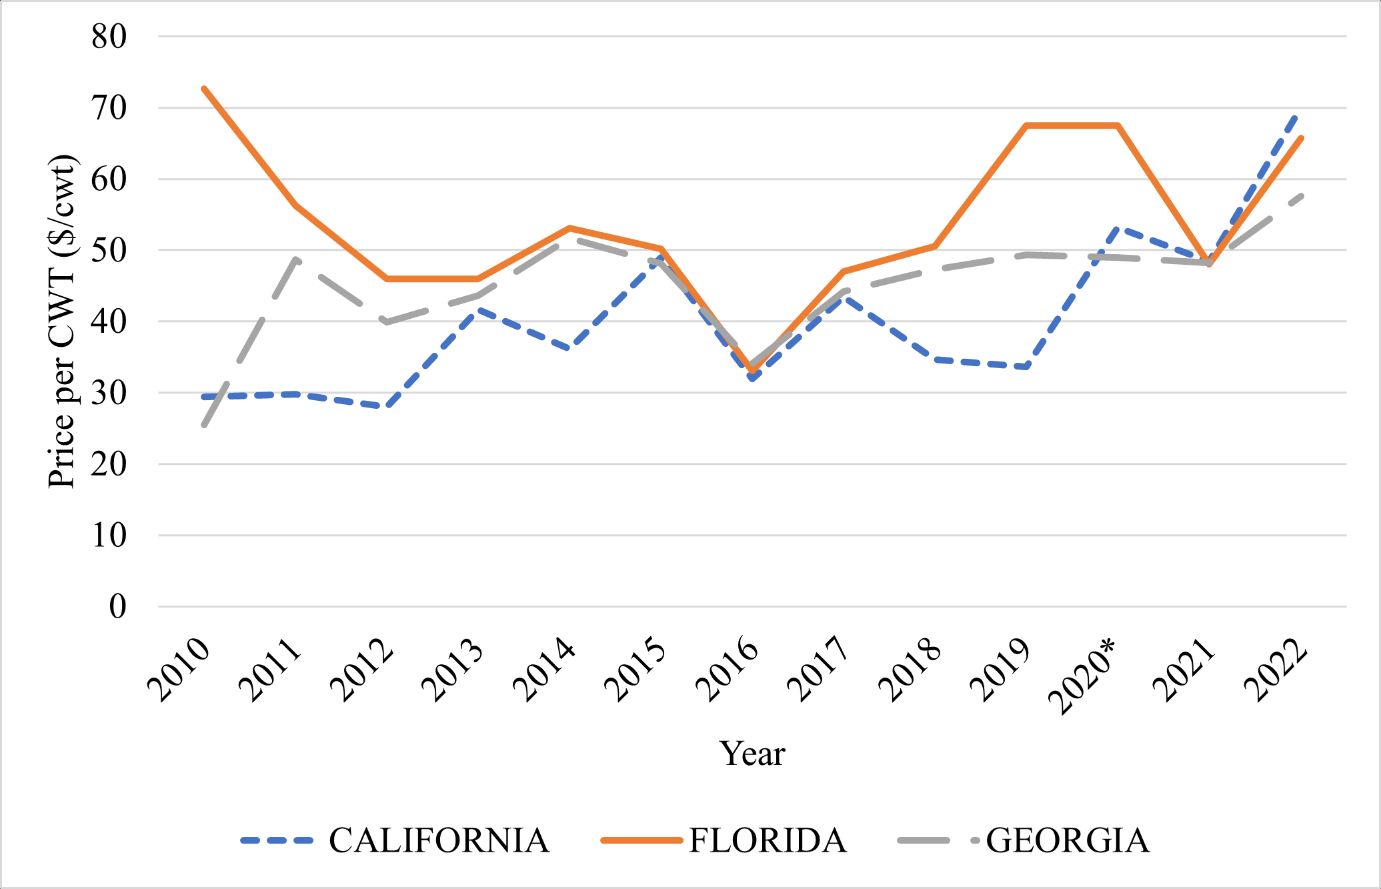
Figure 3 shows trends in prices received for bell peppers for each of the three states studied. Bell pepper prices fluctuated from 2010 to 2020, and the suggested reason is increasing imports from Mexico (Biswas et al. 2017). Over the past 13 years, the price per cwt in Florida peaked at over $70 in 2010 compared to peaks at $53 in 2020 for California and $52 in 2014 for Georgia. In general, prices received by weight fell substantially in 2016 relative to 2015. For Florida and Georgia, prices steadily rose after 2016, but for California, prices continued to fall until 2020. For Florida, despite a sharp decline in 2016, bell pepper prices rebounded, reaching $67.50 per cwt in 2019.
Credit: USDA-NASS
*Bell pepper prices per cwt in 2020 for Florida and Georgia were estimated using a moving average extrapolation method. Estimates are presented in nominal terms.
Value Per Acre
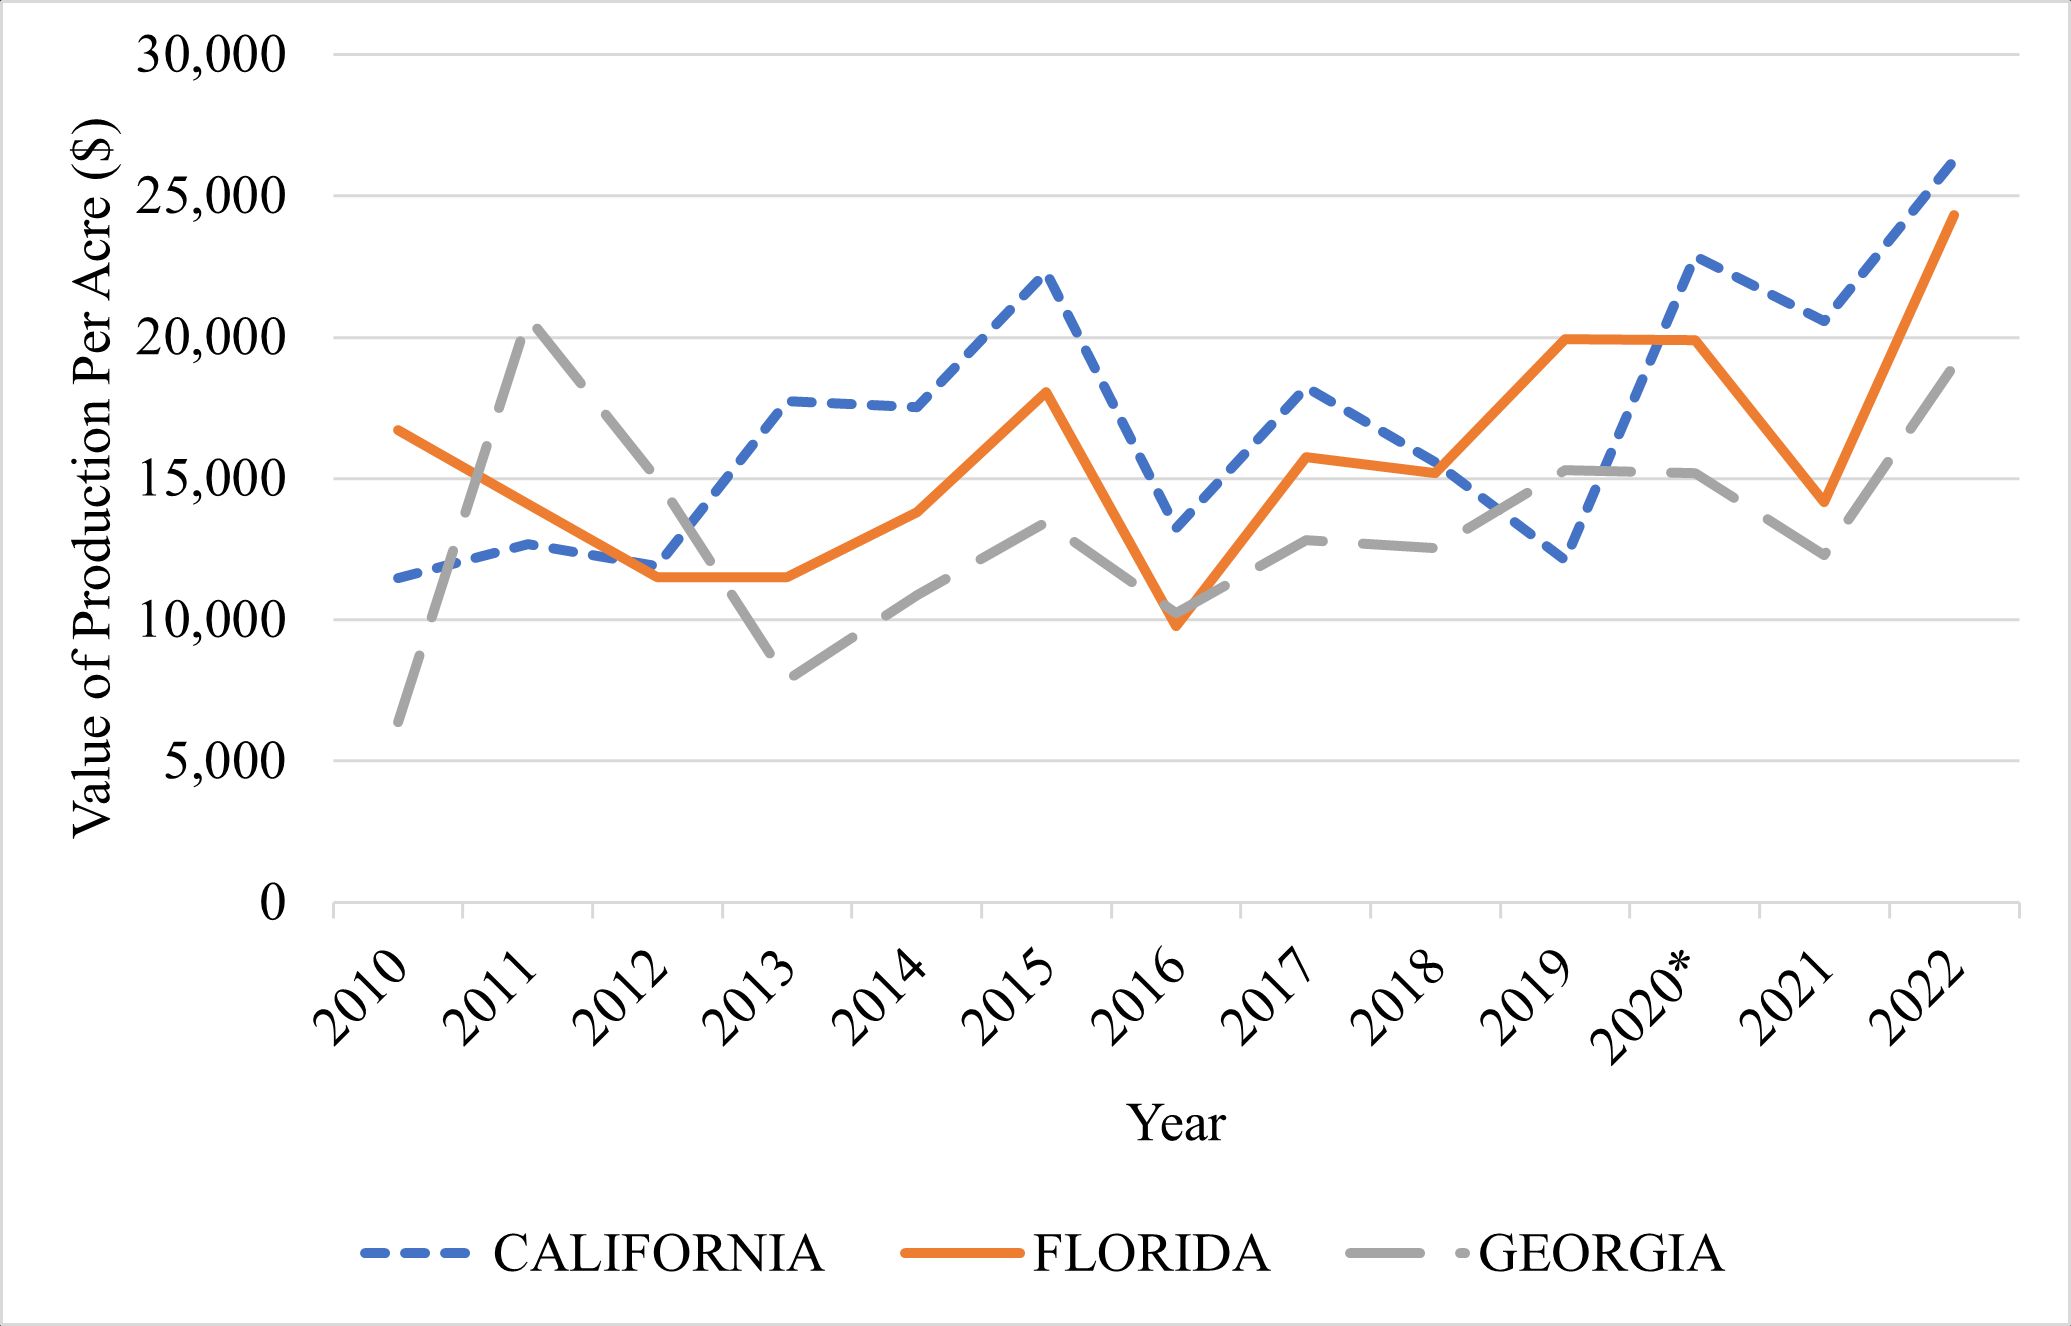
Related to prices and production, Figure 4 shows the value of production in dollars per acre. This is the yield per acre multiplied by the price of bell pepper harvested over time. Over the past 13 years, California has led other states in average value of production with $17,106 per acre per year. Florida follows with $15,740 per acre per year. Outside of a peak of almost $21,000 in 2011, Georgia has the lowest average value of production ($13,197 per acre per year). California showed a sharp increase in value of production from 2019 to 2020, but each state showed substantial declines in value of production for 2021, relative to 2020. However, in 2022 each state showed a sharp increase in value of production relative to 2020 and 2021. Over the 13-year period, the value of production peaked for California and Florida in 2022 at $26,250 per acre and $24,309 per acre, respectively. Given the peaks and dips observed in the previous years, it is unclear how long these values will be sustained.
Credit: USDA-NASS
* Bell pepper prices per cwt in 2020 for Florida and Georgia was estimated using a moving average extrapolation.
Volume Shipped
During transportation, fresh produce becomes susceptible to physical, chemical, and microbial contamination (Malekian et al. 2015). As a result, temperature-controlled trucks are the standard mode of transportation for bell peppers in the United States (Truckload Shipping, 2020). Figure 5 shows the volume of bell peppers shipped by refrigerated truck for the top three producing states. All the top producing states had their peak shipments between 2011 and 2016. The largest amount shipped by truck in California was 439.95 million lb. in 2011. The largest amount shipped by truck in Florida was 396.96 million lb. in 2015, and in Georgia it was 148.37 million lb. in 2016. In general, the volume of conventional bell peppers transported steadily declined from 2016. Florida and Georgia showed the largest decreases in 2017 relative to 2016 with 20% less volume shipped for Florida and 19% less shipped for Georgia. Another notable decline was in 2020, with all leading states registering their lowest truck shipments between 2020 and 2022.
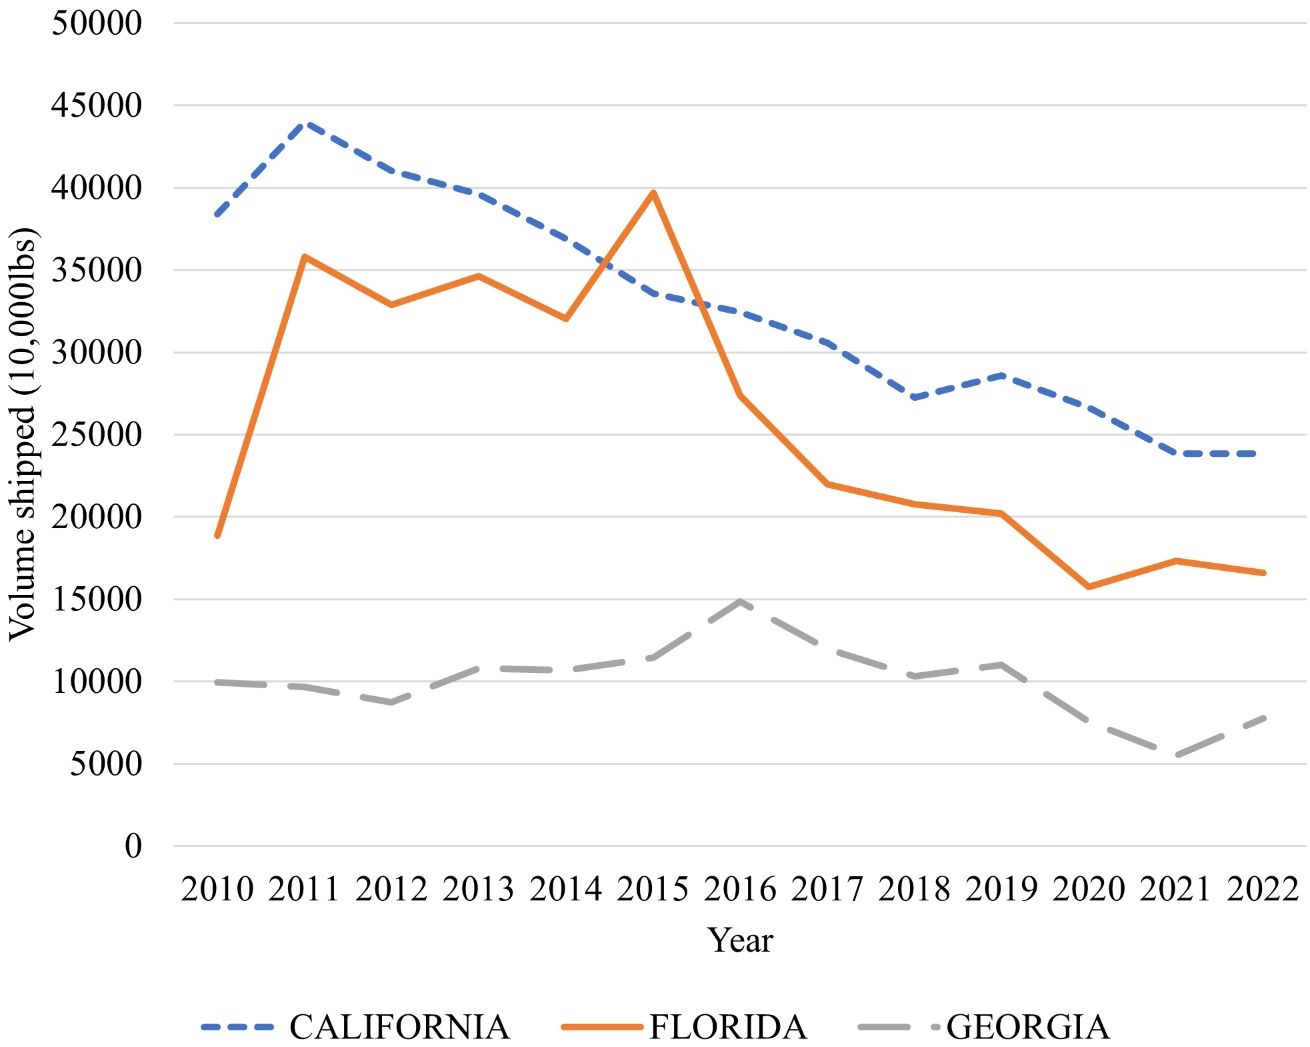
Credit: USDA-AMS
Summary
This publication provides trends in bell peppers acres, production, prices, and transport for Florida and other top-producing states. These data show that Florida is the second largest bell pepper producer. Though acres harvested and volume shipped have declined over the review period, the value per acre of Florida production has increased in recent years. Over the 13-year period, value of production peaked for California and Florida in 2022. The trends presented here indicate that acres harvested are decreasing slowly for Florida and sharply for California. Decreases in acres harvested will naturally lead to reduced volume of bell pepper shipped, but if prices continue to increase, value of production in all three states is expected to rise. Whether Florida will surpass California in terms of value of production will depend on prices and whether California growers can overcome recent fires and related incidents and return to pre-2020 harvested acres. Prices are affected by consumer demand and quantity supplied by the market, and this is directly impacted by bell pepper imports. This report does not include analysis on imported bell peppers, yet it provides updated figures suggesting that trade impacted domestic production. Interested readers can review Biwas et al. (2018) for historical trends of imported bell pepper. Finally, this report does not account for inflation in the presented price trends and value of production over time.
Acknowledgments
This work is supported by the USDA National Institute of Food and Agriculture, Specialty Crops Research Initiative project award 2019-51181-30010 and the Multi-State Hatch FL-SWF-005724, “Economic Valuation and Management of Natural Resources on Public and Private Lands (W5133).”
Reference
Biswas, T., Z. Guan, and F. Wu. 2018. An Overview of the US Bell Pepper Industry. FE1028. Gainesville: University of Florida, Institute of Food and Agricultural Sciences. https://edis.ifas.ufl.edu/publication/FE1028
Florida Department of Agriculture and Consumer Services (FDACS). 2020. Harvest of the Month. Classroom Guide Middle School. https://ccmedia.fdacs.gov/content/download/83352/file/HOM_BellPepper_6-8-V2-FINAL.pdf<
Huang K-M., Z. Guan, and A. Hammami. 2022. "The U.S. Fresh Fruit and Vegetable Industry: An Overview of Production and Trade." Agriculture 12 (10): 1719. https://doi.org/10.3390/agriculture12101719
Malekian F., A. Adhikari, C. Graham, K. Fontenot, and M. L. L. Ivey. 2015. Transportation of Fresh Produce: Best Practices To Ensure On-farm Food Safety. Louisiana State University AgCenter. https://www.lsu.edu/agriculture/plant/extension/hcpl-publications/2_Pub.3442-TransportationofFreshProduce-BestPracticestoEnsureOn-FarmFoodSafety.pdf
The Bluebook. 2024. Pepper Market Summary. (Accessed March 2024.) https://www.producebluebook.com/know-your-produce-commodity/peppers/
Tridge. 2022. Fresh Bell Pepper. (Accessed June 2023.) https://www.tridge.com/intelligences/bell-pepper/production
Truckload Shipping. 2020. How Are Bell Peppers Transported? https://usatruckloadshipping.com/how-are-bell-peppers-transported/#:~:text=The%20main%20means%20of%20transport,refrigerated%20container%20within%20the%20truck
USDA-AMS (United States Department of Agriculture, Agricultural Marketing Service). 2021. Fruits and Vegetables Market News. USDA-AMS, Washington, DC https://www.marketnews.usda.gov/mnp/fv-report-top-filters?locName=&commAbr=PEP&commName=PEPPERS,%20BELL%20TYPE&className=VEGETABLES&rowDisplayMax=25&startIndex=1&navClass=VEGETABLES&navType=byComm&repType=termPriceDaily&type=termPrice
USDA-NASS (United States Department of Agriculture, National Agricultural Statistics Service Information). 2021a. Vegetables 2020 Summary. USDA-NASS, Washington, DC. https://downloads.usda.library.cornell.edu/usda-esmis/files/02870v86p/j6731x86f/9306tr664/vegean21.pdf
USDA-NASS (United States Department of Agriculture, National Agricultural Statistics Service Information). 2023. Quick Stats. USDA-NASS, Washington, DC. https://www.nass.usda.gov/Quick_Stats/
USDA-NASS (United States Department of Agriculture, National Agricultural Statistics Service Information). 2021b. Quick Stats. USDA-NASS, Washington, DC. https://www.nass.usda.gov/Quick_Stats/
USDA-NASS (United States Department of Agriculture, National Agricultural Statistics Service Information). 2022. Vegetables 2021 Summary. USDA-NASS, Washington, DC. https://downloads.usda.library.cornell.edu/usda-esmis/files/02870v86p/zs25zc490/9593vz15q/vegean22.pdf
USDA-NASS (United States Department of Agriculture, National Agricultural Statistics Service Information). 2023. Vegetables 2022 Summary. USDA-NASS, Washington, DC. https://downloads.usda.library.cornell.edu/usda-esmis/files/02870v86p/hq37x121v/4b29ck28c/vegean23.pdf
Western Institute for Food Safety and Security. 2016. Bell and Chile Peppers. University of California Davis. (Accessed July 2022) https://www.wifss.ucdavis.edu/wp-content/uploads/2016/10/Peppers_PDF.pdf