Introduction
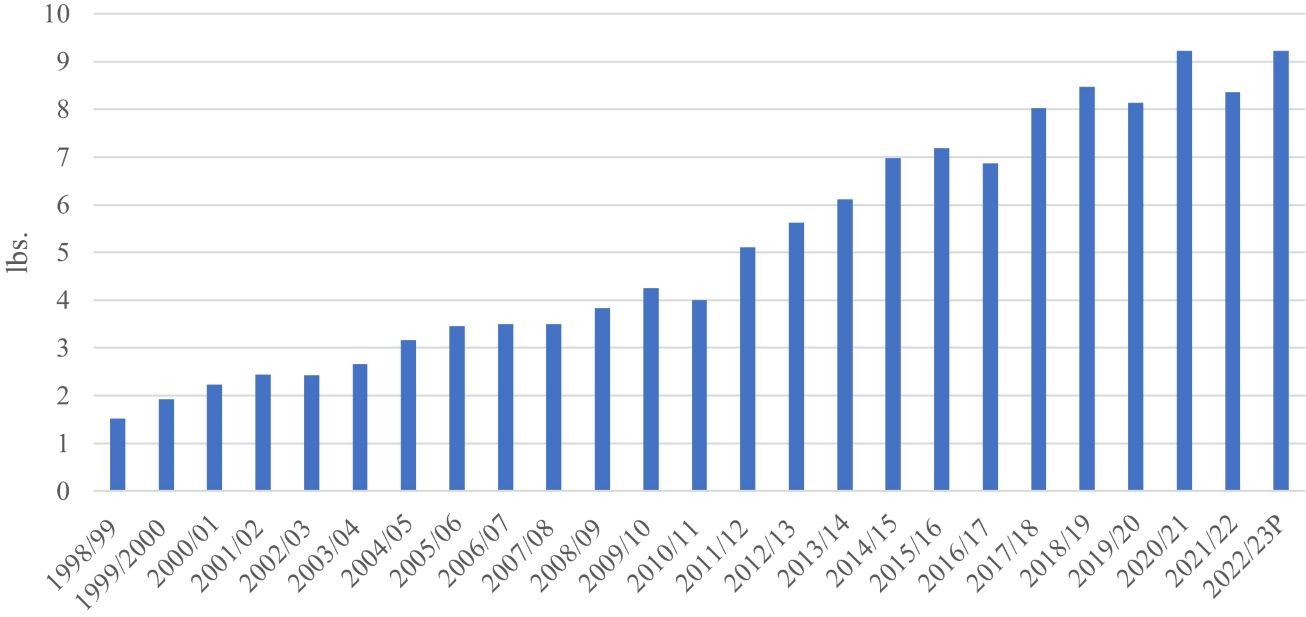
Avocados (Persea americana), originating in south-central Mexico and Guatemala to northern South America (Colombia), are typically cultivated in tropical, subtropical, and Mediterranean climates (Morton and Dowling 1987; Bost et al. 2013). Today’s health-conscious consumers increasingly consider avocado to be a “superfood.” Avocados’ popularity among healthy eaters is unsurprising, given that they are rich in nutrients and healthy fats but relatively low in calories compared to other healthful foods (Dekevich 2022; Ford 2023). As awareness of avocados’ nutritional value and health benefits grows, so does demand and their global production (Huang et al. 2023). In fact, avocado production has more than tripled since 2000, increasing from six billion pounds in 2000 to 19 billion pounds in 2021 (FAOSTAT 2023). Following this global trend, US avocado consumption has grown rapidly since the 2000s. As presented in Figure 1, it has surged from 1.52 pounds per capita in 1998 to an expected 9.22 pounds per capita in 2023—a six-fold increase in about two decades.
Credit: USDA-ERS 2023
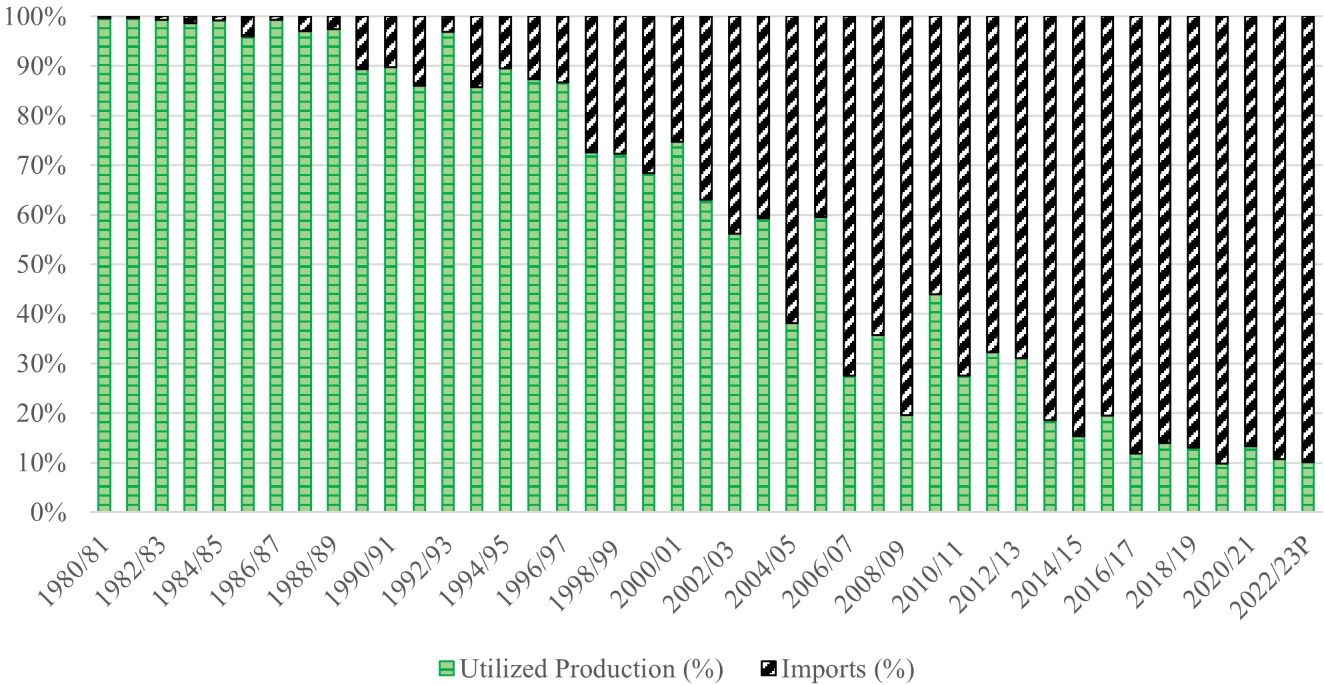
Avocado production in the United States, however, is not following the same pace as increasing consumption. Figure 2 shows that, back in the 80s, the total supply of avocados in the United States was almost entirely covered by domestic production. However, since the early 1990s, the total supply of avocados in the United States has been increasingly dependent on imports, reaching a dependence share of 90% during the last decade. As with other fruits and vegetables, the rise in imports may aid the survival of the US domestic supply chain amidst growing demand. Mexico has been the dominant import source for the US market, representing around 80% of total US avocado shipments and 90% of imported shipments over the last five years (USDA-AMS 2023).
Credit: USDA-ERS 2023
This article presents an overview of the US avocado market, which consists of domestic production and imports. Mexico in particular has become a crucial player with a dominant market share. Mexico’s control of the US avocado market coincides with decreased domestic production of avocados. This article will provide policymakers and stakeholders with a deeper understanding of the industry and thus help inform policymaking and business planning.
Avocado Production and Supply in the United States
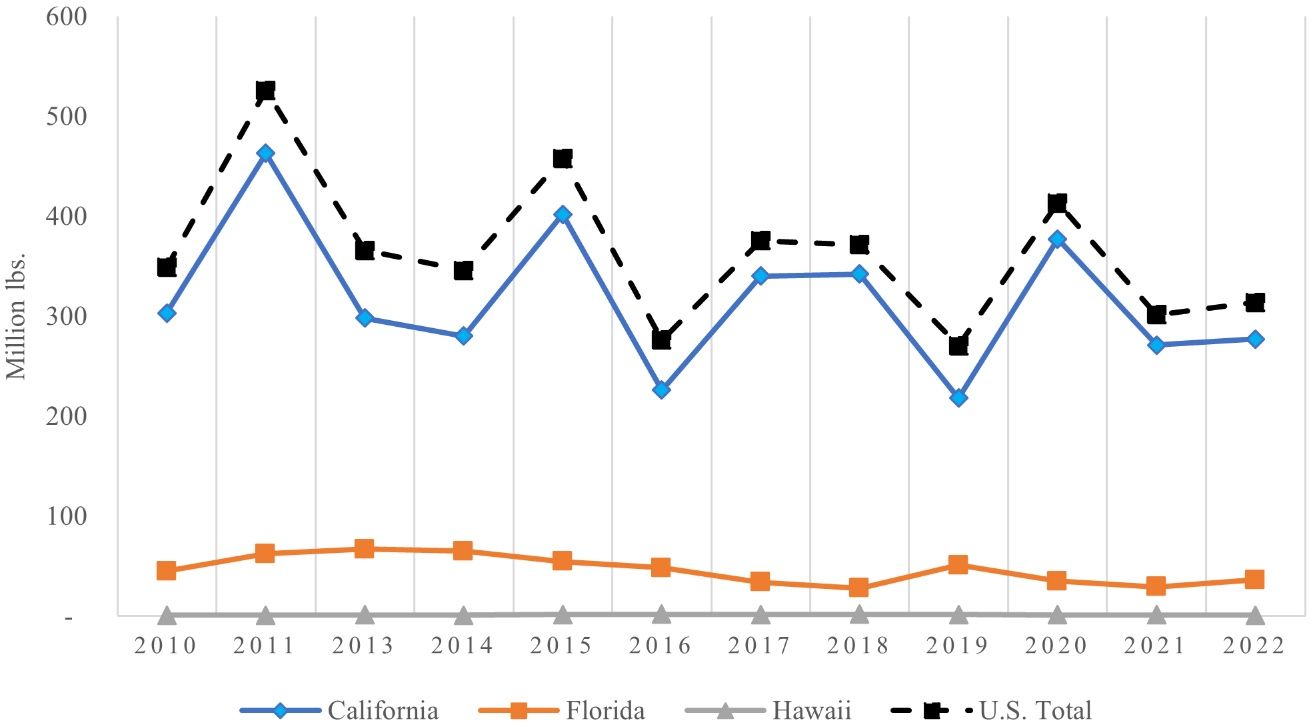
Avocado production in the United States is primarily concentrated in the warm states of California, Florida, and Hawaii, where favorable climate conditions allow for the cultivation of this fruit. Two types of avocados are cultivated in the United States: Hass avocados are grown in areas with Mediterranean climates, whereas green-skin avocados are grown in tropical and subtropical areas. Between 2010 and 2022, US avocado production has fluctuated around an average of 364 million pounds per year, as depicted in Figure 3. The fluctuating production is attributed to the physiological characteristic of alternating bearing cycles (California Avocado Commission 2020) and adverse weather events, including droughts, wildfires in California, and hurricanes in Florida (Smith 2022; Karst 2021).
Credit: USDA-NASS 2023
Among the avocado-producing states, California accounts for most of the US production in 2023 with 88%, followed by Florida with 12% and Hawaii with less than 1% (USDA-NASS 2023). In California, the production is predominantly of the Hass variety. These are cultivated along the southern coast in counties such as San Diego, Ventura, Santa Barbara, Riverside, and San Luis Obispo (Lazicki et al. 2015). Florida’s production, on the other hand, focuses mainly on green-skinned varieties and is centered in Miami-Dade County (De Oleo et al. 2014; USDA-ERS 2018a). The Hass avocado season in California spans from November to October, and the peak of the harvesting window is from April to July (California Avocado Commission 2023; Dzung Duong 2018). The green-skin avocado season in Florida extends from June through February (Huang et al. 2022). To guarantee year-round availability of avocados on the shelf, US retailers rely more and more on imports which have an extended, nearly year-long, harvesting window.
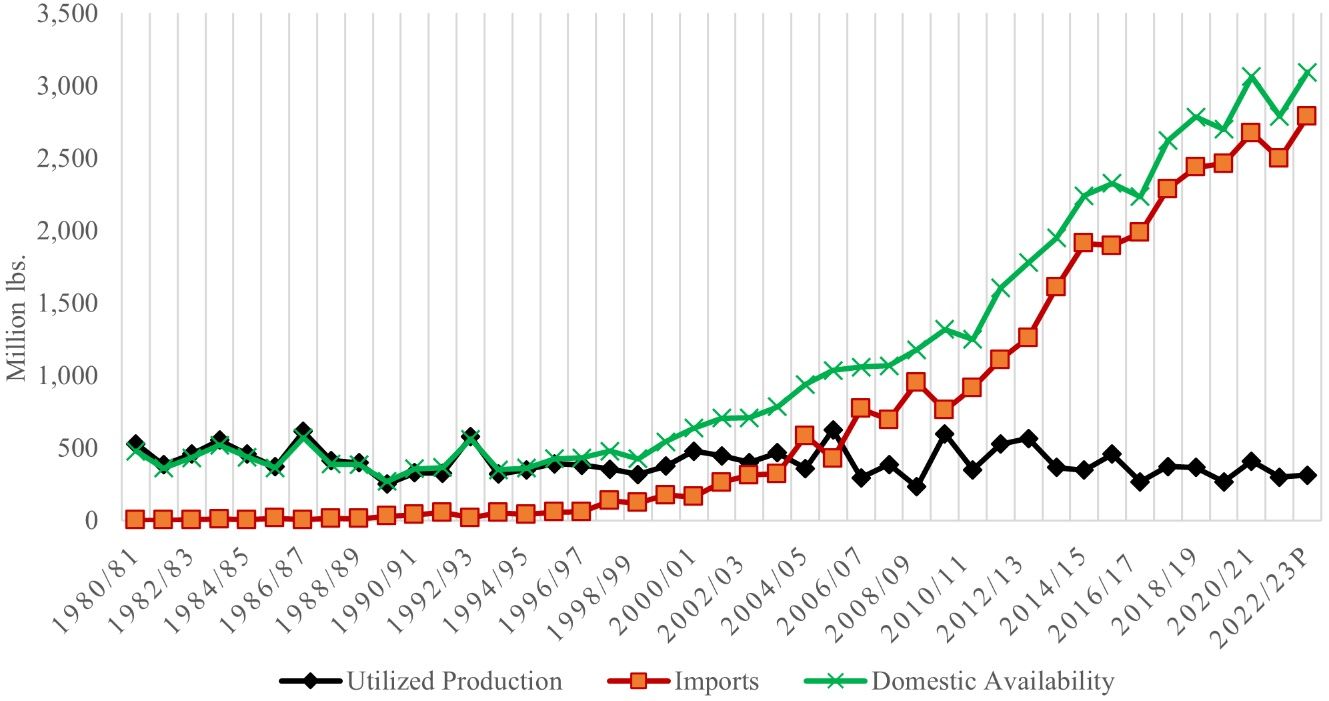
Consumption of avocados in the United States has exceeded domestic production and supply since the early 1990s, resulting in a surge in avocado imports since 2000/01 (Figure 4). In 1990, the United States imported 38 million pounds of avocados. Imports grew steadily, rising to 2,789 million pounds in 2023. Nearly all these imports (99%) are of Hass or Hass-like varieties (Harmonized System’s HS-code: 0804400040), with over 90% originating from Mexico. The remaining non-Hass varieties (HS: 0804400090), comprising around 1% or 2% of the imports depending on the year, are primarily sourced from the Dominican Republic. These Dominican non-Hass variety imports to the United States have also been expanding in recent years, increasing from around 11 million pounds in 2000 to 88 million pounds in 2023 (USDA-AMS 2023).
Credit: USDA-ERS 2023
The regions of avocado production in the United States are primarily constrained by the weather and climate. The Mediterranean and subtropical climates in California and Florida are conducive to avocado cultivation. However, intensified production in these regions presents environmental and economic challenges. The significant water demand, more than 60 gallons per avocado fruit (Sommaruga and Eldrige 2020; Gómez-Tagle et al. 2022; Mekonnen and Hoeksta 2011), limits output, especially in water-scarce areas like California. As a result, importing avocados, especially from countries with a more competitive industry, such as Mexico, became more economically viable for wholesalers and retailers. This trend gained momentum, particularly since the mid-90s under the North American Free Trade Agreement (NAFTA) and the leverage of phytosanitary restrictions on several Mexican municipalities (USDA-ERS 2018b).
Avocado Shipments and Prices in the United States
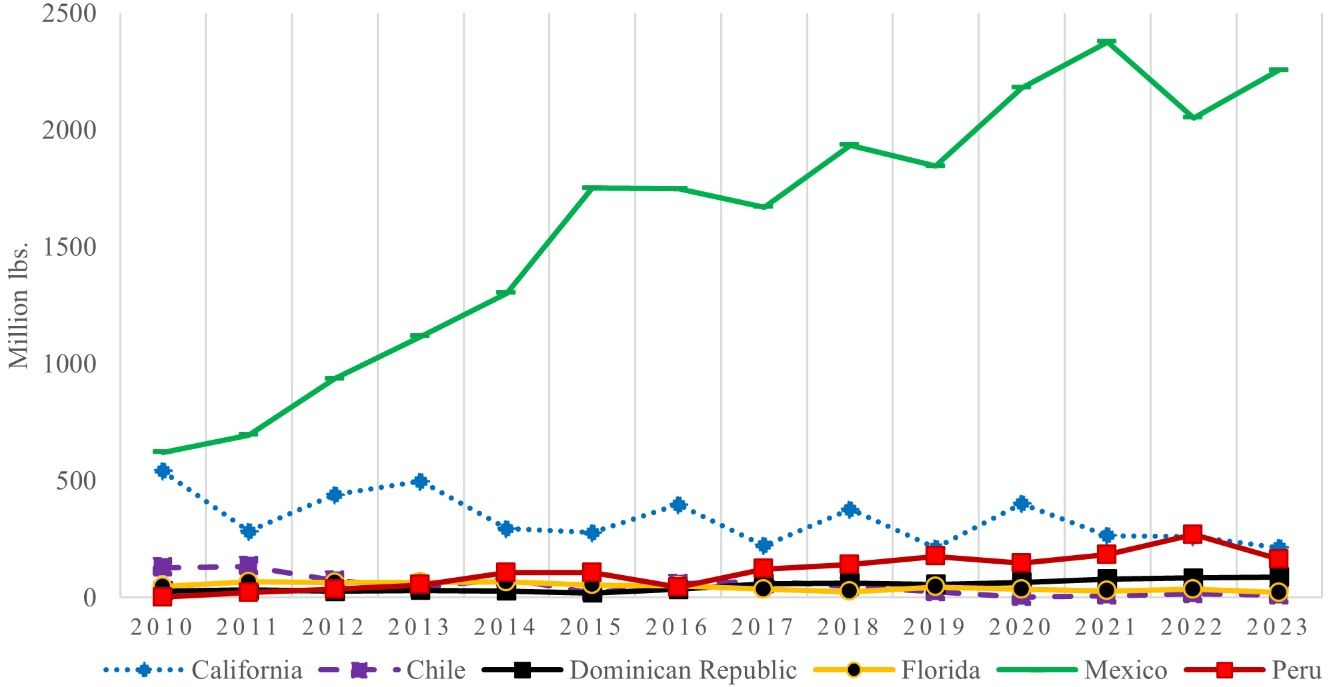
Over the last decade, avocado shipments and prices along the US supply chain have been fluctuating. Figure 5 illustrates avocado shipments in the United States since 2010, including both domestic shipments (from California and Florida) and imports (from Chile, the Dominican Republic, Mexico, and Peru). In 2022, domestic shipments accounted for only 10% of the total shipment in the United States, with California contributing 9% and Florida 1%. Mexico led avocado shipments with 74%, followed by Peru (10%), the Dominican Republic (3%), Colombia (2%), and Chile (1%).
Credit: USDA-AMS 2023
The distribution of these shares has undergone significant changes over time. Domestic shipments, particularly from California, have seen a decline, yielding ground to the increasing imports. Observers attribute the decline in US production to more frequent adverse weather conditions (e.g., heat waves and hurricanes), disease outbreaks (e.g., laurel wilt disease in Florida), labor shortages, rising water costs, and declining acreage as farmland becomes urbanized (Hass Avocado Board 2020; California Avocados 2023; Hampton 2023; Smith 2022). Over the past decade, California’s shipment volumes have fluctuated around an average of 334 million pounds, declining from 541 million pounds in 2010 to 213 million pounds in 2023. Its share in total US shipments has also dropped from 40% to 8% between 2010 and 2023. Similarly, Florida’s shipping volumes experienced a decrease from 47 to 21 million pounds during the same period, partially due to the 2012 outbreak of laurel wilt disease in Miami-Dade County, which caused the loss of approximately 300,000 avocado trees (Wasielewski 2023).
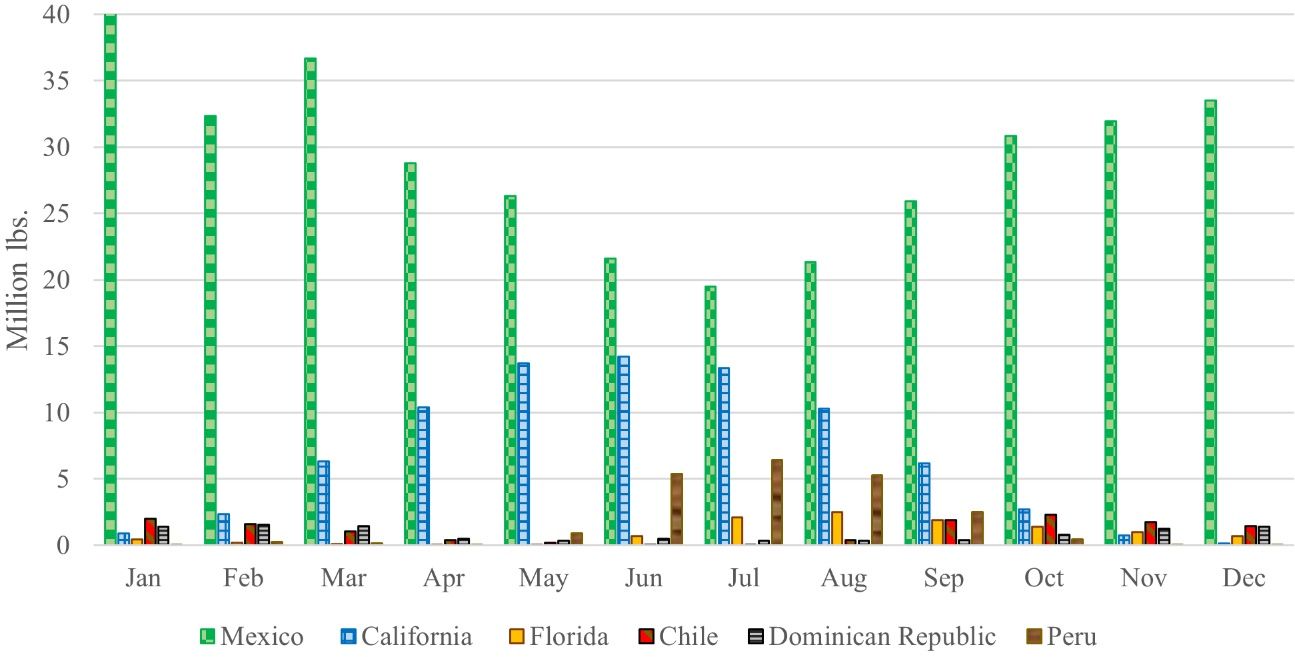
In contrast, imports from Mexico have witnessed remarkable growth over the last decade, escalating from 621 million pounds in 2010 to 2,256 million pounds by 2023. The Mexican share in total shipments has surged from 45% to 81% during the same period. On a smaller scale, Peru has also increased its exports to the United States, increasing from 1 to 269 million pounds between 2010 and 2022, with a slight dip in 2023 (164 million pounds). The Peruvian share in total US shipments has evolved from 0% to 10% during the same period. As depicted in Figure 6, Mexican avocado shipments dominate the US market, particularly when California shipments are at their lowest during the season.
Credit: USDA-AMS 2023
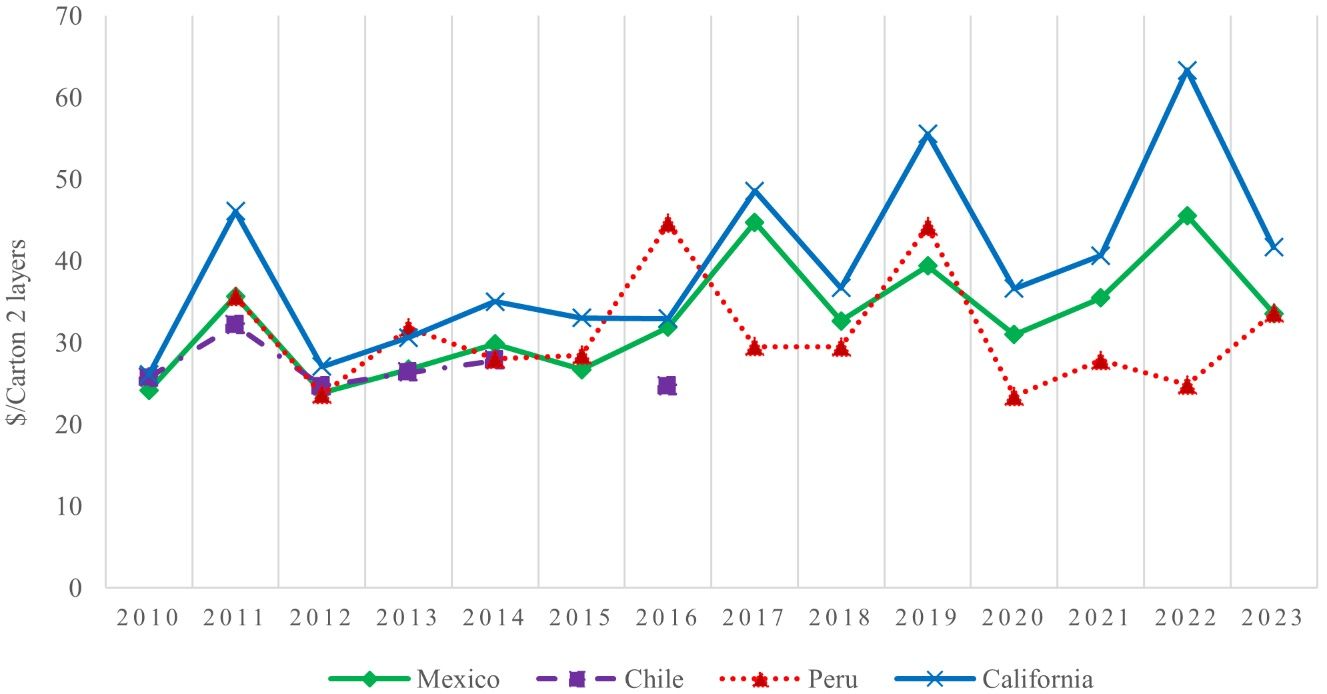
Mexican shipments to the United States peak during the winter window (late November to March). Since 2010, they have averaged over 30 million pounds monthly. Peruvian shipments fill the gap between the peak of California shipments and the peak of Mexican shipments. Figure 7 presents the annual shipping point prices of Hass avocados in the United States from 2010 to 2023. Except during 2016, California consistently has had the highest shipping point prices in the United States. California’s higher prices are mainly due to lower production volumes and higher production costs compared to importing sources (Hass Avocado Board 2020). The prices in California show a general upward trend, starting at $26.11 per two-layer carton (around 26 pounds) in 2010 and reaching $63.34 per two-layer carton in 2022. The average price throughout the entire period was $39.58 per carton. Among imported shipments, both Mexico and Peru exhibit a similar fluctuating trend. The average shipping point price for Mexico was $32.96 per box, while for Peru, it was $31.18 per box. Mexican shipments recorded a minimum of $23.90 in 2012 and a maximum of $45.58 per box in 2022. On the other hand, Peruvian shipments were priced at a minimum of $23.45 in 2020 and a maximum of $44.64 per box in 2016.
Credit: USDA-AMS 2023
The significant increase in avocado price during the last couple of years has been attributed to several factors, including the strong US demand in 2021 and the avocado import suspension from February 12th to February 18th, 2022, which was the consequence of an incident in which a US plant safety inspector received threats (Lucas 2022). Additionally, similar supply shocks may be more frequent in the future as a result of the involvement of organized crime in the Mexican avocado industry (Romero and Rodriguez Mega 2023).
Discussion
Driven by recognized health benefits and nutritional value, US avocado demand has surged by 600% since 1998. Already limited, US avocado production has been declining recently due to various factors, including adverse weather events, urbanization pressure, and rising production costs, chief among them water cost and wages, exacerbated by water scarcity and labor shortages (Hass Avocado Board 2020; California avocados 2023; Hampton 2023; Karst 2021). To meet the booming domestic demand, the US market relies heavily on imports. Benefiting from the strong demand from the United States, Mexico emerges as the world’s leading avocado producer and a dominant supplier to the US market. Other emerging suppliers such as Peru, the Dominican Republic, and Colombia are also gaining prominence as significant avocado providers to the United States.
This increased dependence on imports poses challenges for the domestic industry in the United States. The same trend has been observed in other fresh produce markets, such as tomatoes (Li et al. 2022; Guan et al. 2018), peppers (Biswas et al. 2018), berries (Wu et al. 2016; Suh et al. 2017; Wu and Guan 2021), and citrus (Hammami et al. 2024).
In California, the largest domestic producer of avocados, the avocado industry experienced declining prices in 2023 due to an oversupply of imports. Historic winter storms reduced domestic production, further challenging an industry already suffering from a persistent labor shortage (Hampton 2023). Water scarcity remains a major challenge for such a water-demanding fruit, especially in California (California avocados 2023). Florida’s avocado industry is unique, with unique challenges. Known for its green-skinned avocados, Florida occupies a niche market distinct from California’s Hass industry. In addition to grove loss to urbanization, and rising labor and production costs (Karst 2021), Florida’s avocado industry encounters challenges such as the laurel wilt disease (Crane et al. 2020), and periodic hurricanes. These factors pose difficulties in dealing with growing imports from the Dominican Republic.
References
Biswas, T., Z. Guan, and F. Wu. 2018. “An Overview of the U.S. Bell Pepper Industry: FE1028, 12/2017.” EDIS 2018 (2). Gainesville, FL. https://doi.org/10.32473/edis-fe1028-2017
Bost, J. B., N. J. H. Smith, and J. H. Crane. 2013. “History, Distribution and Uses.” In The Avocado: Botany, Production, and Uses edited by B. Schaffer, A. W. Whiley, and B.N. Wolstenholme, 31–50. CABI International, Wallingford, Oxfordshire, UK.
California Avocado Commission. 2020. Alternate Bearing Cycles. Available at: https://www.californiaavocadogrowers.com/growing/how-california-avocado-tree-grows/alternate-bearing-cycles. Retrieved 12/18/2023.
California Avocado Commission. 2023. Pounds and Dollars by Variety. Available at: https://www.californiaavocadogrowers.com/industry/pounds-and-dollars-variety/. Retrieved 02/18/2024.
California Avocados. 2023. California Avocado Sustainability. Available online at: https://californiaavocado.com/avocado101/california-avocado-sustainability/. Retrieved 12/18/2023.
Crane, J. H., J. Wasielweski, D. Carrillo, R. Gazis, B. Schaffer, F. Ballen, and E. Evans. 2020. “Recommendations for the Detection and Mitigation of Laurel Wilt Disease in Avocado and Related Tree Species in the Home Landscape: HS1358, 2/2020.” EDIS 2020 (1). Gainesville, FL. https://doi.org/10.32473/edis-hs1358-2020
De Oleo, B., Evans, E. A., & Crane, J. H. 2014. “Establishment Cost of Avocados in South Florida: FE956/FE956, 10/2014”. EDIS 2014 (8). https://doi.org/10.32473/edis-fe956-2014
Dekevich, D. 2022. Colorado State University/Food Source Information: Avocado. Available online at: https://www.chhs.colostate.edu/fsi/food-articles/produce-2/avocados/. Retrieved 11/13/2022.
Duong, D. 2018. When is California avocado season? California Avocados. Available online at: https://californiaavocado.com/avocado101/are-california-avocados-available-year-round/. Retrieved 12/18/2023.
Dyreson, M. 2019. "The Super Bowl as a Television Spectacle: Global Designs, Local Niches, and Parochial Patterns.” In A Half Century of Super Bowls, 138–155. Routledge. https://doi.org/10.4324/9780429490439-9
FAOSTAT. 2023. Crops and livestock products. Available online at: https://www.fao.org/faostat/en/#data/QCL. Retrieved 12/18/2023.
Ford, N. A., P. Spagnuolo, J. Kraft, and E. Bauer. 2023. “Nutritional Composition of Hass Avocado Pulp.” Foods 12 (13): 2516. https://doi.org/10.3390/foods12132516
Gómez-Tagle, A. F., A. Gómez-Tagle, D. J. Fuerte-Velázquez, A. G. Barajas-Alcalá, F. Quiroz-Rivera, P. E. Alarón-Chaires, and H. Guerrero-García-Rojas. 2022. “Blue and Green Water Footprint of Agro-Industrial Avocado Production in Mexico.” Sustainability 14 (15):9664. https://doi.org/10.3390/su14159664
Guan, Z., T. Biswas, and F. Wu. 2018. “The U.S. Tomato Industry: An Overview of Production and Trade: FE1027, 9/2017.” EDIS 2018 (2). Gainesville, FL. https://doi.org/10.32473/edis-fe1027-2017
Hammami, A., Y. Li, and Z. Guan. Forthcoming. “The US Orange Industry: Declining Production and Climbing Imports: FE1145.” EDIS. Gainesville, FL. https://doi.org/10.32473/edis-fe1145-2024
Hampton, C. 2023. “Imports and Labor Shortage Challenge Avocado Growers.” AgAlert. California Farm Bureau. Available online at: https://www.agalert.com/california-ag-news/archives/june-28-2023/imports-and-labor-shortage-challenge-avocado-growers/. Retrieved 12/18/2023.
Hass Avocado Board. 2020. Country Profile: USA California. “The avocado in California.” Available online at: https://hassavocadoboard.com/wp-content/uploads/hab-marketers-country-profiles-2020-california.pdf. Retrieved 02/20/2024.
Huang, K. M., Z. Guan, and A. Hammami. 2022. “The US Fresh Fruit and Vegetable Industry: An Overview of Production and Trade.” Agriculture 12 (10): 1719. https://doi.org/10.3390/agriculture12101719
Huang, K. M., Z. Guan, T. Blare, and A. M. Hammami. 2023. “Global Avocado Boom.” Choices 38(4). Available online at: https://www.choicesmagazine.org/choices-magazine/submitted-articles/global-avocado-boom
Karst, T. 2021. “Florida Avocados Face Challenges with Hot Real Estate Market, Disease Pressure.” The Packer. Available online at: https://www.thepacker.com/news/industry/florida-avocados-face-challenges-hot-real-estate-market-disease-pressure. Retrieved 02/21/2024.
Li, S., F. Wu, Z. Guan, and T. Luo. 2022. “How Trade Affects the US Produce Industry: The Case of Fresh Tomatoes.” International Food and Agribusiness Management Review 25 (1): 121–133. https://doi.org/10.22434/IFAMR2021.0005
Lucas, A. 2022. “Avocados Will Likely Be in Short Supply and More Expensive Due to Mexican-Import Suspension.” CNBC 2022. Available online at: https://www.cnbc.com/2022/02/16/avocados-will-likely-be-more-expensive-due-to-mexican-import-suspension.html?qsearchterm=avocados%20will%20.
Mekonnen, M. M., and A. Y. Hoekstra. 2011. “The Green, Blue and Grey Water Footprint of Crops and Derived Crop Products.” Hydrology and Earth Systems Sciences Discussions 8:763–809. https://doi.org/10.5194/hessd-8-763-2011
Morton, J., and C. F. Dowling. 1987. “Avocado.” Fruits of Warm Climates, 91–102.
Sommaruga, R. and H. M. Eldridge. 2020. “Avocado Production: Water Footprint and Socio-Economic Implications.” EuroChoices 20 (2): 48–53. https://doi.org/10.1111/1746-692X.12289
Romero, S. and E. R. Mega. 2023. “Americans Love Avocados. It’s Killing Mexico’s Forests.” The New York Times. Available online at: https://www.nytimes.com/2023/11/28/us/mexico-avocado-deforestation.html#:~:text=Demand%20for%20avocados%20grown%20in,clear%20space%20for%20avocado%20plants. Retrieved 02/19/2024.
Smith, E. S. 2022. “San Diego’s Avocado Production Plummets. Growers Cite Drought, Heatwaves.” The San Diego Union-Tribune. Available online at: https://www.sandiegouniontribune.com/news/environment/story/2022-10-06/avocado-production-plummets. Retrieved 02/19/2024.
Suh, D. H., Z. Guan, and H. Khachatryan. 2017. “The impact of Mexican competition on the US strawberry industry.” International Food and Agribusiness Management Review 20 (4): 591–604. https://doi.org/10.22434/IFAMR2016.0075
U.S. Department of Agriculture Agricultural Marketing Service. 2023. Available online at: https://marketnews.usda.gov/mnp/fv-report-config-step1?type=shipPrice. Retrieved 12/18/2023.
U.S. Department of Agriculture Economic Research Service. 2018a. “U.S. and Mexican avocado production is concentrated in a small number of States.” Available online at https://www.ers.usda.gov/data-products/chart-gallery/gallery/chart-detail/?chartId=90622 Retrieved 03/08/2022.
U.S. Department of Agriculture Economic Research Service. (2018b). “Since the burgeoning of the international avocado trade, U.S. avocado production is highest from April to July, when imports from Mexico abate somewhat.” Available online at: https://www.ers.usda.gov/data-products/chart-gallery/gallery/chart-detail/?chartId=90370. Retrieved 02/14/2024.
U.S. Department of Agriculture Foreign Agricultural Service. 2021a. Global Agricultural Information Network. Mexico: Avocado Annual. Report number: MX2021-0060. Available online at: https://fas.usda.gov/data/mexico-avocado-annual-6. Retrieved 03/08/2022.
U.S. Department of Agriculture Foreign Agricultural Service. 2021b. Global Agricultural Information Network. Peru: Avocado Exports Continue to Increase. Report number: PE2021-0003. Available online at: https://fas.usda.gov/data/peru-avocado-exports-continue-increase. Retrieved 03/08/2022.
U.S. Department of Agriculture Foreign Agricultural Service. 2021c. Global Agricultural Information Network. Chile: Avocado Annual. Report number: CI2021-0026. Available online at: https://fas.usda.gov/data/chile-avocado-annual-5. Retrieved 03/08/2022.
U.S. Department of Agriculture Foreign Agricultural Service. 2022. Available online at: https://apps.fas.usda.gov/gats/default.aspx. Retrieved 03/08/2022.
U.S. Department of Agriculture National Agricultural Statistics Service. 2023. Quick Stats. Available online at: https://quickstats.nass.usda.gov/. Retrieved 12/18/2023.
Wasielewski, J. 2023. Laurel Wilt—A Disease Impacting Avocados. UF/IFAS Extension. Available online at: https://sfyl.ifas.ufl.edu/miami-dade/agriculture/laurel-wilt---a-disease-impacting-avocados/. Retrieved 02/22/2024.
Wu, F., and Z. Guan, Z. 2021. “An Overview of the Mexican Blueberry Industry: FE1106, 12/2021.” EDIS 2021 (6). Gainesville, FL. https://doi.org/10.32473/edis-fe1106-2021.
Wu, F., Z. Guan, and A. Whidden. 2016. “An Overview of the US and Mexico Strawberry Industries: FE971/FE971, 11/2015.” EDIS 2016 (1). Gainesville, FL. https://doi.org/10.32473/edis-fe971-2015.