Introduction
Ginger (Zingiber officinale) is a plant with varied culinary uses. The rhizome (underground stem) of the plant is the part that is consumed, and it is often referred to as ginger root in the marketplace.
The 2022 Census of Agriculture found 105 farms growing ginger in Florida but did not disclose the total acreage. Ginger was grown for the fresh market by 103 farms on 48 acres in 2022 (USDA-NASS 2022). Although still a very small crop, there may be market opportunities to expand ginger production in Florida.
This publication summarizes research on potential markets for Florida-grown ginger, including fresh produce, food and beverage ingredients, and nursery markets. Information is also provided about galangal (Alpinia galanga), which is a closely related species that is sometimes marketed as galanga or Thai ginger. The purpose of the publication is to provide information that will assist prospective ginger producers with their marketing plan.
A marketing plan typically covers “the four Ps”: (1) product forms and attributes, (2) places where the product will be sold, (3) price points, and (4) promotion (Evans and Ballen 2015). This publication does not provide a marketing plan, which should be tailored to each producer’s unique situation. Information is provided on potential markets that a producer could consider in developing the four Ps of a marketing plan.
This research was funded by the UF/IFAS Support for Emerging Enterprise Development Integration Teams (SEEDIT) program and a US Department of Agriculture (USDA) Specialty Crop Block Grant administered through the Florida Department of Agriculture and Consumer Services. The project included research on Florida production and markets for ginger, galangal, and turmeric. We compiled and analyzed import and terminal market data and conducted semi-structured interviews with market participants. Interview participants included seven food or beverage manufacturers, three tea shops, three fresh produce marketers, three retail nurseries, a plant liner supplier, and a marketing consultant.
Fresh Produce Markets
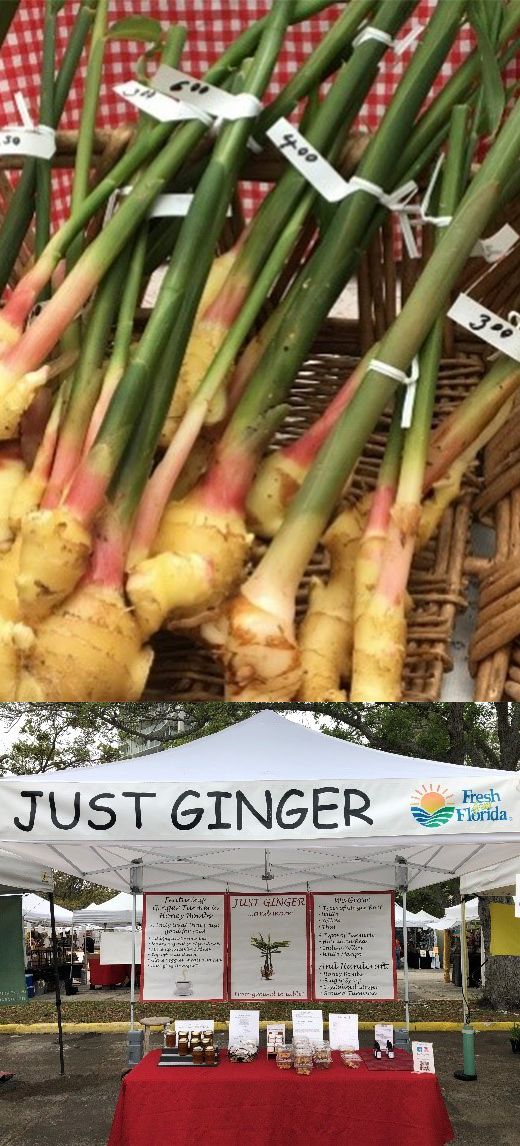
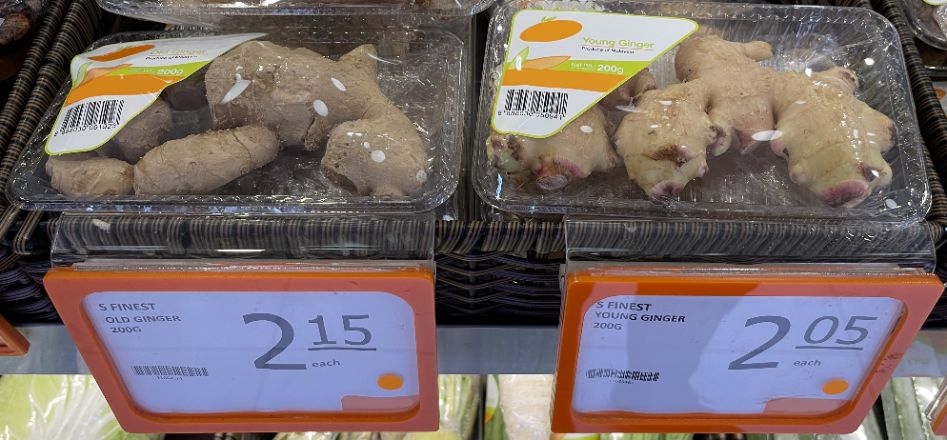
Ginger producers have opportunities to sell ginger in its fresh, whole form. Producers can sell small quantities of fresh produce directly to final consumers at retail prices (such as at farmers’ markets, farmstands, and online, Figure 1). To sell larger quantities, farmers typically need to sell to wholesale distributors or directly to retailers or restaurants at wholesale prices. Fresh ginger is sold as either mature or young “baby” rhizomes (Figure 2), depending on the stage at which it was harvested (Paull and Chen 2015; Slama and Diffley 2013). Mature ginger is the type most commonly available in US markets. Prospective ginger growers must consider the types of buyers and market channels available in their areas and learn what type of ginger those customers prefer.

Credit: Paul Fisher, UF/IFAS (top) and Just Ginger, Florida (bottom; used with permission)

Credit: Paul Fisher, UF/IFAS
Most ginger consumed in the United States is imported. Produce importers and distributors sell ginger to retailers, wholesalers, food service businesses, and food/beverage manufacturers, such as juicers. In some cases, the importers are integrated global companies that grow ginger in addition to handling packing, export/import, and distribution. Prospective ginger growers must consider whether they can compete with imported ginger at similar price points or differentiate their ginger to obtain a higher price. Information on import values, prices at Florida ports of entry, and wholesale prices is provided below.
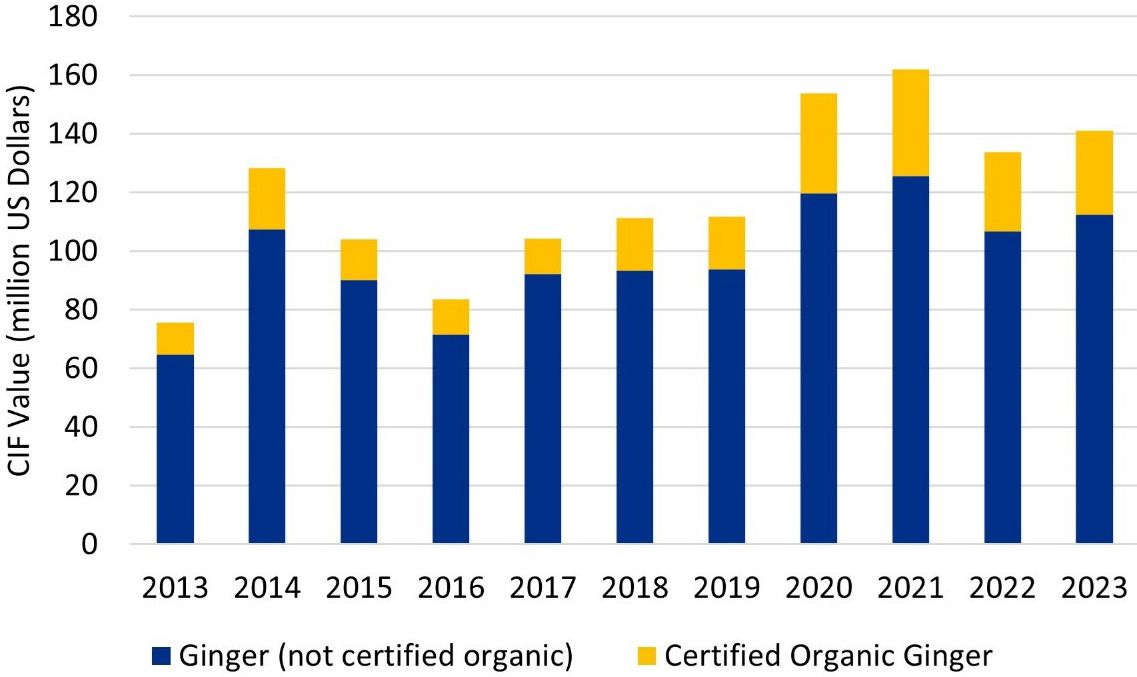
The annual Cost, Insurance, and Freight (CIF) value of imports of whole ginger (neither crushed nor ground) to the United States rose from $76 million in 2013 to $162 million in 2021, then fell to $141 million in 2023, as shown in Figure 3 (US Census Bureau 2024). The CIF value includes the cost of the goods plus insurance and freight costs to deliver to a US port but excludes import duties paid (US Census Bureau 2024). Currently, no import duty (tariff) is assessed on imported whole, uncrushed, unground ginger (US-ITC 2024). Certified organic ginger imports varied from 12% to 22% of total annual uncrushed, unground ginger import value. The import trend demonstrates strong sales growth in the United States, as well as a spike in ginger sales associated with the COVID-19 pandemic. The value of organic and total ginger imports remained higher in 2022 and 2023 than in any year before 2020.
Ginger imports to the United States came from 47 different countries over the past five years. The top three origins by average annual CIF value between 2019 and 2023 were China ($62 million), Peru ($43 million), and Brazil ($17 million) (US Census Bureau 2024).

Credit: US Census Bureau 2024
The USDA reports daily and weekly high and low prices for imported ginger from Brazil and Central America entering through south Florida ports and for ginger from various origins at US terminal (wholesale) markets (USDA-AMS 2024). Prices at south Florida ports include freight to the United States and customs clearance. Quantities sold at each price are not reported in the data sets, and neither are weighted average prices. We calculate unweighted averages of high and low prices by month, terminal market, or origin to represent wholesale ginger prices in the United States.
Unweighted monthly averages of weekly low and high prices for imported ginger in 30 lb cartons, not labeled organic, at south Florida ports from 2021 to 2023 are shown in Table 1. The three-year unweighted average price across all months was $1.09/lb. Seasonal price cycles are not consistent across the three years, 2021 to 2023. Unweighted monthly average prices across the three years are highest in November, October, and February, possibly reflecting demand related to the Thanksgiving, Christmas, and Chinese New Year holidays.
Table 1. Unweighted monthly averages of weekly high and low prices for imported ginger at south Florida ports of entry, 30 lb cartons, not labeled organic ($/lb). Data source: USDA-AMS 2024.
Terminal market prices represent wholesale prices for sales to restaurants and retailers. Ginger is sold at terminal markets mostly in 30 lb cartons. Table 2 shows unweighted annual averages of daily high and low prices reported at nine eastern US terminal markets in 2021 through 2023. The Columbia and Detroit terminal markets consistently report the highest ginger prices, and Miami consistently reports the lowest prices (USDA-AMS 2024).
Table 2. Unweighted annual averages of daily high and low prices for ginger in 30 lb cartons, not labeled organic, by terminal market ($/lb). Data source: USDA-AMS 2024.
Monthly averages of daily high and low prices reported for the nine eastern US terminal markets combined in 2021–2023 are shown in Table 3. Over this three-year period, monthly average prices were highest in February, January, and October; however, the data do not show a consistent seasonal price cycle. The optimal time to harvest mature ginger in Florida, based on climate and growing conditions, is November and December. When properly stored, fresh ginger has a shelf life of 60 to 90 days (Slama and Diffley 2013). Adjusting harvest timing or storage capability could allow a ginger producer to take advantage of price fluctuations and sell at times when the price is higher.
Table 3. Unweighted monthly averages of daily high and low prices for ginger in 30 lb cartons, not labeled organic, at nine eastern terminal markets combined ($/lb). Data source: USDA-AMS 2024.
Table 4. Hawaiian and Texan ginger prices versus prices for ginger from other origins at eastern US terminal markets, 30 lb cartons not labeled organic, 2021–2023 ($/lb). Data source: USDA-AMS 2024.
The only domestic supply of ginger reported at eastern US terminal markets in 2021–2023 came from Texas and Hawaii. Texas ginger was reported in Boston terminal markets in February and March 2021. Hawaiian ginger was reported in New York terminal markets in March–April 2021, and in Philadelphia terminal markets in August, September, and December 2023. No domestic ginger was reported at these terminal markets in 2022. Table 4 compares Texan and Hawaiian ginger prices with prices for ginger from other origins. Texas ginger sold for a lower price than ginger from Peru, Brazil, or Costa Rica. Hawaiian ginger sold at a premium relative to ginger from other origins in 2021, but not in 2023 (USDA-AMS 2024).
Organic ginger prices at south Florida ports of entry and eastern US terminal markets were similar to prices for ginger not labeled organic. None of the organic ginger reported at terminal markets came from domestic sources. The USDA data do not show a significant price premium for organic ginger at the wholesale level.
Galangal (Thai ginger) prices were also reported at eastern US terminal markets. Galangal from Florida sold at the Baltimore terminal market, and galangal from Hawaii sold at the Boston and Chicago terminal markets. No other eastern US terminal market reported sales of galangal in recent years (USDA-AMS 2024).
Table 5 shows unweighted annual averages of daily high and low terminal market prices for galangal, 2021–2023 (USDA-AMS 2024). Florida galangal prices at the Baltimore terminal were similar to Hawaiian galangal prices at the Boston terminal market. The three-year unweighted average was $3.35/lb and $3.26/lb respectively. Hawaiian galangal prices at the Chicago terminal market were higher, with a three-year unweighted average of $4.00/lb.
Table 5. Unweighted annual averages of daily high and low prices for galangal in 30-lb cartons, not labeled organic ($/lb). Data source: USDA-AMS 2024.
Hawaiian galangal at the Chicago terminal market always sold for between $3.50/lb and $4.50/lb (unweighted average of $4.00/lb). Baltimore and Boston terminal market prices showed more fluctuation during the year, but no seasonal pattern was apparent.
The wholesale price data shown above for fresh ginger and galangal provide rough indicators of price points needed to be competitive in wholesale markets, assuming no differences in perceived product quality. Possible quality attributes are described below.
Retail prices for ginger or galangal are not available from the USDA, but we observed ginger prices at retail stores and a farmers’ market in 2021 and 2022. Observed retail prices for fresh mature ginger root ranged from $3.58/lb to $4.99/lb, and baby ginger was observed selling at farmers’ markets for $8.75/lb to $15.38/lb.
Desired quality characteristics for fresh mature ginger include light yellowish-brown skin color with a sheen, plumpness, and absence of sprouts, blemishes, soil, and insect injury. Young ginger should be bright yellow to brown with high sheen and greenish-yellow vegetative buds, but no sprouts (Paull and Chen 2015; Slama and Diffley 2013). Quality grades for ginger have not been established in the United States (Slama and Diffley 2013). The market participants we interviewed mentioned the importance of the internal color and flavor profile, freshness, nutrient density, and food safety. Opinions were mixed about the perceived value of Florida-grown. The size of the ginger “hand” can also affect marketability. One participant said that medium-sized hands, not too big or too small, are preferred. Organic certification was mentioned as important for some markets. Ginger sellers who can differentiate their products with attributes that their customers value may obtain higher prices.
Food and Beverage Ingredient Markets
Selling ginger as an ingredient for processed food or beverage products is another option for producers. Ginger can be used in an extensive range of processed products, including dried spices; extracts and supplements; tea, beer, and other beverages; snacks and confections; pickled and canned products; many other prepared foods; and skin care products. Ginger growers could either process ginger into final products themselves or sell fresh or processed ginger to food and beverage manufacturers. We interviewed several food and beverage manufacturers in Florida, including three craft breweries, three tea shop owners, a juice and tea manufacturer, and two natural ingredient and supplement manufacturers.
Some food and beverage manufacturers will purchase fresh ginger and process it into final consumer products. Other food and beverage manufacturers, however, prefer to purchase ginger already in a processed form, such as a liquid extract, puree, or juice; as dried pieces or powder; or as ginger oil. Some companies specialize in preparing processed ingredients to sell to manufacturers of final consumer products. One Florida tea shop owner mentioned buying tea blends with ginger already in them. Another tea shop owner said she buys dried ginger in 2- to 4-millimeter pieces, 80 pounds at a time. Brewers purchase ginger fresh or as a liquid extract or puree. One brewery rated unconcentrated juice as the most preferred form for purchasing ginger but would also purchase puree or powder. Another brewery rated unconcentrated juice and fresh whole rhizomes as the most preferred form but would also purchase concentrated extract. Brewers find it more convenient to work with liquid extracts, juice, or purees, but some have processed fresh ginger themselves.
Food and beverage manufacturers differ in how much importance they place on various ingredient attributes depending on the use of the ingredients and preferences of the final consumers. Some described organic as an important attribute for their products, and others downplayed its importance. Organic certification is not an important attribute for the brewers we interviewed. Exotic tastes and colors are attributes brewers look for in beer adjunct ingredients. Other important attributes mentioned include naturally grown, clean (no sand or mold growth), food safety, taste, color, and gingerol content. Some buyers associated origin with quality and believed that “terroir” (soil and climate) can affect nutrition and taste. For example, two participants described ginger from Peru as higher quality than ginger from China. Ingredient and supplement manufacturers mentioned sourcing ginger from China, Peru, India, Indonesia, and Nigeria. Florida craft brewers have sourced ginger directly from Florida farmers but have also purchased processed ginger ingredients most likely made from imported ginger. The brewers mentioned efforts to source ingredients locally and stated that local sourcing can be helpful for promoting their beer.
Several interview participants expressed interest in Florida-grown ginger, especially if there is a good story around it that can be used in their branding. A “Fresh from Florida—Made with Florida Ginger” label could be used by the food or beverage manufacturer to assist with promoting their products made with Florida-grown ginger.
Nursery Markets
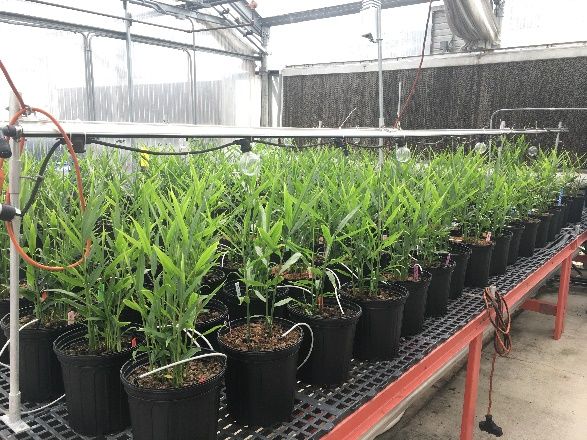
Nursery growers have opportunities to sell ginger seed rhizomes or potted plants to ginger farmers, homeowners, retail nurseries, or garden stores (Figure 4). Container ginger could have market appeal to home gardening enthusiasts similar to other crops grown in containers (e.g., tomatoes, herbs, etc.) or those with limited space or land (i.e., urban farmers). Nursery industry statistics and takeaways from interviews with three Florida nurseries are described below.

Credit: Paul Fisher, UF IFAS
The value of horticultural specialty crops (plants, flowers, seedlings, bulbs) sold in 2019 was $13.8 billion in the United States and $1.9 billion in Florida. The plants sold in these markets were grown by 20,665 producers in the United States and 1,689 producers in Florida. Bedding/garden plants accounted for 23%, nursery stock for 33%, and dried bulbs, corms, rhizomes, and tubers for less than 1% of the industry value nationwide (USDA-NASS 2019). Ginger might be sold in any of those three horticultural categories.
We interviewed three retail nurseries located in Florida that currently sell or previously sold edible ginger. The owner of the nursery that sold ginger in the past said it did not get much traction among customers. He also said that procurement of ginger from growers or wholesalers is an obstacle. One nursery owner who currently likes to carry edible ginger said that he can only get it inconsistently from wholesalers. Based on these interviews it appears that there is an opportunity for wholesale nurseries to identify retail nurseries that want edible ginger and provide them with a more consistent supply of ginger plants.
The size of ginger containers nurseries purchase and sell varies. Among the three nurseries we interviewed, one usually buys and resells ginger, vegetables, and herbs in four-inch and six-inch containers. Another said that he typically buys and resells ginger in three-gallon pots. A third nursery mostly purchases tissue-culture plantlets of ginger in 72-count trays, then grows them out for sale in four-inch and six-inch pots.
Retail prices for containerized ginger plants that were observed and mentioned in interviews ranged from $10 to $17. Container sizes at those price points ranged from four-inch pots to three-gallon containers.
Nursery retailers mentioned seasonal cycles. One said that 60% of his business is from March 1 to June 1. Dormancy cycles of ginger are also a factor. It is difficult to sell ginger plants in late fall and winter when leaves turn yellow and die back.
Although demand for edible plants sold by nurseries has grown in recent years, it is still a relatively small portion of total nursery sales. Most nursery sales are in the ornamental category. One nursery said that edibles are 5% of his sales, and another said edibles are 10%–20% of his sales. Because ginger is a small niche in nursery markets, ginger plant or seed rhizome sellers should plan production quantities and timing based on sales estimates for specific buyers or markets.
Conclusions
Florida ginger producers have opportunities to sell ginger in markets for fresh produce, food and beverage ingredients, and nursery plants. Ginger producers will have to find efficiencies in production, harvesting, and postharvest handling, and develop effective marketing strategies to be successful.
Fresh ginger imports from low-cost production areas have moderated prices for ginger in the United States. To be profitable, Florida ginger producers must keep production costs low or find ways to differentiate their ginger to obtain a price premium. Florida ginger that is differentiated based on origin, ginger variety, or quality characteristics frequently can obtain above-average prices. For example, Thai ginger (galangal) sells at higher prices than regular ginger (Zingiber officinale), and direct-market growers sell local baby ginger at premium retail prices.
Florida ginger could potentially supply food and beverage manufacturing companies. However, these final manufacturers often prefer to purchase ginger in processed form (juice, liquid extract, dried, ground, oleoresin, or oil). Processing facilities are needed to expand opportunities for selling local ginger to food and beverage manufacturers.
Selling ginger as seed rhizomes or container plants is another option. Some retail nurseries that like to sell ginger reported having difficulty obtaining a consistent supply from nursery wholesalers, which suggests a market opportunity. Import competition is less of a factor for nursery plants than it is for fresh ginger or ginger processed for food and beverage ingredients.
Much of the growth in US sales of ginger has come from imports, but Florida producers may be able to capture a share of this growing market. Research on different varieties (e.g., yellow, white, black, Thai); organic production methods; extending the harvest season; and postharvest handling and processing techniques could potentially help the marketability of Florida-grown ginger.
References
Evans, E. A., and F. H. Ballen. 2015. “Eight Steps to Developing a Simple Marketing Plan: FE967 FE967, 8 2015.” EDIS 2015 (6). Gainesville, FL:5. https://doi.org/10.32473/edis-fe967-2015
Paull, R. E., and C. C. Chen. 2015. “Ginger: Postharvest Quality-Maintenance Guidelines.” College of Tropical Agriculture and Human Resources, University of Hawaii at Manoa.
Slama, J., and A. Diffley, eds. 2013. Wholesale Success: A Farmer’s Guide to Food Safety, Selling, Postharvest Handling, and Packing Produce. 4th edition. fa.
US Census Bureau, Economic Indicators Division, USA Trade Online. 2024. U.S. Import and Export Merchandise Trade Statistics. Accessed July 5, 2024. https://usatrade.census.gov/
US Department of Agriculture, Agricultural Marketing Service (USDA-AMS). 2024. Run a Custom Report. Accessed July 6, 2024. https://www.ams.usda.gov/market-news/custom-reports.
US Department of Agriculture, National Agricultural Statistics Service (USDA-NASS). 2019. 2019 Census of Horticultural Specialties. https://www.nass.usda.gov/Publications/AgCensus/2017/Online_Resources/Census_of_Horticulture_Specialties/index.php
US Department of Agriculture, National Agricultural Statistics Service (USDA-NASS). 2022. “Table 29. Vegetables, Potatoes, and Melons Harvested for Sale.” 2022 Census of Agriculture. https://www.nass.usda.gov/Publications/AgCensus/2022/Full_Report/Volume_1,_Chapter_2_US_State_Level/
US International Trade Commission (US-ITC). 2024. Harmonized Tariff Schedule of the United States (2024) Revision 4. Accessed July 6, 2024. https://hts.usitc.gov/