As part of the Savvy Survey series, this publication provides Extension faculty with an overview of topics to consider when thinking about who should be surveyed. Topics in this publication include understanding the survey population, constructing the sampling frame, recognizing who exists outside the population of interest, and defining the sample. The publication also provides insight on issues such as over-coverage and error that can arise because of poor sampling procedures.
Understanding the Population
A survey is traditionally used to gather information from a specific population. After the survey's completion, a researcher can draw valuable conclusions of certain aspects of the study's population. In the context of survey design, a population is a larger group that is eligible to participate in a particular survey. This group consists of elements (individuals, households, or organizations) of interest from whom the surveyor wants to obtain general survey results. A sample of the population is used when it is too costly and time-consuming to survey the entire population.
The target population depends, in part, on the survey's purpose. For example, while a county-wide needs assessment survey in Florida could have a population ranging from 10,000 to more than 2 million, a follow-up survey about diabetes program participants might have a population of 30 in a county.
Consider the Following Example
An Extension faculty member in Brevard County has considered creating a series of workshops about proper fertilization and irrigation practices to help reduce the impacts of runoff into local stormwater ponds. The agent wants to survey local homeowners to learn about the current fertilizing and irrigation practices for lawns that may be impacting adverse nutrient levels in community stormwater ponds.
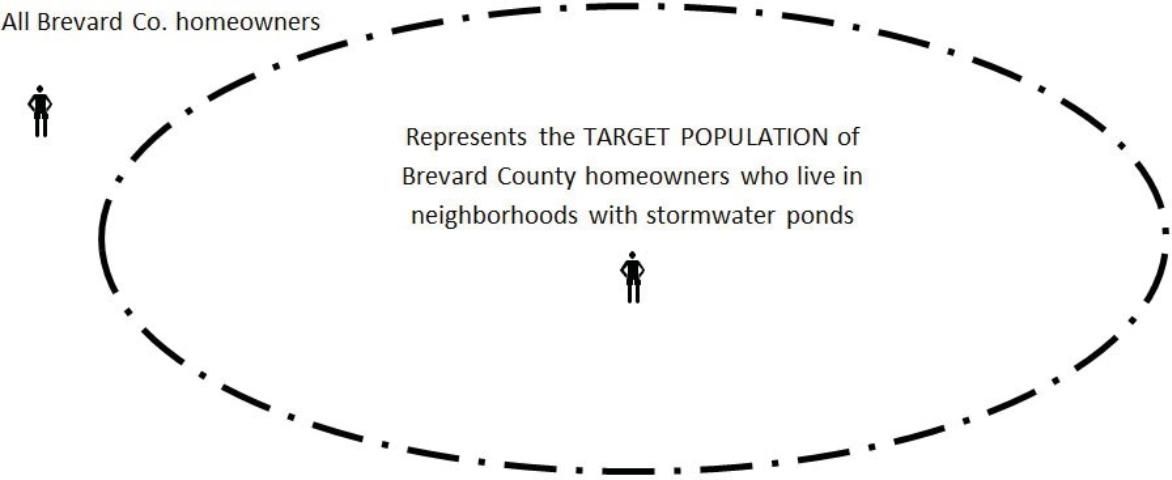
- In this situation, the population of interest (or target population) would include any homeowner living in a Brevard County neighborhood with a stormwater pond.
- It would not include homeowners living in a Brevard County neighborhood without a stormwater pond.
The box in Figure 1 represents all Brevard County homeowners, while the oval represents the target population of local homeowners who live in neighborhoods with stormwater ponds. Note that a large number of Brevard County homeowners fall outside of the target population.

Even when the excluded set of homeowners is removed, the oval still represents a very large number of people. In this instance, collecting information from everyone in a population of interest presents the agent with an impossible or impractical task. Instead, it would be a better use of time and resources to capture this information from a sample or a portion of the larger population of interest. A sample consists of all the elements (individuals, households, etc.) of the target population that have been chosen to participate in the survey. These elements are commonly selected from a sampling frame.
A sampling frame is a list of elements from which the sample is drawn. This list is typically constructed from information gathered from organizational, local, state, or national databases or directories. Surveyors use a number of lists to create sampling frames. These pre-existing lists' practicality varies with the study's purpose and the sample type.
Some Lists Include
- Lists of drivers' licenses (commonly employed in general state- and county-level surveys)
- Lists of utility company users (telephone, electric, water, and sewage)
- Lists from the tax collector or assessor (property owners)
- Lists of Extension clients/program attendees
- Lists of community or organizational directories
- Address-based lists purchased from a vendor
These lists are useful for need and asset assessments or sur- veys designed to evaluate exposure to mass media Exten- sion programs. Lists of Extension clients or organizational directories can also be used to assess program outcomes for specific groups (e.g., citrus growers or 4-H leaders).
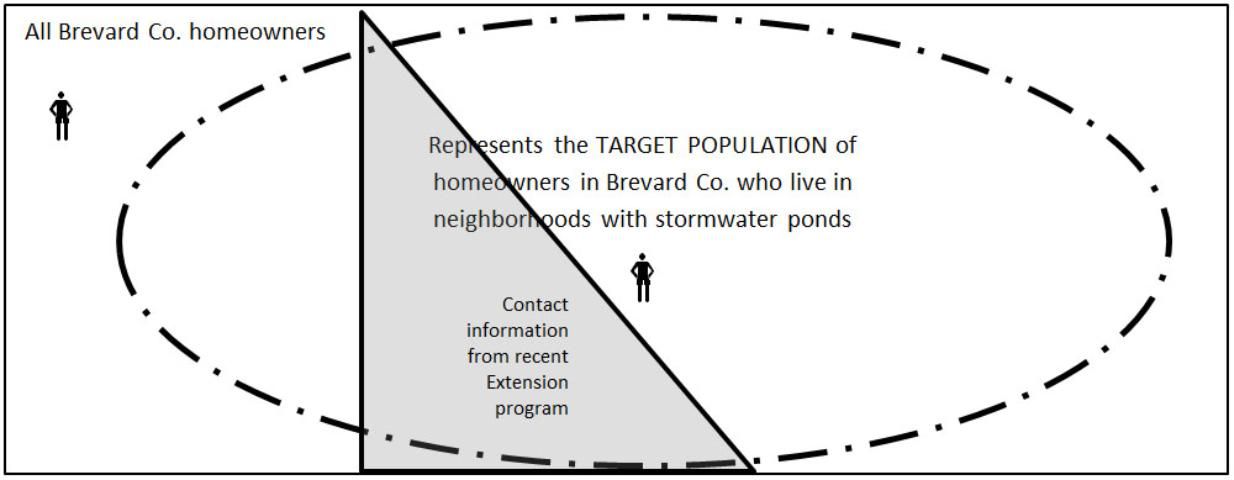
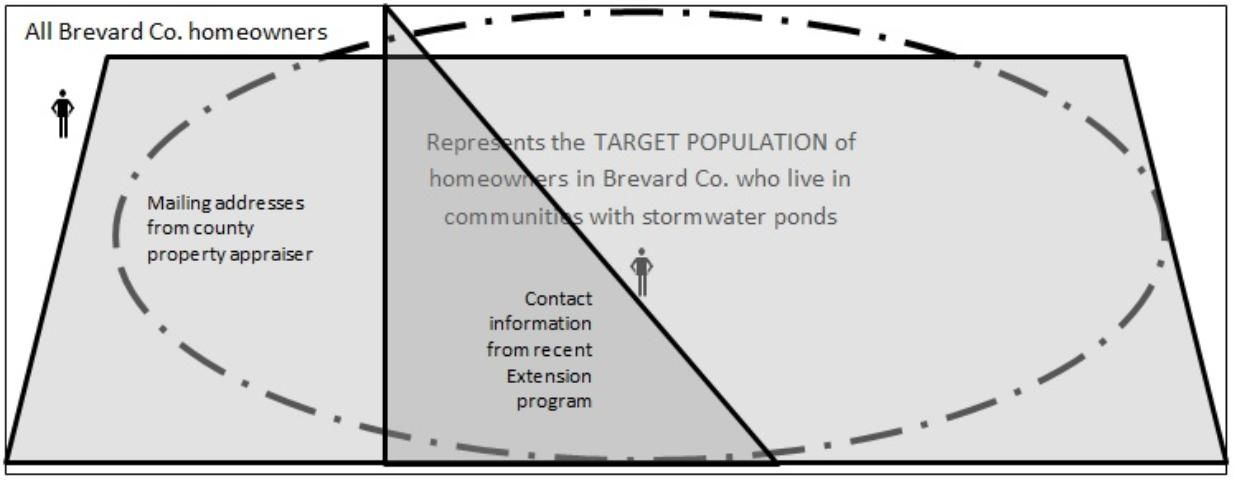
When constructing the sampling frame, careful consideration should be taken to include as many people within the target population as possible. This process may require using multiple databases to construct a robust sampling frame. Figures 2a and 2b provide an illustration of how a weak sampling frame and a strong sampling frame might impact the data captured. A weak sampling frame is characterized as a list of sampling elements that do not accurately reflect the target population. By contrast, a strong sampling frame is more likely to reflect the target population on the measured characteristics.


Since only a small portion of the target population is captured by contact information from a recent Extension program, Figure 2a represents a weak sampling frame. This sampling frame is also weak because it included people who fall outside of the targeted group. Both of these issues represent a type of coverage error. This is important if the agent wants to generalize his or her findings to the population as a whole, since the agent is potentially including responses from outside the population of interest.
Figure 2b represents a stronger sampling frame because it captures more of the target population, but it also has weaknesses. This frame captures homeowners outside the target population as well and overlaps with the pre-existing contact information from the initial contact list. Although this image contains some coverage error as well, it is possible to address both issues with a little time and data cleaning.
Dealing with Coverage Error
Ultimately, a sampling frame seeks to identify every element separately and uniquely (once and only once), with nothing else appearing on the list (Kish, 1965). When this is accomplished, coverage error (and the bias that comes along with it) is reduced, which increases the surveyor's confidence in the generalized results from the sampled group to the target population.
As demonstrated above, there are many instances when the sampling frame does not contain the same exact elements as the target population, which has the desired information. In order to reduce coverage error, the surveyor should ask some basic questions about a sampling frame.
These Questions Include
- How old is the list? Is it likely to be outdated?
- If so, it might be best to find a more up-to-date source.
- Does the list contain everyone in the target population (all elements desired to generalize the survey results)?
- If not, combine multiple lists to capture the same informa- tion for the missing portion of the target population.
- Is the list maintained and updated? How often? By whom?
- If so, contact the maintaining body to make sure the list is as up-to-date as possible.
- Are there names of people who are not in the survey population on the list?
- If so, plan time to review and eliminate those names before beginning the survey.
- Is it possible that some sampling elements are repeated on the list?
- Again, plan time to eliminate duplicate names before selecting the sample.
- What information on the list can help determine the best mode(s) for use in delivering the questionnaire?
- Certain information types require particular modes—i.e., if you only have physical addresses, an online survey may be of little or no use.
Answering these questions builds confidence in the sampling frame's ability to represent the target population. Once the sampling frame has been identified, progress on to the decision of how to sample.
Selecting the Sample
With the target population defined and the sampling frame constructed, it is time to select the sampled group that will be asked to participate in the survey. As previously stated, the common sampling process goal is to create an element subgroup that is as closely representative of the larger, targeted population as possible. If this is the goal, then conducting a probability sample will result in data statisti- cally similar to data that would have been generated if the entire target population was surveyed. When creating a representative sample is not necessary, however, a nonprob- ability sample can be conducted.
Nonprobability and Probability Samples
Nonprobability samples use various selection procedures that result in the chance of any element (e.g., person, household) being selected unknown. Without a known probability for selection, generalizing the findings is not warranted. However, nonprobability samples can be valuable when used appropriately.
The quality of a nonprobability sample depends on the survey designer's knowledge, judgment, and expertise.
Two Common Nonprobability Sample Types in Extension
- Convenience Sample: A element is self-selected (e.g., volunteers) or easily accessible.
- For example, self-selected individuals respond to reaction surveys at the end of an Extension workshop or field day.
- These samples must be used with extreme caution when inferring the extent of needs in a population or the impacts resulting from a program.
- Purposive Sample: Selection is based on characteristics or attributes that are important to the evaluation (Smith 1983); sometimes based on extreme or critical elements.
- For example, evaluating technology adoption rates by farmers might use a sample of extreme elements (e.g., farms of 1,000 or more acres and farms of 100 acres or less) to provide information for a large farm/small farm comparison.
A small purposive sample can also field test the survey instrument for a larger sample (Sudman, 1976) to poten- tially identify problem questions that can be corrected before the larger survey is implemented.
Four Common Probability Sample Types
A probability sample is one in which "every element in the population has a known, nonzero probability of selection" (Sudman, 1976). Because the probability for selection is known, the statistical data generated from the sample can be generalized to the target population (within a given level of precision and confidence). Probability sample types include simple random, stratified random, systematic, and cluster/area. Probability samples are generally preferred over nonprobability samples because the risk of incorrectly generalizing the population is known. Additional informa- tion about each sample type can be found in Israel (2021).
A brief description of each probability sample type:
- Simple Random Sample: The easiest, least complex sample to select; within this method, each element on the list has an equal probability and independent chance of selection.
- Typically, each element on the sampling frame (e.g., name) is assigned a number.
- Then, those numbers are selected from a table of random numbers or randomly generated by a computer program and are placed into the sample group.
- This process continues until the desired sample size is reached. (For more information about determining sample size, see Israel, 1992.)
- Although simple random samples are easy to select, they have one undesirable quality: On rare occasions, it is possible to select a sample that is far from the true population mean (Slonim, 1957). This is particularly true when obtaining a relatively small sample because these have a larger sampling error (or less precision) than large samples. One way to avoid getting an "extreme" sample is to use a stratified sample instead.
- Stratified Random Sample: Used to improve the characteristics of the sample more than a simple random sample would by arranging the population into strata (groups). Some stratified random samples are also used in evaluation studies to compare equal numbers of participants and nonparticipants.
- Within each stratum (individual group), a separate sub-sample is randomly selected. Therefore, stratified samples are more accurate than random samples because each stratum is well-represented in the overall sample.
- Age, sex, race, and ethnicity are common characteristics for stratifying samples.
- This demographic information must be obtained about the target population prior to the sampling process.
- Systematic Sample: Widely used and easy to implement; a systematic sample selects a desired proportion of elements from the target population. This is done by determining the sampling interval, (every jth element, which is the inverse of the sampling proportion), and then randomly selecting the first element between 1 and j in the list. After that, every jth element on the list becomes part of the sample (see Israel, 2021).
- Systematic samples, like simple random samples, give each element an equal, but not independent, chance of being selected.
- This procedure can also be used if there is not a list when the elements are arranged in space, such as houses along a road.
- If the population arrangement on the list (or road) has some pattern, however, then the sample may be inherently biased. For example, if a directory of couples always listed the man first, an interval that caused an odd number to always be selected would include only men in the sample.
- Cluster or Area Sample: a method of selecting sampling elements in which the element contains a cluster of elements (Kish, 1965).
- Can be used when a list of the entire population is nonexistent or hard to obtain or the cost of surveying dispersed individuals is prohibitive.
- Some types of clusters and associated elements are businesses and employees, schools and students, city blocks and dwellings, and counties/states and residents.
- Individual clusters in cluster samples should be as heterogeneous as possible.
- The unit of analysis can be either the cluster (the school) or the elements within the cluster (students).
How many to sample?
Determining the sample size can be a challenge because it depends on the survey's purpose and several other factors. When conducting a need and asset assessment at the county or state level, a random sample of 400 would be considered the smallest appropriate sample, while 1,100 would be viewed as robust. And, in a typical diabetes program survey, all 30 participants should be in the sample. These examples illustrate some considerations when selecting a sample, but more information about how variance, confidence level, and sampling precision affect the decision on the probability samples' size can be found in Determining Sample Size (Israel, 1992).
Summary
This publication in the Savvy Survey Series focused on introducing information that agents should consider when thinking about who should be surveyed. Agents will explore topics such as understanding the survey population, defining a sample, and constructing the sampling frame, while recognizing who exists outside the population of interest. The publication also provides insight on issues such as over-coverage, error, and bias that can arise because of poor sampling procedures.
References
Israel, G. D. (1992). Determining Sample Size. PEOD-6. Gainesville: University of Florida Institute of Food and Agriculture Sciences.
Israel, G. D. (2021). Sampling the Evidence of Extension Program Impact. PD005. Gainesville: University of Florida Institute of Food and Agriculture Sciences. https://edis.ifas.ufl.edu/pd005
Kish, L. (1965). Survey Sampling. New York: John Wiley and Sons, Inc.
Slonim, M. J. (1957). Sampling in a Nutshell. Journal of the American Statistical Association 52(278): 143–161.
Smith, M. F. (1983). Sampling Considerations in Evaluating Cooperative Extension Programs. Bulletin PE-1. Gainesville: University of Florida Institute of Food and Agriculture Sciences.
Sudman, S. (1976). Applied Sampling. New York: Academic Press.