Introduction
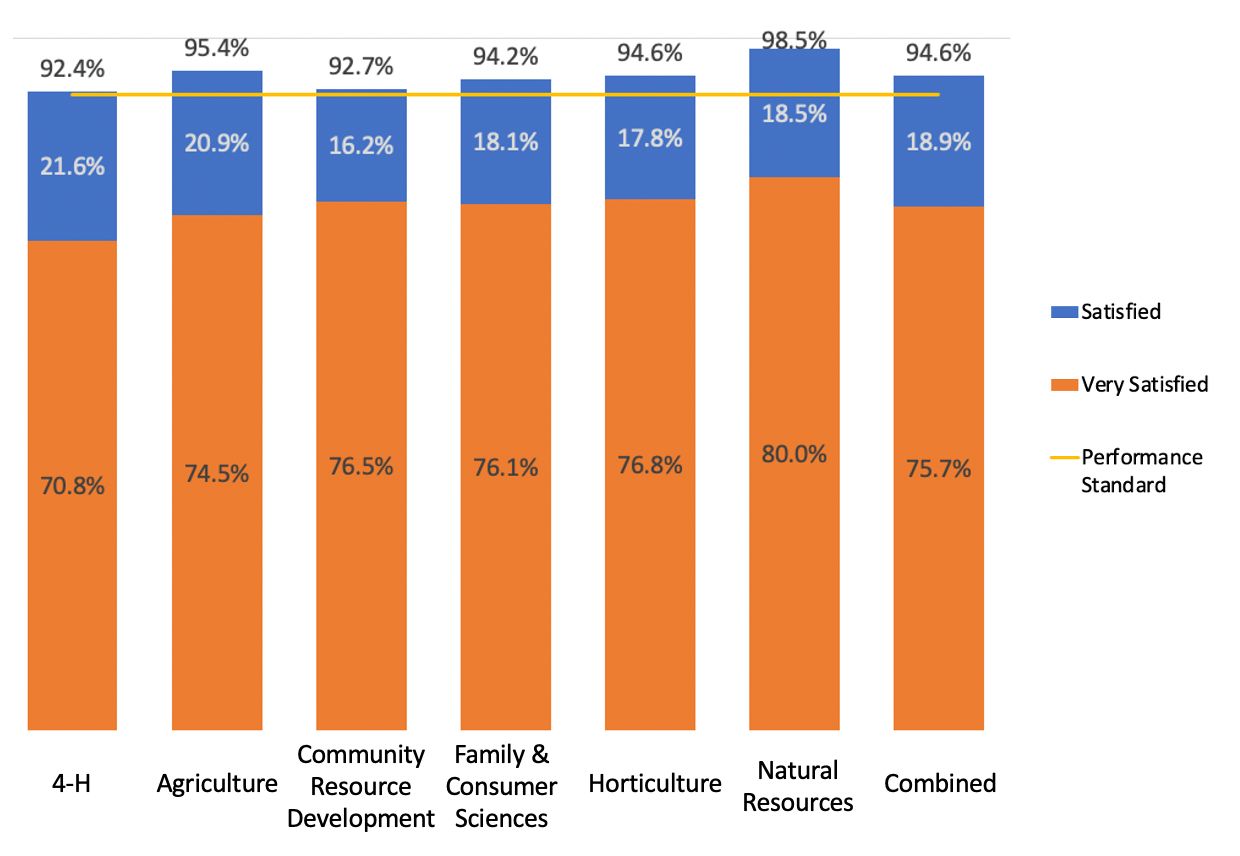
The quality of services and additional outcomes provided by UF/IFAS Extension has been measured every year since 1997 using the Client Experience Survey (originally known as the Customer Satisfaction Survey). In 2002, the UF/IFAS Extension performance standard was established such that 92% of clientele will be “satisfied” or “very satisfied” with the quality of the service received, and although the formal requirement was later discontinued, 92% has continued to serve as the informal benchmark for Extension’s performance (Florida Board of Education, 2002; Israel & Galindo-Gonzalez, 2009).
At the state level, the perception of quality has continued to meet this benchmark. The 2020 survey showed 94% of clients were satisfied with their experience with Extension statewide (UF/IFAS, 2020). Recent surveys have shown Extension to be consistent in achieving this high standard, with a 95% satisfaction rate in both 2018 and 2019 (UF/IFAS, 2018, 2019). A summary of the overall satisfaction of Extension clients, their perception of benefits, and other Extension impacts is published annually at https://pdec.ifas.ufl.edu/satisfaction/. Additional studies have used the Client Experience Survey data to explore the effects of diversity, gender, type of contact, and agent/client homophily on overall satisfaction and outcomes (Galindo-Gonzalez et al., 2017; Galindo-Gonzalez & Israel, 2010; Israel & Galindo-Gonzalez, 2009; Strong & Israel, 2009).
Because UF/IFAS Extension strives to meet the needs and expectations of the diverse and modern clientele it serves, it does this in part through the specialization of program areas. This publication examines some of the larger program areas within UF/IFAS Extension: 4-H Youth Development, Community Resource Development, Family & Consumer Sciences, Agriculture, Horticulture, and Natural Resources. These six program areas are not all encompassing of Extension services but provide a general overview for Extension at the state level. Survey responses were from a wide variety of offered programs and services. Although they were grouped into six main program areas, there is still a large diversity of clients, program goals, and program design. For example, clients surveyed who interacted with Agriculture may have had an agent visit their property to diagnose a disease or may have attended a group educational program on integrated pest management.
This study explores the effect of Extension program area on the perceptions of clientele regarding their overall satisfaction, perceptions of the quality of services, and benefits of services provided by Extension.
Client Experience Survey Methods
The Client Experience Survey is sent out via mail and email to selected clients who have either attended a planned activity such as a workshop, visited the Extension office or received a site visit by an Extension agent, or contacted the office by telephone or email for information. The 67 counties are on a scheduled 5-year rotation, and the sample is structured so that about half of the clients selected attended a planned program or activity and the other half were “walk-in” and phone/email clients (Israel, 2020). The study described in this document utilizes 5,441 responses from the 2016 through 2020 surveys. Responses were assigned to one of six categories based on the Extension program that a client had contact with.
Client Satisfaction
No significant associations were found between the Extension program area related to client’s contact and their overall perception of quality of Extension services. Not only is UF/IFAS Extension meeting the performance standard, but that benchmark is being met in all program areas as well (Figure 1).

Credit: undefined
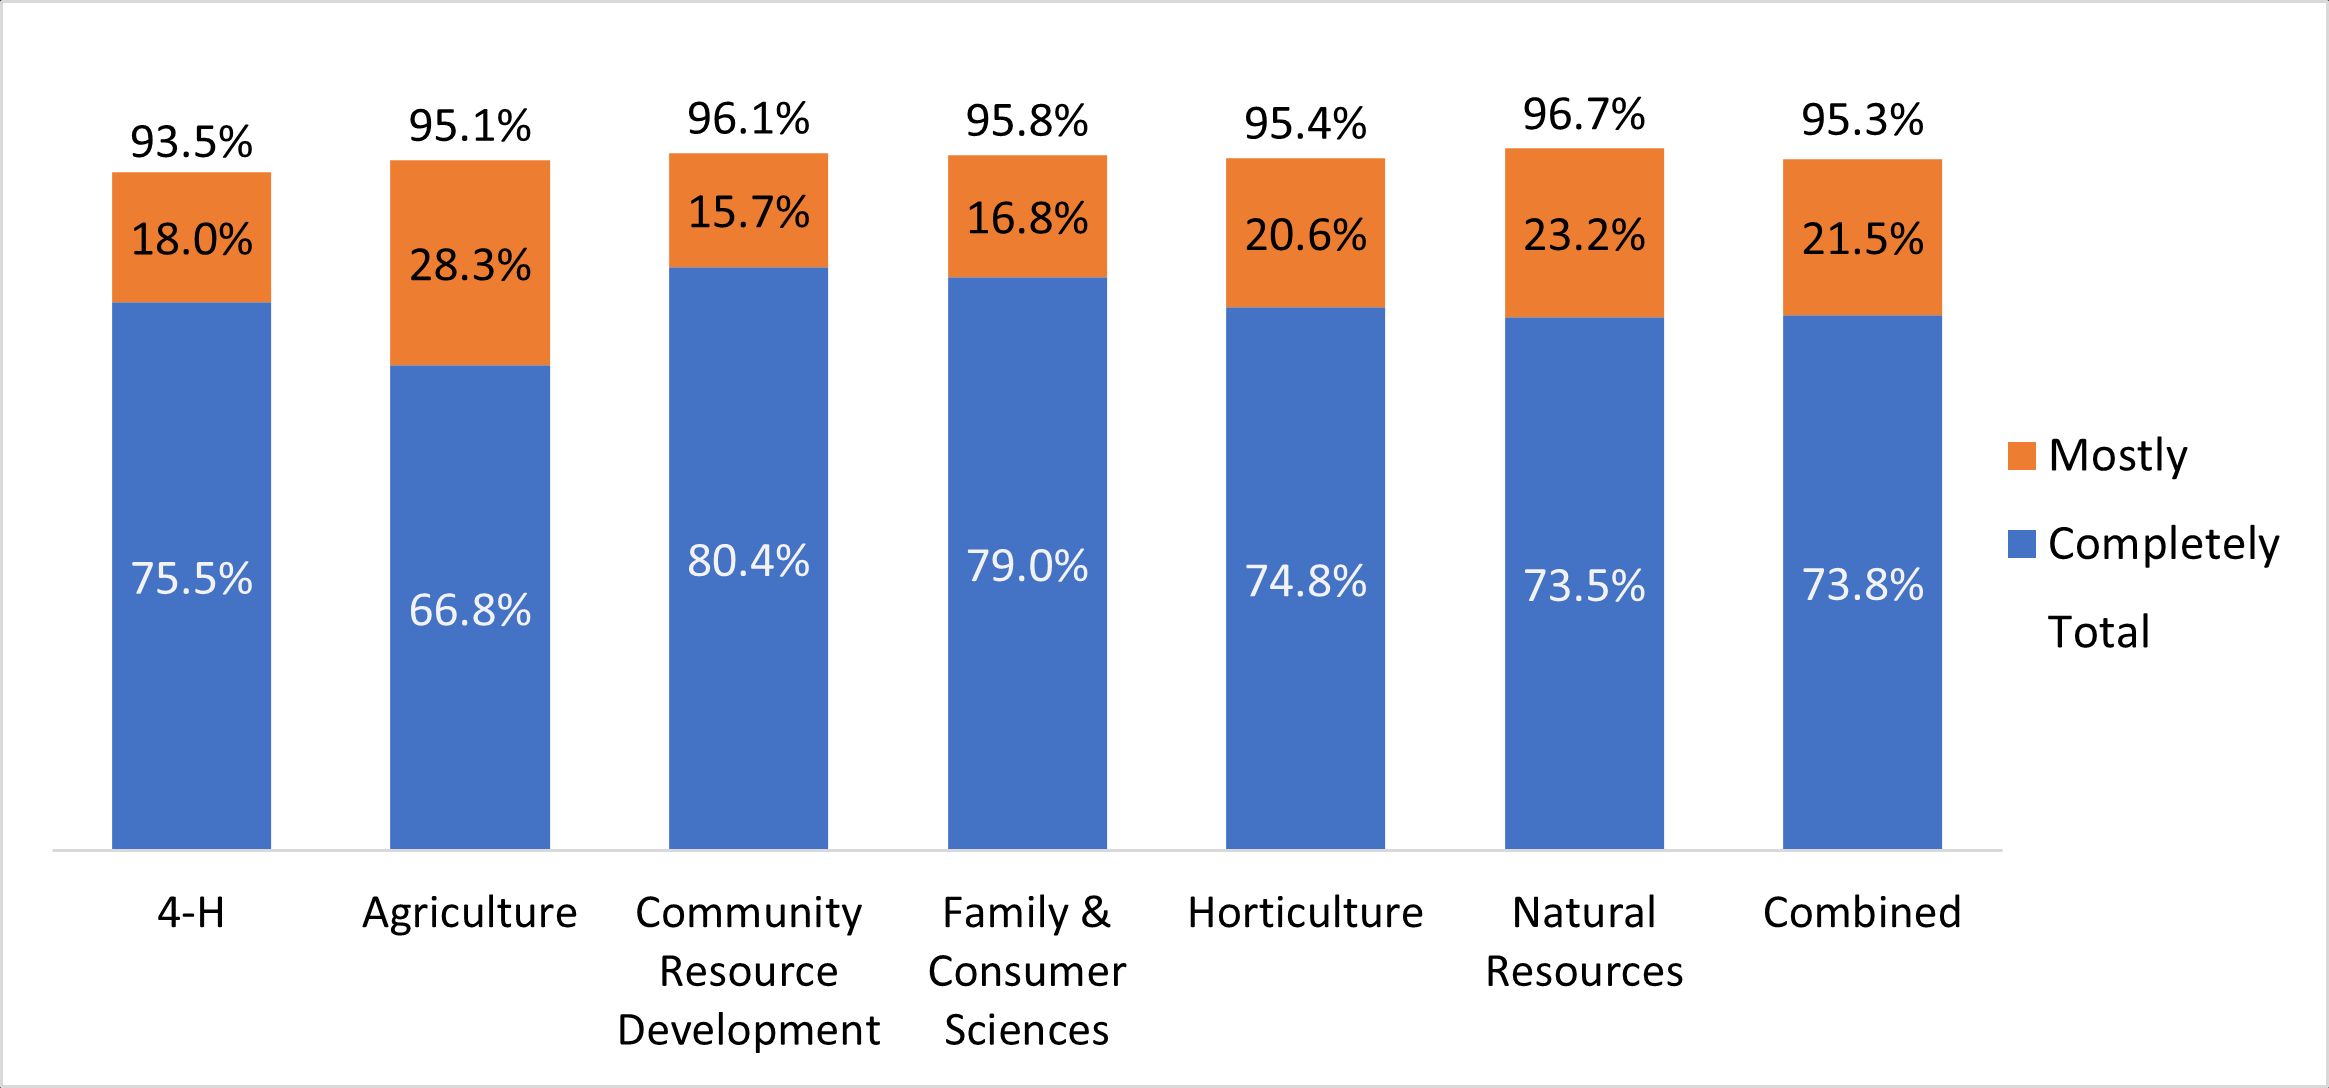
In addition to overall satisfaction, the survey collects data on the perception of quality of services related to the information provided by the Extension office. Overall, differences in perceptions between the program areas and specific aspects of service quality were small and nonsignificant. High ratings were observed for information being up to date (96.6% of clients rated their experience in the top two categories of “mostly” or “completely”), delivered in time to be useful (94.2% said “mostly” or “completely”), and communicated in a way that was easy to understand the information (95.3% said “mostly” or “completely”). Although a large percentage of clients had a positive rating for information being easy to understand, those obtaining information in Agriculture programs were more likely to say “mostly” in comparison to clients getting information from Community Resource Development or Family and Consumer Sciences programs (Figure 2). Reasons for this difference might include the technical nature of some agricultural information (which makes it harder to understand) and the greater involvement of state specialists and agents with PhDs in teaching segments of these programs (previous studies suggest PhDs are more likely to teach “over the heads” of clients; see Terry and Israel, 2004).

Credit: undefined
The perceived relevance to the client’s situation or need was the lowest of the indicators of service quality, with 90.9% of clients saying it was “mostly” or “completely” relevant; this varied little across the program areas. The lower rating for relevancy of information would most likely be linked to planned programs, where clients are receiving more information that may not be relevant in timing or applicability to some clients’ specific situation.
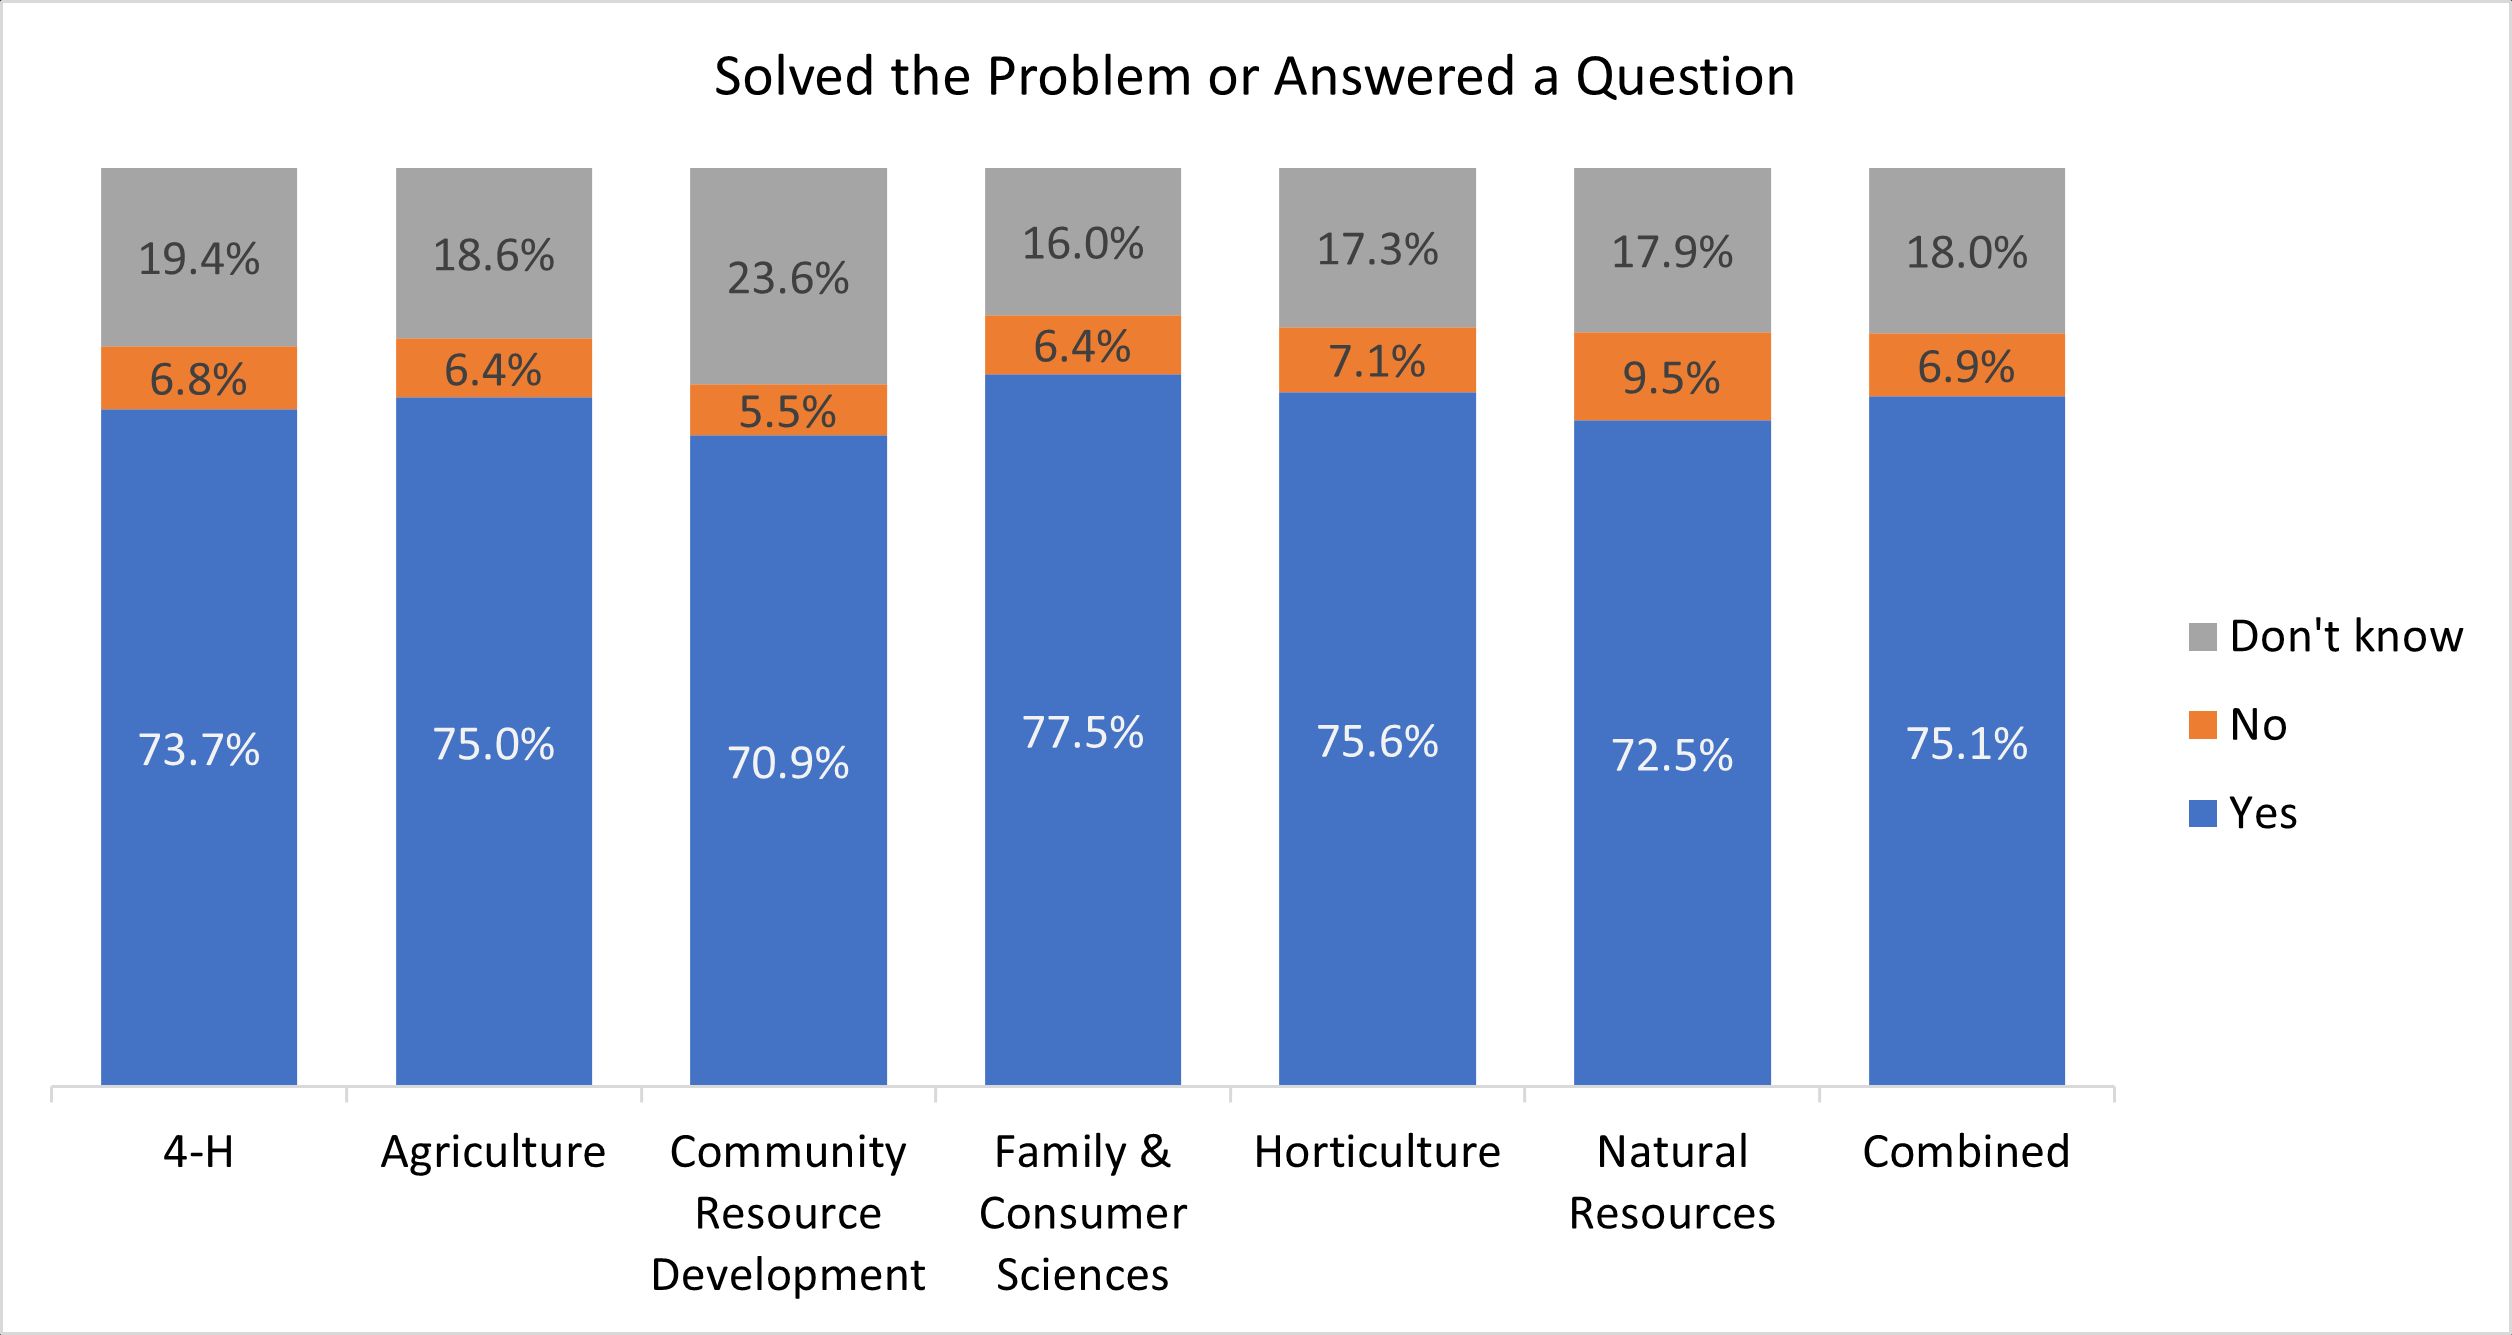
Of those having the opportunity to use information from Extension, three-fourths of clients also reported that the information solved a problem or answered their initial question. Differences between the program areas were small and nonsignificant (Figure 3).

Credit: undefined
Perceived Benefits
In addition to measuring satisfaction with Extension, the Client Experience Survey also collects data on perceived benefits. Clientele were asked whether they have benefitted in the various ways from their experience with an Extension service. Across all program areas, 92% of Extension’s clients felt that they benefitted in at least one way. Respondents were provided with a list of potential benefits including “saved me money,” “increased my income,” “improved my health and/or well-being,” “helped me conserve water or energy better,” and “developed my skills as a leader or volunteer.”
Given the wide variety of services provided by the different program areas within UF/IFAS Extension, there is an expectation for variation in the benefits perceived. A statistically significant association exists between the surveyed benefits and the Extension program area that a client interacted with (Table 1). Two benefits showed a greater degree of association with a specific program area. Both the increased income and leadership skill development benefits showed stronger statistical relationships with program area than the other benefits.
With respect to the perceived benefit of developing skills as a leader or volunteer, 4-H Youth Development and Natural Resources led all other Extension program areas. For 4-H, this can partially be attributed to the high number of group leaders within 4-H survey respondents and the fact that volunteer development is a primary objective for 4-H Extension programs. Although 4-H programs often emphasize healthy living principles, it is notable that 4-H client responses do not reflect improved health as a strong program benefit. However, this may also be a result of the 4-H survey population being primarily group leaders and not the intended audience of healthy living curriculum. Meanwhile, Family & Consumer Sciences (FCS) programs often feature healthy living programming, which could have contributed to FCS leading Extension program areas in respondents noting an improved health benefit. These healthy living principles are significantly highlighted by the Expanded Food and Nutrition Education Program (EFNEP) and the Family Nutrition Program (FNP) that are delivered as part of this program area.
Natural Resources was the second key program area for clients perceiving a benefit of developing leadership or volunteer skills. Many of the programs within this area, including Sea Grant, focus on education and training to accomplish goals. For clients participating in volunteer-based training programs such as Master Naturalist and large-scale volunteer efforts under the umbrella of citizen science, the connection between personal benefit and Extension experience is clear. Skill development was not the only clear connection for Natural Resources; the program area was also a leader for participants noting that they were helped to conserve water or energy better. Horticulture was an additional leader in this area, which can be partially attributed to programs working with individuals and communities on landscape maintenance, irrigation, and the Florida-Friendly Landscaping™ Program. Agriculture, although similar in an environmental focus to Natural Resources and Horticulture, did not see this water and energy conservation benefit as strongly as the other two areas. Agriculture’s clients were more likely to note increased income as a benefit. This is potentially related to Extension agriculture having more programs aimed at industry and consultation services at the business level.
Table 1: Percentage of clients who perceived each benefit by Extension program area.
Conclusions and Recommendations
The results have shown that in overall client satisfaction, UF/IFAS Extension performs consistently across all program areas. This consistency is also present in the key dimensions of service quality and outcomes related to Extension’s knowledge distribution and accessibility goals. Some specialization of the program areas is present in the benefits perceived by Extension clientele. Clients are more likely to perceive the development of leadership or volunteer skills when interacting with 4-H Youth Development or Natural Resources. The perception of the experience leading to increased income is most likely after interacting with Agriculture. Family & Consumer Sciences leads the other program areas in clients perceiving improved health as a benefit to their experience.
UF/IFAS Extension is meeting performance standards for client satisfaction in all program areas. Expanding beyond traditional benchmarks is helpful for continued success and future growth of Extension. Perceived benefits are a key part of the value people see in Extension services beyond solving an immediate need.
Two key actions can be recommended from this study. First, Extension should continue to investigate the benefits perceived by clients at the statewide level. The Client Experience Survey’s open-ended question as well as additional surveys being completed at the county or program level can provide data for future studies. Elaborating on the perceived benefits will help guide Extension leadership at the state and local level in how to strengthen relationships with clients. Current Client Experience Survey data allows Extension to look at perceived benefits in the short term, but many Extension services target extended use or long-term solutions. Extension services are also targeted at both individuals as well as businesses and industry. Outcomes to these client groups should be handled appropriately, as some benefits apply more to some individuals and industries than others. Further study on the perceived benefits of Extension programs will not just allow for a better understanding of Extension’s current relationship with its clientele, but also assist to identify gaps in perception and program design.
Second, Extension should focus on client perception within its communication and marketing goals. There is overlap between the designed outcome and educational goals of many Extension services and the perceived benefits on the Client Experience Survey. Many clients may be benefiting from Extension services in the way these services are designed, but some clients may not perceive the benefit or associate the connection to their experience with Extension. Additionally, the relationship between benefits could be better communicated with the broader public—for example, how conserving water can lead to saving money. Extension should work on communicating benefits more clearly to close the perception gap.
References
Florida Board of Education. (2002). State Universities’ Accountability Report. December 10, 2002. Tallahassee, FL: author.
Galindo-Gonzalez, S., & Israel, G. D. (2010). The influence of type of contact with Extension on client satisfaction. Journal of Extension, 48(1), 1–14. https://archives.joe.org/joe/2010february/a4.php
Galindo-Gonzalez, S., Israel, G. D., Weston, M., & Israel, K. A. (2017). Extension program and customer satisfaction: Are we serving all clients well? EDIS 2017(2). https://edis.ifas.ufl.edu/publication/wc070
Israel, G. D. (2020). Florida Cooperative Extension Service’s Client Experience Survey Protocol. https://pdec.ifas.ufl.edu/satisfaction/
Israel, G. D., & Galindo-Gonzalez, S. (2009). Diverse market segments and customer satisfaction: Does Extension serve all clients well? Journal of International Agricultural and Extension Education, 16(1), 89–103. https://doi.org/10.5191/jiaee.2009.16107. https://pdec.ifas.ufl.edu/satisfaction/articles/Israel%20and%20Galindo-Diverse%20Market%20Segments%20and%20Customer%20Satisfaction.pdf. Accessed February 14, 2023.
Strong, R., & Israel, G. D. (2009). The influence of agent/client homophily on adult perceptions about Extension’s quality of service. Journal of Southern Agricultural Education Research, 59, 70–80. https://pdec.ifas.ufl.edu/satisfaction/articles/Strong and Israel-The Influence of Agent-Client Homophily.pdf
Terry, B. D., & Israel, G. D. 2004. Agent performance and consumer satisfaction. Journal of Extension, 42(6). https://archives.joe.org/joe/2004december/a4.php
UF/IFAS. (2018). Customer satisfaction fact sheet. UF/IFAS Program Development & Evaluation Center. https://pdec.ifas.ufl.edu/impacts/CES/CSS_2018.pdf. Accessed February 14, 2023.
UF/IFAS. (2019). Customer satisfaction fact sheet. UF/IFAS Program Development & Evaluation Center. https://pdec.ifas.ufl.edu/impacts/CES/CSS_2019.pdf. Accessed February 14, 2023.
UF/IFAS. (2020). Customer satisfaction fact sheet. UF/IFAS Program Development & Evaluation Center. https://pdec.ifas.ufl.edu/impacts/CES/CSS_2020.pdf. Accessed February 14, 2023.