Introduction
Plant disease decision support systems are management tools that help to assess the risk of disease epidemics. The application of such systems enables users to apply fungicides only when conditions are favorable for disease development so that they can avoid unnecessary sprays and reduce production costs.
Equations to predict anthracnose and Botrytis fruit rots based on temperature and leaf wetness duration were evaluated in field trials during four strawberry seasons. Our results have shown that fungicide applications could be reduced by half in some years by following the recommendations of the system without affecting disease control, fruit quality, and yield. The best treatment for each disease was incorporated into the Strawberry Advisory System (StAS), a web-based decision support system to make recommendations on timing of fungicide applications for control of anthracnose and Botrytis fruit rot epidemics on strawberries.
StAS was developed as a tool under AgroClimate (http://agroclimate.org), and it can also be found on the FAWN website (https://fawn.ifas.ufl.edu). The system has been recently expanded to several other strawberry-producing states in the US When accessing the system via the http://agroclimate.org/tools/sas/ website, one can choose the state to be shown on the main page by adding its acronym on the end of the website address (e.g. http://agroclimate.org/tools/sas/fl/).
Strawberry Diseases
Anthracnose fruit rot, caused by Colletotrichum acutatum, and Botrytis fruit rot, caused by Botrytis cinerea, are the most important diseases of annual strawberry in Central Florida and worldwide. C. acutatum affects the foliage, runners, crowns, and fruit. Its development is favored by temperatures greater than 65°F and wet weather (>12h of Leaf Wetness – LW). Losses due to anthracnose can exceed 50% when conditions favor disease development, even in well-managed fields.
Botrytis fruit rot is an important pre- and post-harvest disease of strawberry affecting the floral parts, including stamens, petals, and fruit. The spores are wind- and splash-dispersed, and the fungus requires free moisture (>6h of LW) and temperatures between 60°F and 72°F to infect and sporulate. The disease can be controlled by a combination of cultural practices and chemical methods. Strawberry cultivars vary in susceptibility, but no cultivar is completely resistant to the disease.
In Florida, control for anthracnose and Botrytis fruit rots was based on preventive weekly applications of fungicides throughout the season.
The Strawberry Advisory System
The information available in the AgroClimate Strawberry Advisory System includes the monitoring of weather data and forecast of disease incidence. The information is displayed in a GIS format using Google Maps. Since the maps supplied by Google are based on satellite imagery and worldwide information, users of this tool can interact with the map through page movements and zoom.
The system was developed to facilitate the inclusion of new diseases and locations (stations). It is completely dynamic with different levels of users who handle the information.
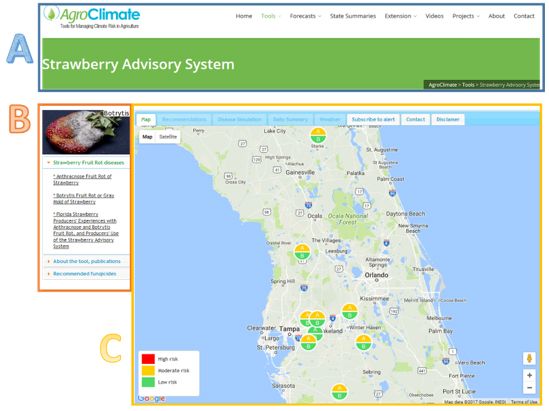
The Strawberry Advisory System, when loaded, displays to the user a page divided in three different sections (Figure 1). Section A (Figure 1A) shows information about the AgroClimate portal, extension materials, contact information, the gate to the administration page, and other tools. In section B (Figure 1B), the user can easily find the current news and important articles prepared by extension specialists. When a specific weather station is selected, the map in section C (Figure 1C) is moved to the corresponding location, showing information related to the selected station. The user can then click on the "click for recommendations" button to access local specific recommendations for that area. The core of the system is found in section C on the map (Figure 1C). All functions developed for the system are presented in this area.
The components of the system are divided in the four sections listed below:
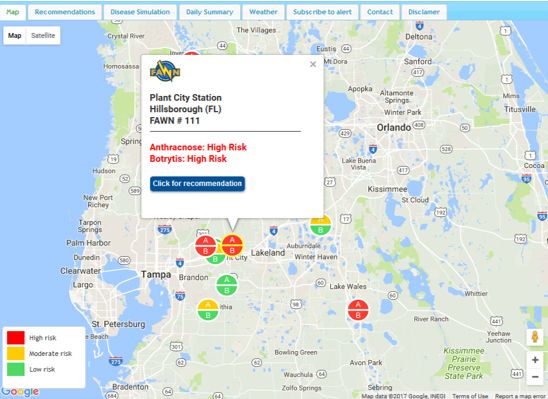
- Map of strawberry-producing regions showing weather stations with a color flag for the current disease risk level (High risk, Moderate risk, or Low risk; A: Anthracnose; B: Botrytis) (Figure 2);
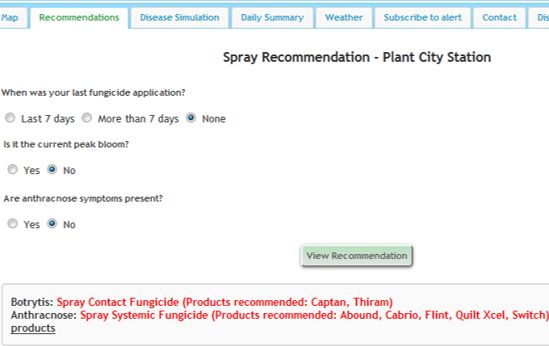
- Spray recommendations for Botrytis and anthracnose based on a list of questions about previous fungicide applications and the stage of crop development (Figure 3);
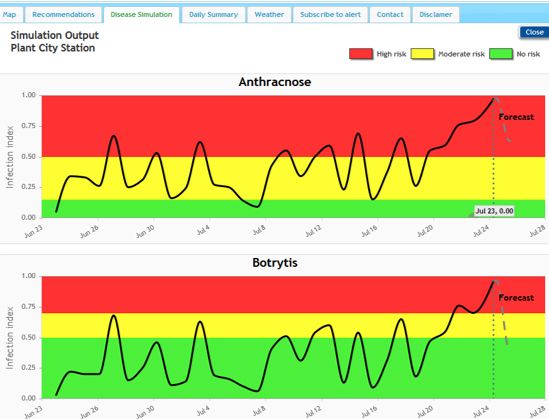
- Model outputs in graphic formats indicating risk levels (High risk, Moderate risk, or Low risk) based on weather data observed at the selected station and forecast for the next two days using data from the National Weather Service (NSW) pinpoint forecast (Figure 4); and
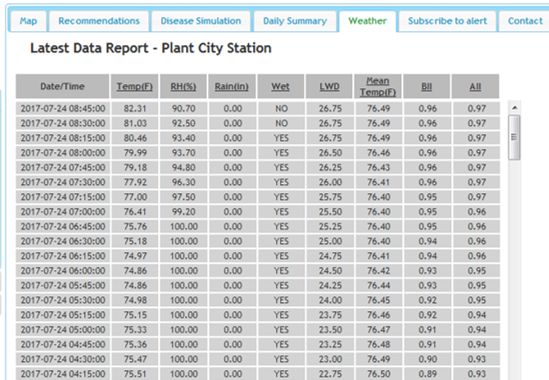
- Display of weather data during the most recent 48-hour period (Figure 5).
Simple tools that can provide the information in a clear and objective way are usually sought by decision-makers. Based on this idea, the system starts by showing the available weather stations, using different colors to quickly show whether conditions are favorable for diseases or not (Figure 1C). Three different colors were used in this case: green (Low risk), yellow (Moderate risk) and red (High risk). By passing the mouse over the stations, the user can check the name of that weather station and which specific diseases are affecting that area.
If more information is needed, users can select the weather station with a simple click and get more specific information in a balloon (Figure 2). If the information available is sufficient, the system can be closed. If still more information is needed to make a decision, the user can click on the link to check recommendations, which is expanded and presents a list of questions for guidance.
Fungicide Spray Recommendations
With the presence of either moderate- or high-risk disease levels, a list of questions is displayed and the user must enter the required information before a recommendation is provided by the system (Figure 3). In this case, the recommendation is based on a set of rules that take into account previous fungicide applications and the current stage of development of the crop since bloom is the most critical stage. Once the responses are entered, the system applies the rules and displays the recommendation for each of the diseases in the form of one of the following messages:
- No spray!
- Spray Systemic Fungicide (Products recommended: LIST1)
- Spray Contact Fungicide (Products recommended: LIST1)
Disease Simulation Outputs
The disease models are automatically processed every hour, and their results are presented through the "Disease Simulation" tab on the Web tool. Figure 4 demonstrates how the results are presented, showing a plot of infection index values for each anthracnose and Botrytis fruit rot. The plots show simulated infection indexes for the last 30 days. The dashed line (right side of the plot) indicates the forecast infection index level for the following two days. As in the main map (station markers), the disease risk thresholds are divided into three colors: green (Low risk), yellow (Moderate risk) and red (High risk). A disease alert is considered when the line crosses the moderate or high level threshold. When the user clicks on the graph, an expanded window is opened, allowing the visualization of details.
Next to the "Disease Simulation" tab users find the "Daily Summary" tab, in which the disease simulation outputs are presented in a tabular format. Each line in the table contains the date, number of uninterrupted hours of leaf wetness, temperature in degrees Fahrenheit and Celsius, disease infection index (0-1), and a respective description of disease level (Low risk, Moderate risk, or High risk). The disease simulation can be observed up to the current date and time.
Weather Data
The observed weather provided by the Florida Automated Weather Network (FAWN) is presented through the "Weather" tab. Such information is useful for decision-making, assisting the users in understanding the weather phenomena associated with diseases. This component presents weather variables for the last 48 hours, such as temperature, relative humidity, rain, leaf wetness duration, and the average temperature during the wet period (Figure 5).
E-mail, Short Message Service, and Mobile App
E-mail and Short Message Service (SMS) technologies are available during the strawberry season to provide information to growers and Extension agents rapidly. The system automatically sends SMS messages (Figure 6) and e-mails to registered users whenever the infection index calculated crosses an established threshold.
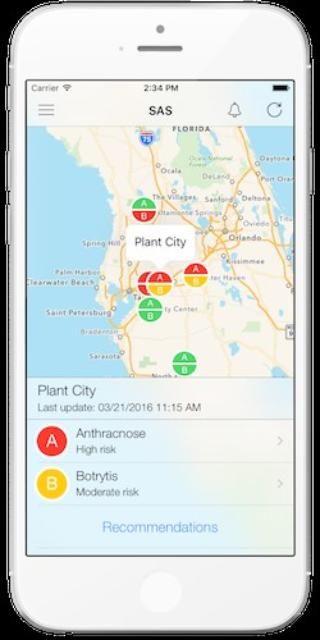
The communication via SMS is reasonably inexpensive and gives the system the ability to communicate with users at any time, anywhere. Recently, the SAS mobile app was released, allowing users to access the system from their smart phones.
Conclusions
The Strawberry Advisory System has been evaluated in research field trials for several strawberry seasons and has also been evaluated on commercial strawberry farms for five consecutive seasons. In most cases, the number of fungicide applications (sprays) was reduced without any significant loss of yield or quality. The use of the system can help growers to reduce the number of sprays and production costs, especially in years when the conditions for disease are not highly favorable.
This internet-based decision support system enables strawberry growers to easily access the information necessary for making decisions concerning fungicide applications. The benefits of such a tool is that growers will be able to apply fungicides only when conditions are favorable for disease development, thus reducing the number of applications and production costs without compromising disease control or yield.
1List of fungicides recommended for each disease based on results from our trials.