Introduction
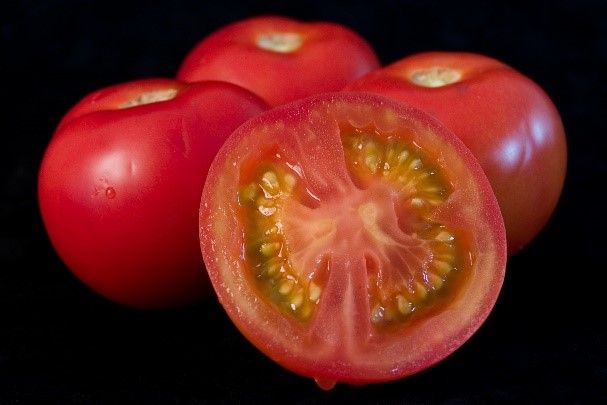
Florida accounts for 30% to 40% of all commercially produced fresh-market tomatoes in the United States. Before 2007, Florida ranked first in the production of fresh-market tomatoes. In recent years, its tomato acreage has been trending lower, and it has fallen slightly behind California in tomato production. In 2015, Florida produced 950 million pounds of tomatoes on 35,000 acres (USDA-NASS 2016). Florida produces field-grown tomatoes from October through June each year, with the greatest production in April and May and again in November to January. Almost every southern county in the state grows tomatoes.

Credit: USDA
The majority of fresh-market tomatoes in Florida are hand-harvested at the mature-green stage with specific criteria on size, color, and defects. The harvest crew needs to be trained and supervised so that immature, over-mature, defective, and decayed tomatoes are left in the field (Sargent et al. 2005). Harvesting tomatoes is labor-intensive and costly. Tomatoes are usually harvested two or three times, and sometimes four times, over the season depending on weather, market, and labor availability. The Florida Tomato Committee estimated that about 33,000 workers were needed to hand pick 31,500 acres of fruit in 2013 (Florida Tomato Growers Exchange 2017). Due to escalating labor costs, harvesting costs are also increasing (Greenhouse 2014). To examine hand-harvest efficiency and calculate harvesting costs, we conducted a harvest timing study at the end of 2015. This article presents the timing study and the results.
Harvesting Operation
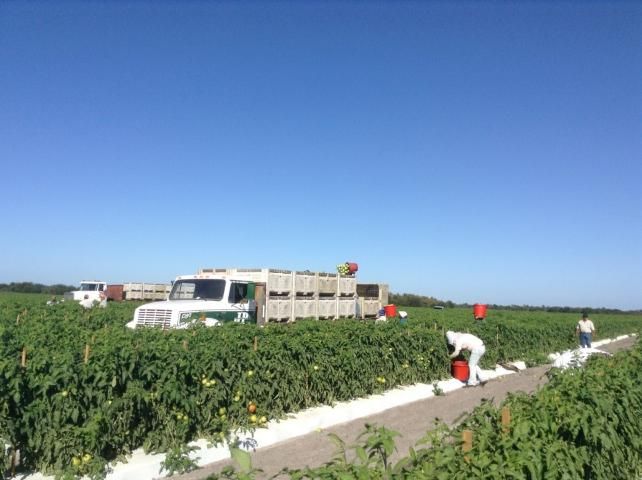
Tomato harvesting at a commercial farm is usually done by workers hired by the farm or through labor contractors. A harvest crew generally consists of 24 pickers and two dumpers. Each crew covers six rows on either side of the flatbed truck carrying full-size field bins on it. Each picker picks tomatoes on one side of the rows and places them into a plastic bucket that holds 30–35 pounds of tomatoes. After filling the bucket, pickers carry the filled bucket to the truck and pass it to the dumpers (Figure 1). The dumper then empties the fruit into the bin and gives one plastic coin to pickers for each filled bucket. Pickers take the coin and return to the picking place in the row to continue harvesting. The time to complete the picking cycle depends on the harvest speed, fruit density, and the distance of the row being picked to the truck. A flatbed truck can transport 22–24 filled bins, and each bin holds about 1,000 pounds of fruit. To minimize the walking distance of pickers, the truck is positioned in the field near the crew and moves along with the crew. Once the field trucks with the pallet bins have been filled, they are transported to the packinghouse.

Credit: USDA
Harvest Timing Study
The timing study was performed for harvesting winter-season conventional tomatoes in southwest Florida during December 2015. The tomato varieties were FL91 and HM1823. Tomatoes are usually planted on different dates, so the first harvest occurs at different times. We were able to observe and record times from the first to the fourth harvest of specific fields within that time frame. At each of the four harvests, pickers were identified along with the row distance from the truck, and the time was recorded for randomly chosen pickers to fill a bucket with tomatoes, walk to the truck to have the bucket dumped, and then return to the row. We timed 5–8 picking cycles for each randomly chosen picker and calculated the average for each task of the picking cycle. Table 1npresents a summary of the time averages for completing each task for male and female pickers, and Table 2 presents the average times for pickers by distance to the truck.
The results show that the time it takes to complete one picking cycle increases with the number of times the crop is picked. It took 74, 84, 122, and 140 seconds, respectively, for pickers to complete one picking cycle in the four harvests. Many tomatoes are available for harvest in the first picking, so the average was 49 seconds to fill one bucket. Tomatoes in the second picking are less dense, and it took 58 seconds to fill one bucket. In the last two seasonal harvests, tomatoes are usually smaller and fewer in number, so more time is needed to identify tomatoes meeting the harvest criteria. Therefore, the average time to fill one bucket increased to 97 seconds for the third harvest and 112 seconds for the fourth harvest. The combined time of delivering tomatoes and returning to the picking place was relatively stable for the first three harvests, about 25 seconds. The time in the fourth harvest increased to 28 seconds as tomato numbers decreased.
We observed that male pickers were quicker than female pickers in the first harvest, but the time difference narrowed down in the later harvests. Male pickers took 73, 82, 119, and 139 seconds, respectively to complete one picking cycle in the four harvests, while female pickers needed 78, 87, 133, and 142 seconds, respectively. However, given the smaller number of females in the sample, there were not enough observations to test for statistical differences after controlling for distance to the truck.
Pickers closer to the truck spent less time walking (Table 2). We divided the distance of the pickers to the truck into three categories: close, middle, and far. The first and second rows beside the truck were defined as close, the third and fourth rows were defined as middle, and the fifth and sixth rows were defined as far. Pickers in the far rows have to walk a longer distance to carry tomatoes to the truck. Non-filling times (the sum of walking to the truck and returning to the row) in the first harvest were 20, 23, and 30 seconds for pickers in the close, middle, and far rows, respectively. In the subsequent harvests, the time ranged from 22 to 36 seconds.
Harvest Cost
Pickers were paid a piece rate for each bucket they delivered to the truck. In the first and second harvests, the piece rate was set at 60 cents per bucket. During the first and second harvest, pickers averaged 30–33 buckets per hour, representing an average hourly earnings of about $18–$20 per hour. Highly skilled pickers average as many as 250–300 buckets in a typical 6-hour workday. In the third and fourth harvests, the piece rate increased to 75 cents per bucket because harvesting efficiency declined significantly due to the smaller number and size of tomatoes. Pickers averaged 17–20 buckets per hour during the third and fourth harvests. During all four harvests, dumpers in the crew were paid a daily rate of $100, while truck drivers were paid a daily rate of $120 per day.
For a standard working group with 24 pickers, two dumpers, and one driver, in a typical workday the average was 4,752; 4,320; 2,880; and 2,448 buckets in each of the four harvests, with a collective total wage of $3,071; $2,812; $2,380; and $2,056, respectively, calculated based on the corresponding piece rates for each harvest. As to be expected, not all harvested tomatoes meet grading standards for shipment. At the packinghouse, cull tomatoes are removed. Assuming a 30% cull rate and 1,500 boxes per acre (25 pounds per box) of marketable tomatoes at 700, 500, 200, and 100 boxes, respectively, from the four harvests, growers have to pay pickers a total of $539, $387, $197, and $100, respectively, based on corresponding piece rates. The total picking cost was $1,223 per acre. In fact, it costs employers more than this amount due to workers' waiting time counted as hours worked, which was not included in this study. In addition, the workers in this timing study were hired through labor contractors, which adds an additional payment on top of the wages paid to workers.
References
Florida Tomato Growers Exchange. 2017. Tomato 101 Fact Sheet. https://www.floridatomatoes.org/tomato-101/.
Greenhouse, S. 2014. "In Florida Tomato Fields, a Penny Buys Progress." New York Times, April 24. https://www.nytimes.com/2014/04/25/business/in-florida-tomato-fields-a-penny-buys-progress.html?_r=0.
Sargent, S., J. Brecht, and T. Olczyk. 2005. Handling Florida Vegetables Series: Round and Roma Tomato Types. SS-VEC-928. Gainesville, FL: University of Florida Institute of Food and Agricultural Sciences.
USDA-NASS. 2016. Quick Stats. Washington, DC: United States Department of Agriculture, National Agricultural Statistics Service.