Sampling the Evidence of Extension Program Impact
Evaluating cooperative Extension programs is a process which includes gathering evidence about program outcomes and impacts. One part of this process is the determination of how much data is necessary to show whether or not a program had the intended outcome. For example, if a program on the adoption of a new technology by farmers is being evaluated, should each and every farmer be asked if he or she adopted the technology or should a sample of farmers be asked the question?
A sample can provide an appropriate amount of evidence for an evaluation. A sample can also save the valuable time, money, and labor of Extension professionals. Time is saved because fewer people, farmers, 4-Hers, etc., must be interviewed or surveyed; thus the complete set of data can be collected quickly. Money and labor are saved because less data must be collected. In addition, errors from handling the data (e.g. entering data into a computer file) are likely to be reduced because there are fewer opportunities to make mistakes.
The purpose of this publication is to provide an overview of sampling procedures for obtaining data to evaluate Extension programs. Strategies for selecting a sample will be reviewed. A second publication, Determining Sample Size, PEOD-6, should also be consulted (https://edis.ifas.ufl.edu/pd006).
The Evaluation Purpose
The first step in determining the sampling procedures to be used in an evaluation is a clear statement of the research or evaluation question. Ask yourself, What do I want to know?
- Have the felt needs of residents who live in Manatee County been reduced?
- What practices did farmers in Columbia and Suwannee Counties adopt as a result of the Farming Systems Research and Extension programming?
- Has income among households with a new home-based business increased more than those without one?
The above questions suggest that the purpose of the evaluation can vary. The purpose may be as simple as documenting the change of indicator variables (that program activities are assumed to affect), or the purpose may include a more rigorous analysis that compares changes by program participants with changes by nonparticipants in order to estimate the impact that can be attributed to the program. This type of question has important implications for the sample selection process.
Defining the Population
A good problem statement is necessary to identify the population relevant to evaluating program impacts. The population is composed of the individuals or groups that are affected by the Extension program and thus are the focus of the evaluation. The residents of Manatee County or small farmers in Suwannee and Columbia counties are examples of populations for the evaluation questions stated above. The individual residents or farmers in these examples are called sampling units or elements.
The population can be defined by geographical, demographic, economic, and social characteristics, as well as by the content of the survey (Ilvento et al., 1986). These characteristics include county of residence, age, sex, race, marital status, income, household size, farm size, and so on. A time frame can also be used to specify the population. For example, a population may include only people who have participated in a program during the last six months.
Defining a population too narrowly can make it difficult, if not impossible, to obtain a list of the individual elements (Sudman, 1976). For example, a list of peanut farmers who are 18 to 45 years old and work off-farm jobs is unlikely to exist.
Sometimes the source of the data is not the same as the sampling unit or element (Sudman, 1976). In the third example of an evaluation question shown earlier, the sampling element is the household but the data is obtained from individuals, e.g., the head of household. Similarly, evaluations of programs involving youth often sample adults, such as parents or teachers, to report their observations about what youth learn or do.
To Sample or Not to Sample
With the purpose of the evaluation stated and the population defined, the decision of whether to use a sample or a complete census (in which everyone in the population is included) can be made. There are several considerations to take into account. First, is collecting data on all the elements in the population feasible? If the cost and time requirements are prohibitive, a sample may be the only alternative. This is likely the case for a mass media evaluation survey in counties with large populations, e.g., Miami-Dade County, Florida, which has over 2 million residents. Collecting data on a large number of individuals can also increase errors from data handling because the large volume creates more opportunities for error. On the other hand, if an evaluator wants to survey the 150 farmers in a records-keeping program, the advantages of sampling are less clear. A complete census of the 150 farmers may be the better alternative because error due to sampling is eliminated. A census also has the advantage of providing information on each and every individual in the population of the program.
The choice between a census and a sample also depends on the scope of the evaluation. A census can be a quick and efficient method if an agent or specialist wants to determine the extent of learning or practice change among the 150 farmers in the records-keeping program. For a more rigorous impact study, a sample of all the farmers in the county or area and not just those in the program is more appropriate. A sample of the wider population allows the comparison of adoption rates between farmers who are involved in Extension programs and those who are not. This idea applies to Extension programs in other areas as well.
Nonprobability and Probability Samples
Suppose you have decided to use a sample rather than a census. Should you use a nonprobability or a probability sample? Nonprobability samples use procedures for selection that are not based on chance. With this type of sample, there is no way to accurately estimate the chance of any element being selected. The quality of a nonprobability sample depends on the knowledge, judgment, and expertise of the researcher. At the same time, nonprobability samples can be quite convenient and economical.
Nonprobability samples include haphazard, convenience, quota, and purposive samples. Haphazard samples are those in which no conscious planning or consistent procedures are employed to select sample units (Cochran, 1963).
Convenience samples are those in which a unit is self-selected (e.g., volunteers) or easily accessible. Reaction surveys at the end of an Extension program, in which the respondents self-select to participate, are an example of a convenience sample. Although this type of sample can yield useful information, these samples must be used with caution in inferring impacts of a program.
Quota samples are those in which a predetermined number of units with certain characteristics are selected. A sample of 50 men and 50 women to be interviewed on a busy street is an example of this type. The quality of the sample depends on the evaluator's ability to determine the relevant characteristics, the size of the quotas, and whether quotas can be specified for characteristics relevant to the evaluation topic.
Researchers select units (e.g., individuals) for a purposive sample on the basis of characteristics or attributes that are important to the evaluation (Smith, 1983). The units used in a purposive sample are sometimes extreme or critical units. Suppose we are evaluating the adoption rates of a technology by farmers and we want to know if large farmers differ from small farmers. A sample of extreme units, e.g., farms of 1,000 or more acres and farms of 100 or less acres, would provide information to make this comparison. Similarly, if we want to evaluate why people adopt water conservation practices, households who have decreased their water consumption by 25% could be considered critical units for a sample. A small purposive sample can also be used to pretest the survey instrument of a larger sample (Sudman, 1976). Similarly, a pretest using a sample of critical units (e.g., experts or targeted clients) can identify problem questions, and these can be corrected before the larger survey is implemented.
A probability sample is one in which every element in the population has a known, nonzero probability of selection (Sudman, 1976, p. 49). Because the probability is known, the sample's statistics can be generalized to the population at large (at least within a given level of precision). These statistics include means, proportions, and regression parameters. There are several types of probability samples, e.g., simple random samples and stratified samples. The procedures to select the sample are described below. Probability samples generally are preferred over nonprobability samples because the risk of incorrectly generalizing to the population is known.
The Sampling Frame
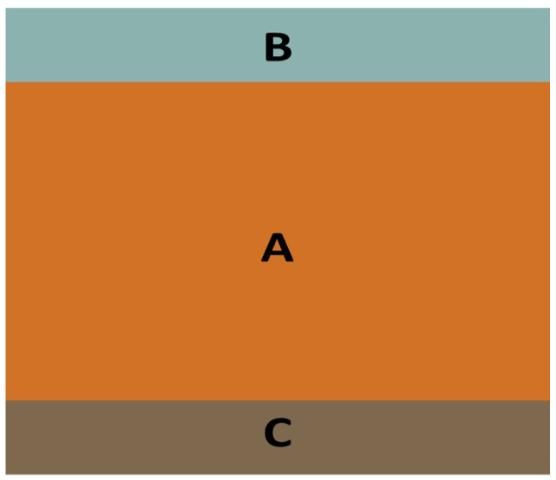
The sampling frame is a list of units or elements from which the sample is selected. The ideal frame lists every element separately, once and only once, and nothing else appears on the list (Kish, 1965). In many cases, the list does not contain exactly the same elements as the population from which information is desired. In addition, older lists are likely to be less accurate than more recently compiled lists. The rectangle (areas A and B) in Figure 1, represents the population of interest (e.g., households, citrus growers, 4-H groups, etc.). The areas A and C represent the sampling frame or list. As shown in the figure, some elements of the population are missing from the list (area B), while there are elements contained on the list which are not a part of the population (area C). The latter are "foreign" elements, such as livestock farmers listed along with citrus growers, or duplicate listings.
Each list that is used as the sampling frame should be screened for duplicates and, when possible, foreign elements1. In addition, some estimate of the number of elements that are missing from the list should be made (this is called coverage error; see Dillman et al., 2014).
If too many elements are missing, the sample will not be representative of the population in which we are interested. One alternative is to look for another list to use as the sampling frame.
Leslie Kish (1965) identified four common problems of sampling frames or lists:
- missing elements, noncoverage, or an incomplete frame
- blanks or foreign elements
- duplicate listings
- clusters of elements combined into one listing
The first three were discussed above. The fourth, clusters of elements, refers to situations where individuals are not listed separately, e.g., members of a household. This is only a problem if we are interested in the responses of each of the individuals rather than the household as a whole.
According to Kish (1965), there are three responses to these problems. First, the problem can be ignored or disregarded. This response may be appropriate if the problem is relatively minor in comparison to other sources of error (such as inaccurate data from poorly worded questions) and correcting the list is costly and time-consuming. Second, the population can be redefined to fit the sampling frame. Let's assume that we are studying citrus growers in Lake County and the list of growers from the county office is incomplete. In this case, the study population would be redefined as citrus growers known to Extension in Lake County. We can use that list if the research is not seriously deflected from its purpose. Third, we can spend the time and effort to correct the list.
If one of the three responses are not feasible, one of the following remedies for the four types of frame problems can be applied (see Kish, 1965):
- Missing elements. To identify or survey elements missing from the list, a supplement in a separate stratum (sample grouping) can be employed. The Bureau of the Census uses fieldworkers to count the homeless in addition to sending surveys to every household in the country. Similarly, a survey of citrus growers from the Extension list might be supplemented by fieldwork. This would include driving across the county and stopping at farms not on the citrus list.
- Foreign elements. Omit foreign elements from the sample if they can be identified. If a probability sample is to be used, do not replace the element with the next one on the list because this changes the probability of selecting each individual element.
- Duplicate listings. This problem can be addressed by selecting only the first, last, oldest, or newest listing. Any unique feature can be used to select one of the listings. If two or more lists are used, remove all the names from the second list that appear on the first. Whatever criterion is selected, it should be applied in a consistent manner for all duplicates.
- Clusters of elements. One way to address the problem of clustering is to include all the elements within each selected listing, e.g., all the people living at the same address. A second method is to select one element at random from those in the selected listing and weight it by the number of elements in the listing.
These remedies are basic common sense techniques. The key idea here is to apply a consistent, explicit rationale for including and excluding elements on the list from which the sample is drawn.
There are a number of lists that can be used to draw samples. The usefulness of these varies with the purpose of the study and the type of sample. Some types of lists include:
- lists of driver's licenses
- lists of utility company users (telephone, electric, water, and sewage)
- organizational directories or membership lists
- lists from the tax collector or assessor (property owners)
- lists of Extension clients/program attendees, community or organizational directories
- address-based samples using the US Postal Service's Delivery Sequence File
In recent years, address-based samples have become popular for general population surveys at the state and national levels (Dillman et al., 2014). These lists are useful for needs assessment and surveys that assess exposure to mass media Extension programs. Lists of Extension clients or organizational directories can be used to assess program impact for specific groups, e.g., citrus growers, Master Gardeners, or 4-H leaders.
There are occasions when a list is unavailable or insufficient for the study's purpose. One method to overcome this deficiency is to specify a procedure based on location or some other known characteristic. If a probability sample is desired, then the procedures must allow the elements to have a known chance of selection. Cluster or area sampling is one procedure that does this. For example, if a sample of children ages 8 to 18 is desired, but no list is available, schools with children of those ages can be identified and randomly selected. Within each school that is selected, all the children 8 to 18 can then be surveyed (or a list of the children can be sampled).
Selecting a Probability Sample
After the sampling frame or list has been obtained and any corrections made, the procedures for selecting the sample from the population must be determined. If a probability sample is planned, there are several methods for selecting a sample.
Simple Random Sample
A simple random sample is one of the easiest and least complex samples to select. With this method, each element on the list has an equal probability of selection. Typically, each element on the list, e.g. the name of a farmer, is assigned a number. Then, those numbers selected from a table of random numbers or randomly generated by a computer program are included in the sample. A table of random numbers is easy to use for small samples but becomes cumbersome for large samples.
To use a table of random numbers, use the following procedures (cf. Sudman, 1976):
- Assign a number to each name on the list. Each sampling element (person, household, farm, etc.) must be uniquely identified.
- Select a starting point. You can begin anywhere in the table and move in any direction (see Table 1).
- Determine the number of columns to read. If there are 10,000 elements in the population, you must use five columns of digits; if there are 300 elements in the population, then only three columns are needed.
- Select numbers from the table. Suppose you are studying a population of 196 ping pong balls. You would then select any three digit number from 001 to 196. Any number over 196 is discarded because these numbers do not correspond to any element in the population. Now suppose you select 149. The ping pong ball which is numbered 149 on the list is selected for the sample.
- Discard any duplicate numbers that you select. This means that you are sampling with replacement.
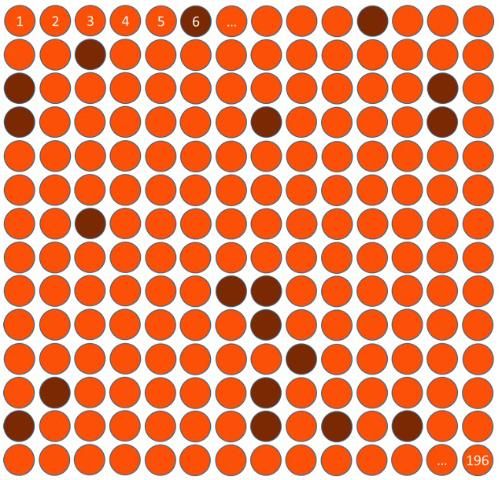
- Select numbers until you obtain the desired sample size. Suppose we want a sample of 20 ping pong balls from our population of 196. We would continue drawing nineteen more numbers (in addition to 149) between 1 and 196 from the table of random numbers. One such sample included the following elements: 50, 6, 149, 178, 176, 55, 41, 94, 87, 29, 162, 11, 43, 120, 156, 119, 17, 180, 134, 169. Figure 2 illustrates this simple random sample of 20 (Note: The ping pong balls are numbered from the upper left corner [1] to the bottom right corner [196]).
Spreadsheet programs are a quick and easy alternative for selecting a simple random sample. Using the ping pong ball example, the RANDBETWEEN formula can be used in Excel to generate a random number between 1 and 196 for each element in the population (e.g., ping pong ball). After each ping pong ball is assigned a random number, then the numbers are sorted and the 20 smallest (or largest) random numbers are selected for the sample.
Although simple random samples are easy to select, they have one undesirable quality. On rare occasions, you can select a sample that is far off from the true population mean (Slonim, 1957). To illustrate, suppose that we select a sample of 20 from a population of 196 ping pong balls. There are thousands2 of possible samples of 20 from this population. If the sample we select happens to have the 20 ping pong balls with the smallest or largest level of what we are measuring, then the mean of the sample is likely to be quite different from the population mean.
One way to avoid getting an "extreme" sample is to use additional information about the population to create a stratified sample. This method is explained next.
Stratified Random Sample
To improve estimates of means or proportions obtained from a simple random sample, the population can be arranged into strata or groups. Age, sex, and race are some demographic characteristics that are commonly employed to stratify samples. Stratified random samples require you to obtain information about the population prior to the sampling process. The sampling frame, which lists the population, as well as this auxiliary data, previous samples, and research papers, are some of the sources of information that can be used to stratify samples (Ilvento et al., 1986). Stratified samples are usually more accurate than random samples because each group or strata is well-represented in the sample. Within each stratum, a separate sample is randomly selected.
Three types of stratified samples are commonly employed in surveys: proportionate, disproportionate or optimal allocation, and equal size samples. In proportionate stratified samples, the sample size in each strata is made proportionate to the population size of the stratum (Kish, 1965). For example, if 16% of the population in a program is 65 years of age or older, then 16% of the sample should contain people in that age group.
Optimal allocation employs formulas to determine the sample size of each strata or group that will maximize the precision of the statistics for a particular total sample size (Slonim, 1957). The basic idea behind optimal allocation is that larger samples are required for strata with a high degree of variability than for those with less variability in order to yield the same level of precision on the variable of interest. Optimal allocation can also be used to minimize the cost of data collection when the cost varies from stratum to stratum. For a given budget and level of accuracy, the sample size of each stratum is determined on the basis of the cost of collecting the data for the desired level of precision.
Equal size samples are stratified samples in which the sample size of each strata or group is the same. For example, if we sample 300 men and women from a population, we would select 150 men and 150 women. This type of sample is preferred when two or more groups are to be compared in the evaluation.
The size of stratified samples is governed by one additional consideration. If subgroups or strata are designated as domains of study, as well as the total sample, the sample proportion or size may have to be adjusted to yield a desired level of accuracy (Kish, 1965). For example, suppose we have a sample of 300 farmers and only 6% (18) are 65 years of age or older. If we wish to make any conclusions about the subgroup of farmers who are 65 or older, we would need a larger number of older farmers (the determination of sample size is discussed in PEOD6, Determining Sample Size, https://edis.ifas.ufl.edu/pd006). One way to do this is to sample 300 farmers but with 100 of those being 65 years of age or older. Oversampling of older farmers allows conclusions to be made for both the total sample and the subgroups.
The use of stratified random samples requires additional procedures for calculating sample statistics such as means and variances. According to Kish (1965, p.75), a separate stratum mean (or other statistic) is calculated and these are weighted to form a combined estimate for the entire population. In the above example of farmers, the mean of the 100 farmers who are 65 or older is multiplied by .06 (the proportion of this group in the population) and the mean of the remaining 200 farmers in the sample is multiplied by .94. These are added to obtain the mean for farmers of all ages. Note that weighting the mean is not required for proportionate samples. The variances are also computed separately and then weighted in forming the combined estimate for the population (this also is necessary for proportionate samples).
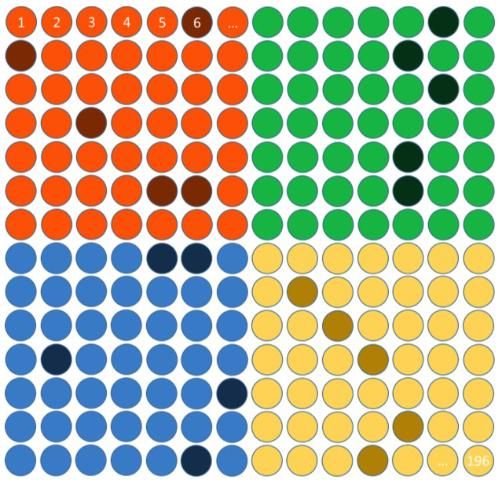
To illustrate the process of selecting a stratified random sample, refer to Figure 3. Suppose we have 49 each of orange, blue, yellow, and green ping pong balls (a total of 196) as represented by the four sections. A proportionate or equal size stratified sample would produce statistics with the same precision for each group (assuming equal variances), and for the total population. Thus, 5 ping pong balls are randomly selected for each color, as shown in Figure 3. If we selected the simple random sample shown in Figure 2, we would have selected 5 orange balls, 5 green balls, 3 blue balls and 7 yellow ping pong balls. The estimate of size or weight of yellow ping pong balls would be more precise than that for blue balls in the simple random sample because of the "extra" data on yellow balls.
Systematic Sample
Systematic samples are widely used and easy to implement.
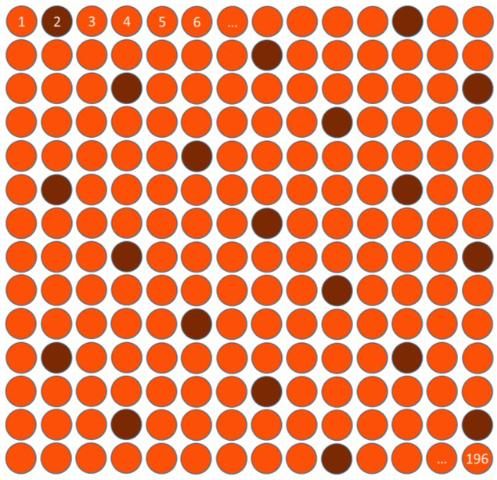
A systematic sample selects the first element randomly and then every ith element on the list afterwards. Suppose a sample of 20 ping pong balls is selected from a population of 196. The interval between selected elements from the list would be 20/196 or 10 (always round down to the nearest whole number to ensure enough elements are selected). The starting point would be a number between 1 and 10 that is selected from a table of random numbers. If 2 were chosen, the sample would include the 2nd, 12th, 22nd,... through the 192nd ping pong balls on the sampling list, as shown in Figure 4.
Systematic samples, like simple random samples, give each element an equal (but not independent) chance of being selected. This procedure can also be used if you do not have a list when the elements are arranged in space (such as houses along a road). However, if the arrangement of the population on the list (or road) has some pattern or periodicity, then the sample may become biased. For example, if a directory of couples always listed the man first, an interval that caused an odd number to always be selected would include only men in the sample. Because of the danger of bias, random numbers selected from a table of random numbers or those generated by computer (for larger samples) are to be preferred when a list is available.
Cluster or Area Samples
When a list of the entire population is nonexistent, hard to obtain, or the cost of surveying dispersed individuals is prohibitive, cluster sampling can facilitate the data collection process. Cluster sampling is a method of selecting sampling units in which the unit contains a cluster of elements (Kish, 1965, p.148). Some types of clusters include employees of business firms, children in schools, dwellings in city blocks, and residents in counties or states. The last two are geographical clusters or areas.
To illustrate, suppose we wish to evaluate a statewide program in energy conservation with a face-to-face survey of 1,000 households. Although a sample could be drawn from the addresses in the Delivery Sequence File, the cost of surveying individuals who are dispersed throughout the state would be high. A cluster sample can reduce the survey cost and capture respondents in groups that are likely to be under-represented. A cluster sample for this case could begin by randomly selecting a sample of counties in the state, then randomly selecting county subdivisions and neighborhoods, and finally randomly selecting street segments. Each household on a selected street segment would be interviewed. Note that the cluster sample in this example is composed of several stages. In addition, the probability of selecting a particular household is the product of the probability of selecting its street segment, neighborhood, town, and county (Kish, 1965).
Using the ping pong ball example, suppose we find that ping pong balls are sold in packages containing 4 balls. Thus, the population of 196 balls is distributed among 49 packages. To obtain the desired sample size of 20 balls, we first calculate the proportion of the population that the sample comprises (20/196 is about 10 percent). Next we multiply the number of packages (clusters) of ping pong balls by that proportion to determine the number of packages to be selected. This is 49 x .1, or 5 packages (here we round up to get the desired sample size). Finally, the 2nd, 13th, 19th, 26th and 39th packages of ping pong balls were randomly selected (see Figure 5). The probability of selecting any single ball is the same as that for selecting its package, i.e., 1 in 10.
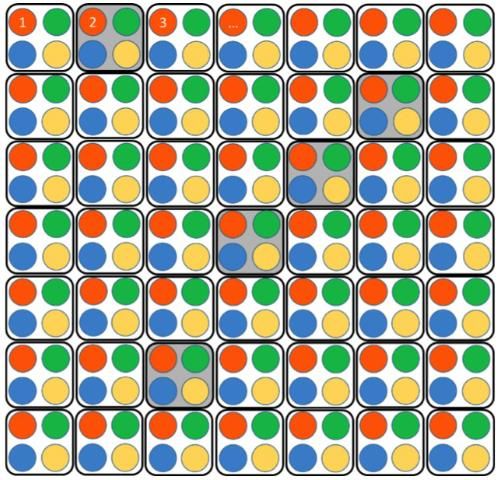
Ideally, individual clusters in cluster samples should be as heterogeneous as possible. For example, each package should contain an orange, blue, green, and yellow ping pong ball. This is the reverse from stratified samples, where each strata is homogeneous. Recall that the five ping pong balls in each group of the stratified group random sample were the same color. In practice, clusters are often somewhat homogeneous, such as households located on the same street. Consequently, the sample results tend to be less precise than other techniques for the same size sample but more cost efficient (Slonim, 1957).
Selecting a Sample Design
The choice of a sample design will be largely determined by the amount of information that is available for the population. If characteristics of the population are known, then a stratified sample can be used to obtain more precise data. If little is known about the population, then a less complex design, such as simple random or systematic samples, can be used. When a list is unavailable or incomplete, a cluster sample may be the best choice. For large national or state-wide surveys, these methods can also be combined, such as a stratified multi-stage cluster sample, to provide useful and cost-effective samples.
Concluding Comments
The sampling process is multifaceted. A well-designed sample can provide representative data which is useful for evaluating Extension programs. Such a sample begins with a consideration of the purpose of the evaluation, the characteristics and size of the population, the availability of an accurate and up-to-date sampling frame, and the procedures for selecting who will be in the sample. Addressing these issues, along with determining the size of the sample, will contribute to a credible and rigorous evaluation.
Endnotes
- Another way to identify foreign elements is through the use of screening questions on the survey instrument. This is especially useful in telephone surveys, where the interviewer can abbreviate the interview if the respondent does not meet the selection criteria and save valuable time and money.
- The actual number of possible samples is 196! / 20! 176!. What this equals is too large to compute on my smartphone.
References
Cochran, W. G. (1963). Sampling Techniques, 2nd Ed., New York: John Wiley and Sons, Inc.
Dillman, D. A., J. D. Smyth, & L. M. Christian. (2014). Internet, phone, mail, and mixed-mode surveys: The tailored design method. (4th ed.). Hoboken, NJ: John Wiley and Sons.
Ilvento, Thomas W., Paul D. Warner & Richard C. Maurer. (1986). Sampling Issues for Evaluations in the Cooperative Extension Service. Kentucky Cooperative Extension Service. University of Kentucky.
Kish, Leslie. (1965). Survey Sampling. New York: John Wiley and Sons, Inc.
Slonim, M. J. (1957). "Sampling in a Nutshell," American Statistical Association Journal. 52:278, 143-161, DOI: 10.1080/01621459.1957.10501375
Smith, M. F. (1983). Sampling Considerations In Evaluating Cooperative Extension Programs. Gainesville, FL: University of Florida Institute of Food and Agricultural Sciences. https://original-ufdc.uflib.ufl.edu/IR00011319/00001
Sudman, Seymour. (1976). Applied Sampling. New York: Academic Press.


