Assessment is used to evaluate the strengths and needs of learners, guide instruction, and measure progress and achievement. Developing an appropriate assessment can appear challenging when using laboratory activities in Extension programming or in formal courses. Laboratory settings are any location where the learner is able to interact with materials and/or models to better observe and understand the topic at hand (Myers, 2005). These settings may be gardens, ranches, or any other setting where learning is "hands-on." Using traditional forms of assessment such as quizzes and tests can make it much easier to quantify learner performance, but these approaches often do not adequately assess actual learner achievement. As Donaldson and Odom (2001) stated, "traditional lab assessments indicate students' ability to follow lab instructions rather than showing that they have the thought processes that are necessary for them to question, design, conduct, and analyze an experiment" (p. 29). Concept maps, Vee maps, and portfolios are alternate forms of assessment that can replace traditional quizzes and tests and can be used to more effectively assess student learning in a lab setting.
Concept Maps
Concept maps are organizing tools for identifying relationships among multiple concepts (Llewellyn, 2005). These can be used at the end of instruction (summative assessment) or to show the progress of learning throughout a unit (formative assessment) (Edmondson, 2000). For example, prior to instruction on a topic, participants may construct a concept map based on their initial knowledge of that area. New knowledge can be added to their original concept map throughout the investigation or workshop. Items in the original concept map that are found to lack support can be deleted. The use of different colors can help individuals monitor their progress by differentiating between prior knowledge and acquired knowledge (Llewellyn, 2005). This is an effective way for instructors to assess their participants' level of understanding so instruction can be better tailored to meet their needs.
Concept maps can be designed using a variety of formats and for varying purposes. They can be created to define or describe concepts, classify objects, or map the cause and effect of an event (Hyerle, 1995). The most common organizational structure is a web-like or hierarchical orientation with the main idea either in the center or at the top of the map. Words, arrows, or phrases help identify the relationship between the central concept and subconcepts (Llewellyn, 2005).
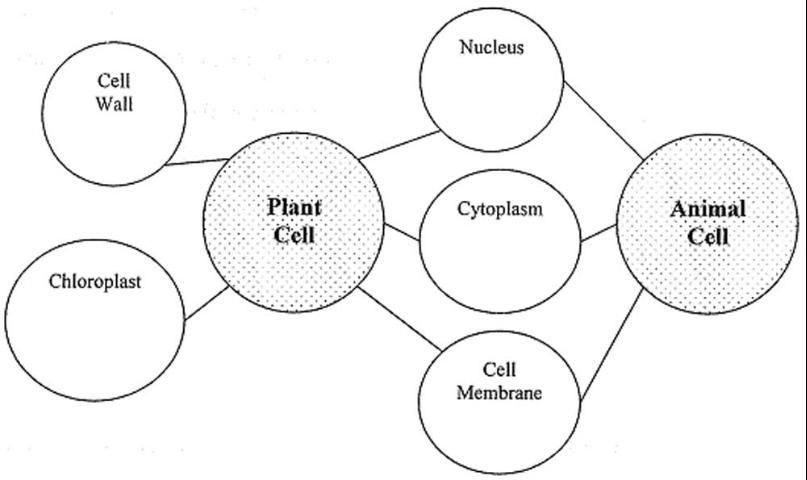
A compare/contrast map (Figure 1) can be used to identify the similarities and differences between two concepts (Hyerle, 1995). The primary concepts are placed in the two large circles when using this kind of map. The commonalities are placed in the circles between the two concepts, and the differences are placed in the outside circles.

Credit: UF/IFAS
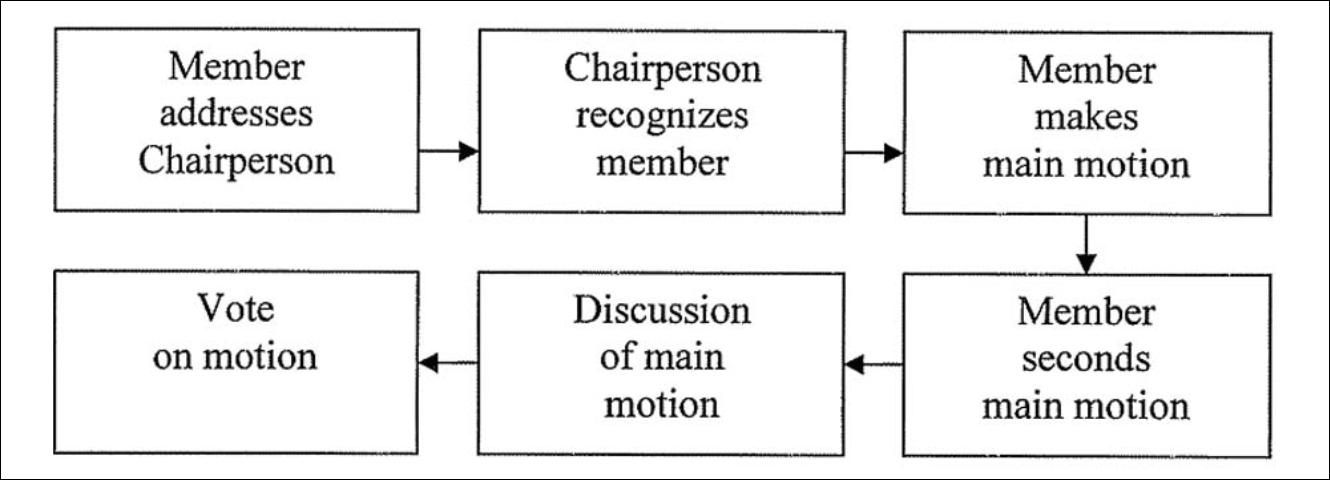
A flow map (Figure 2) can be used to detail a sequence of events (Hyerle, 1995). This type of concept map is best used when events or ideas occur in a specific order. Having participants complete this type of concept map is an excellent way to assess their knowledge and understanding of a technique or event.

Credit: UF/IFAS
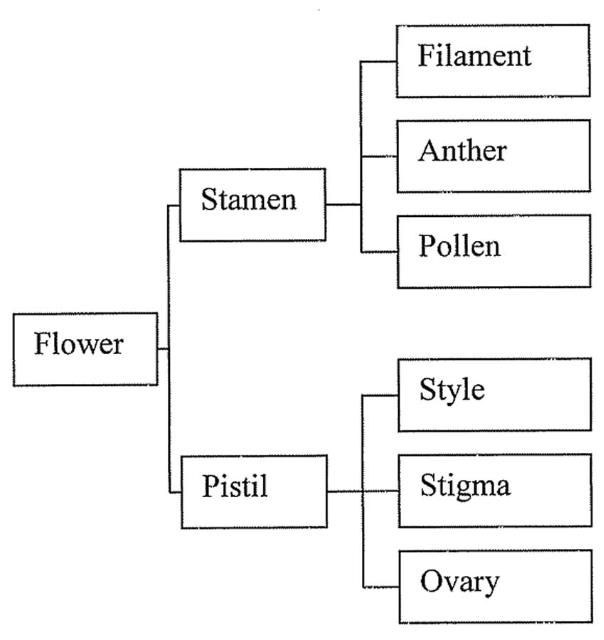
A brace map (Figure 3) can help identify the parts and subparts of an object (Hyerle, 1995). Participants begin with a major topic or idea. They then can work to identify each subpart and how it relates to the main idea. This type of graphic organizer is an excellent way to assist individuals in understanding how various items are related and how different subparts interact to form the larger concept.

Credit: UF/IFAS
Vee Map
At the conclusion of a laboratory activity, participants are often responsible for completing a laboratory report that details the use of the scientific method. A Vee map (Figure 4) is a quick and easy way for educators to evaluate the learning of their participants in this situation. Roehrig, Luft, and Edwards (2001) described the six components of a Vee map: focus question, word list, concept map, events, data and analysis, and conclusions. The Vee map provides a simple one-page report that is less time-consuming for individuals to create and presenters to evaluate. Yet, Vee maps contain all the important information, assist learners in developing key science process skills, and provide another tool for the instructor to use in assessing laboratory instruction.

Credit: UF/IFAS
When using Vee maps, the laboratory activity is designed around a focus question (see Figure 4). The participants then create a word list that includes vocabulary relevant to the question under investigation. The concept map encourages learners to begin to make connections and understand relationships between the terms and the focus question. The inclusion of the word list and concept map can help the participants gain a better understanding of the important terms and ideas. This is also an important reading comprehension strategy and assists individuals in developing key reading skills and science process skills.
Participants design a procedure to examine the focus question in the events section. After conducting the procedure, they record their data and include appropriate charts, graphs, and tables. The final step in completing the Vee map is reporting conclusions and suggesting additional areas for further research. These portions of the report address the important science process skills of reporting and interpretation that are vital to a person's understanding of scientific principles.
Portfolios
Portfolios allow individuals to demonstrate their learning through a collection of their work. The following framework (Vitale & Romance, 2000) can be used to establish the criteria for the portfolio:
- Use a concept map to acquaint learners with the content that will be assessed.
- Determine the setting (e.g., workshop, in the field, at an individual's home, etc.) where the content will be applied.
- Referring to the concept map, identify the specific concept or sub-concepts that will be assessed.
- Clarify the work samples that should be included in the portfolio. These samples may include, but are not limited to the following:
- Literature review of the concept being examined.
- Documentation of the laboratory investigation (full reports and/or Vee maps).
- Journals detailing the thoughts and observations of the student related to the laboratory investigation.
- Visual representations of the laboratory processes and results.
5. Develop and disseminate the criteria used to evaluate portfolios.
Summary
Many of the concepts included in Extension programming and formal agricultural and life sciences courses can be taught using a laboratory investigation approach. Yet, in this age of accountability, educators are faced with the daunting task of developing appropriate methods of assessment that may not include the traditional paper and pencil approach. Using concept maps, Vee maps, and portfolios can assist Extension educators and other teachers in developing more suitable and meaningful forms of assessment of student learning.
A relevant concern is the amount of time required to utilize these assessment techniques. It may take additional time to develop and initially implement alternate methods of assessment. However, educators may find it easier to evaluate the more visual or oral products prepared by learners. As educators move beyond using tests and quizzes, these assessment measures can promote and measure student learning.
References
Donaldson, N.L., & Odom, A.L. (2001). What makes swing time? A directed inquiry-based lab assessment. Science Activities, 38(2), 29–33.
Edmondson, K.M. (2000). Assessing science understanding through concept maps. In J.J. Mintzes, J.H. Wandersee & J.D. Novak (Eds.), Assessing science understanding: A human constructivist view (pp. 15–40). San Diego: Academic Press.
Hyerle, D. (1995). Thinking maps: Tools for learning. Raleigh, NC: Innovative Sciences.
Llewellyn, D. (2005). Teaching high school science through inquiry: A case study approach. Thousand Oaks, CA: Corwin Press.
Myers, B.E. (2005). Incorporating science, math, and reading into the agriculture classroom: The role of the laboratory. The Agricultural Education Magazine, 77(5), 14–16.
Roehrig, G., Luft, J.A., & Edwards, M. (2001). Versatile Vee maps. The Science Teacher, 28–31.
Vitale, M.R., & Romance, N.R. (2000). Portfolios in science assessment: A knowledge-based model for classroom practice. In J.J. Mintzes, J.H. Wandersee, & J.D. Novak (Eds.), Assessing science understanding: A human constructivist view (pp. 167–196). San Diego: Academic Press.