Onsite Sewage Treatment and Disposal Systems: Phosphorus
This publication is part of a series titled Onsite Sewage Treatment and Disposal Systems, commonly referred to as septic systems. This series is intended to give state and local government officials, soil scientists, consulting engineers, Extension agents, and citizens a basic understanding of onsite wastewater treatment and the behavior of different wastewater-borne contaminants coming from septic systems.
Introduction and Purpose
Phosphorus (P) in onsite sewage treatment and disposal systems (hereafter referred to as septic systems) is a concern because P can impair water quality at much lower concentrations compared with nitrogen. Mueller and Helsel (1996) assert that P-limited surface waters can become eutrophic (nutrient-rich) when the P concentration in water exceeds just 0.02 mg/L. Efroymson et al. (2007) indicate that P controls production of nuisance algae in most North American freshwater lakes. The excess of algae can impair the water and restrict its use for drinking and recreational purposes (Schindler 1977; Sharpley et al. 1994; Sharpley et al. 2003).
Various researchers have linked P contamination of surface waters to wastes derived from septic systems (Bowes et al. 2010; Edwards and Withers 2008; Corbett et al. 2002). The purpose of this publication is to describe the behavior of P in septic systems. This publication summarizes (1) the sources of P in septic tank effluent and (2) the forms, concentrations, and behavior of P in the septic tank effluent and the drain field (also called a leach field or soil treatment unit). For an overview of septic systems, consult "Onsite Sewage Treatment and Disposal Systems: An Overview" by Toor et al. (2011) available at https://edis.ifas.ufl.edu/publication/SS549.
Sources of Phosphorus in Wastewater
Phosphorus in the wastewater comes from toilet wastes as well as bath, laundry, and kitchen wastewater. Toilet wastes contribute 30%–70% of P in the form of nucleic acids and adenosine tri-phosphate excreted in feces. Detergents (laundry) and dish soaps (kitchen and sinks) used in the household contribute another 30%–70% of P (Wilhelm et al. 1994). Tjandraatmadja et al. (2010) studied household products (e.g., soaps, cleaners, and personal care products) and found that P was detectable in 97% of 156 products—and that much of this P can make its way into household wastewater. The U.S. EPA (2002) estimates that each person in the United States contributes 2.7 grams of total P to wastewater each day (Table 1). Of this total P, toilet wastewater contributes the highest amount (59%), followed by baths, sinks, and appliances (37%), and garbage disposals (4%).
Phosphorus in wastewater has declined significantly since the 1970s because P has been reduced or eliminated in detergents. Most laundry detergents in the United States now contain low or no P. In 2010, P was further reduced in most dishwasher detergents after 16 states instituted bans on the sale of dishwasher detergents containing more than 0.5% P—down from 8.7% previously (Table 2). Therefore, wastewater P concentration has continued to decline since the Clean Water Act passed in 1972. Total P concentration in wastewater is now typically less than 10 mg/L, and many wastewaters often have less than 5 mg/L.
Forms of Phosphorus in Wastewater
Phosphorus does not exist in elemental form in the natural environment because elemental P is extremely reactive and readily combines with oxygen (O) to form phosphate (PO4). In wastewater, P exists as one of several possible phosphate compounds including orthophosphate, polyphosphates, and organic phosphate (Crites and Tchobanoglous 1998). Phosphorus forms in septic tank effluent are broadly divided into the following two categories:
-
Inorganic Phosphate is contributed by detergents and household cleaning products such as soaps. These are present as the following:
-
Orthophosphate is also referred to as "available or reactive P" and may be present in several dissolved forms. These include H3PO4, H2PO4-, HPO42-, and PO43-.
-
Polyphosphate is orthophosphate molecules linked together in "chains" and is derived from detergents and other cleaners; they are also known as condensed phosphates. These include pyrophosphate (P2O74-) and triphosphate (P3O105-). Polyphosphates in water are unstable and eventually convert to orthophosphate.
2. Organic Phosphate is contributed by human excreta (feces) and food residues. Organic phosphates are present in sugars, phospholipids, and nucleotides.
Gold and Sims (2001) reported that 85% of the P in septic tank effluent (i.e., wastewater that has passed through the septic tank but has not entered the drain field) is in the form of orthophosphate. The remaining 15% exists in organic or inorganic forms in suspended solids. Most of the inorganic P in septic tanks originates from detergents and soaps. In addition, a small amount of inorganic P is released when organic material is decomposed by microbes.
Phosphorus Concentrations in Septic Tank Effluent
Some removal of P from the raw wastewater is expected as solids accumulate at the bottom of the septic tank. Any differences in total P concentrations between raw wastewater (i.e., wastewater that has not yet entered a septic tank) and septic tank effluent (i.e., wastewater that has passed through the septic tank but has not entered the drain field) are usually attributed to the accumulation of P in the residual sludge that settles at the bottom of a septic tank (U.S. EPA 2002). Approximately 20%–30% removal of P in the septic tank is expected as solids settle at the bottom. As a result, septic tank effluent almost always contains total P concentrations at 80%–100% of that found in the raw wastewater (Lowe et al. 2007, 2009; McCray et al. 2005; Crites and Tchobanoglous 1998). Otherwise, there are no appreciable means of P removal from septic tanks. According to a comprehensive literature review by Lowe et al. (2007), the median concentration of total P is 19 mg/L in raw wastewater and 10 mg/L in septic tank effluent (Table 3). Comparing these values suggests a P removal rate of close to 50% in the septic tank. However, Lowe et al. (2007) point out that the data for raw wastewater was taken from only 8 studies compared with 49 studies for septic tank effluent, so actual P removal rates in the septic tank may be smaller. The next opportunity for P removal is when septic tank effluent passes through the drain field, where P can undergo various reactions with soil components. The fate of P in the soil environment is discussed in the next section.
Behavior of Phosphorus in the Drain Field
Possible transformations of P in the drain field include the following:
Organic P. Part of the organic P fraction is converted to inorganic P (orthophosphate) through the process of mineralization, which is carried out by soil microbes. This process is most rapid when soils are warm and moist but well drained (Stewart and Tiessen 1987). Organic P may also adsorb directly onto soil surfaces.
Inorganic P. Because polyphosphate is broken down to orthophosphate in water, the inorganic P that enters the soil treatment unit exists primarily as orthophosphate, which is called available P because it can be taken up by plants. This inorganic P may also be fixed (adsorbed) by soil components such as organic matter, calcium, iron, and aluminum. The binding of P to the soil surface reduces the amount of P leaching from the drain field. Additionally, P is precipitated as iron, aluminum, and manganese compounds in acidic soils and as calcium and magnesium compounds in alkaline soils.
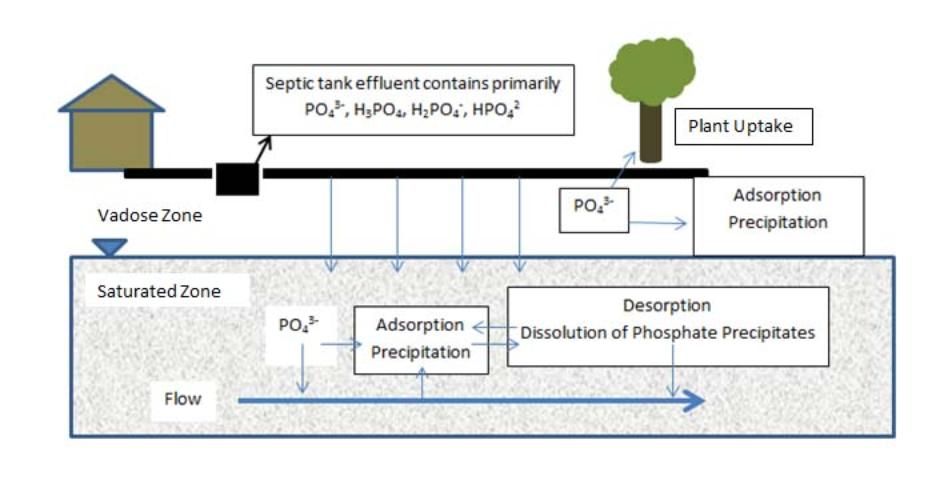
The processes of P adsorption and precipitation are discussed below, and Figure 1 shows a simplified illustration of these processes for septic tank effluent phosphate (PO43-).
Adsorption. Adsorption (or sorption) occurs when P anions bind to soil surfaces. P adsorption occurs on positively-charged particles such as aluminum, iron, and manganese oxides and hydroxides, and clay particles. However, adsorption is limited by the number of available sorption sites (McCray et al. 2005). Organic matter causes contradicting effects on phosphate sorption. For example, organic acids can compete with phosphates for sorption sites on mineral and soil surfaces and decrease phosphate sorption. Certain organic acids can entrap reactive aluminum and iron in stable organic complexes called chelates, thus making them unavailable for phosphate sorption. On the other hand, phosphate can be immobilized by organic carbon as organic-bound complexes, and it is thus removed from solution. Overall, organic soils are not efficient in removing phosphate (Brady and Weil 2008). Brady and Weil (2008) summarize different soil components' capacity for removing phosphate in the following order (from highest to lowest):
-
Amorphous aluminum, iron and manganese oxides; allophane;
-
Crystalline aluminum, iron and manganese oxides;
-
Carbonate minerals;
-
1:1 clays (e.g., kaolinite); and
-
2:1 clays (e.g., montmorillonite).
Because phosphate present in wastewater is an anion (means it has negative charge), it is attracted to positively-charged mineral surfaces present in soils. But the surface charge of many oxide and hydroxide minerals varies with pH because of the addition or loss of hydrogen (H+) ions at surface functional groups on minerals. All minerals have an intrinsic pH value at which their surfaces are balanced by positive and negative charges. This value is called the point of zero charge (or pHpzc). At a mineral's pHpzc, its surface has zero net charge. Below the pHpzc, the mineral has a net positive charge, and above the pHpzc, the mineral's surface has a net negative charge. Minerals with pHpzc values greater than 6–8 are those most likely to develop a net positive charge on their surfaces, which results in phosphate sorption. The minerals most likely to adsorb phosphate and their pHpzc values are shown on Table 6.
Precipitation. Precipitation is the formation of a solid mineral in solution from a chemical reaction. Precipitation is theoretically not limited as long as sufficient aqueous concentrations of mineral components are available and as long as there is space for the mineral to "grow." This process is often considered to be irreversible. However, the reversibility depends on several factors, such as pH, redox (reduction-oxidation) conditions, and the solubility product of P-bearing minerals (Robertson et al. 1998). The solubility product of a specific mineral is a measure of the concentration of the mineral components (ions) in solution required to precipitate the mineral. The more ions available, the greater the chances are for precipitation and for removal of phosphate from soil pore water.
Doyle et al. (2005) measured septic tank effluent components that can precipitate and form phosphate minerals. They found that precipitation of the phosphate mineral hydroxyapatite is very likely immediately after effluent is released to the soil. With further infiltration of effluent into the soil, the soil pore water becomes less saturated with phosphates and calcium, and adsorption becomes a more important phosphate removal mechanism until the effluent reaches the water table.
Robertson and Harman (1999) described the soil environment close to the septic system infiltration pipes (< 1 meter) as the Phosphorus Rapid Transportation Zone because this zone coincides with a biogeochemically active horizon in which mineral precipitation reactions were shown to take place within only a few days. While P removal by precipitation was substantial in this zone, removal was also variable, ranging from 23% to 99%. Similarly, Zanini et al. (1998) found that soil at four septic system sites was P-enriched by a factor of 2 to 4 within 1 meter of the infiltration pipes.
Credit: Mary Lusk, UF/IFAS.
Though P may exist in several organic or inorganic forms in soils, it is usually most practical to study the behavior of P by dividing it into different soil pools, as discussed in Table 4.
Phosphorus Attenuation in Soils
Several researchers have noted the importance of biofilms in attenuating (removing) P transport from septic tank effluent into subsurface soils (Siegrist and Boyle 1987; Magdoff et al. 1974). Biofilms (also called clog zones or clog mats) frequently form at the interface where septic tank effluent meets the sand layer of the drain field. Biofilms help treat effluent by slowing down the effluent flow, distributing effluent evenly in the drain field, increasing the microbial activity, and enhancing sorption, biotransformation, and die-off/inactivation processes leading to effective removal of some contaminants (including P) and some microbes (bacteria, protozoa, and viruses) (Siegrist and Boyle 1987). Magdoff et al. (1974) applied wastewater to test columns and observed a decrease in P concentration once ponding conditions started to occur in the columns. The P concentrations in their sandy loam soil under biofilm conditions were stabilized at 2–6 mg/L, compared with 11–14 mg/L in columns with no biofilm. The total P removal in the biofilm columns was 91% (Magdoff et al. 1974).
Other factors that influence the degree of P attenuation in the soil vadose zone (the unsaturated soil zone above a water table) are those that influence pH and the consequent availability of iron and aluminum cations. For example, calcareous soils—or those with sufficient calcium carbonate (CaCO3) to buffer soil water to near neutral pH values within days or weeks—provide fewer opportunities for P removal than do non-calcareous soils. Because the non-calcareous soils have low levels of CaCO3, they generally have lower pH values and more availability of iron and aluminum to precipitate with phosphate. Thus, the most complete removal of P under septic systems occurs in non-calcareous soils (Robertson et al. 1998).
Septic System Phosphorus in the Groundwater Zone
Mineral precipitation reactions and P adsorption that may attenuate P in the soil drain field are less important once the water enters the groundwater zone. Robertson et al. (1998) evaluated several scenarios in which septic system P could be transported to groundwater. They concluded that P transport from septic systems was minimal (< 0.3 meter/year) in most silt- and clay-rich soils because groundwater velocity was slow (< 10 meter/year) and P retardation factors were high. However, they also noted that phosphate migration on the order of 1 meter/year may occur for permeable sand and gravel soils with high groundwater velocity (20–300 meter/year). The authors noted one exception to this concept; there was a case in which P migration was attenuated in even a sandy soil because of significant soil acidification and consequent P precipitation with aluminum. Thus, non-calcareous (more acidic) soils can be much less vulnerable to P migration compared with pH-neutral calcareous soils (> 1% weight CaCO3 equivalent).
When septic system P reaches groundwater zone, some adsorption reactions can retard P movement if oxygen is present, as in a well-aerated soil. These reactions take place as P is adsorbed by positively-charged sites on mineral surfaces; they appear to be both fast and slowly reversible reactions (Robertson et al. 1998).
Relationship between Septic Tank Effluent Phosphorus and Water Quality
In contrast to nitrate-nitrogen, inorganic P (orthophosphate) readily adsorbs onto soil particle surfaces. This has implications for how P moves from septic systems and enters groundwater or surface water.
Lowe and Siegrist (2008) reported 99% P removal from septic tank effluent percolating through a sandy loam soil. While Zanini et al. (1998) observed that P concentrations were 2 to 5 times higher than background concentrations within 1 meter of drain field infiltration pipes, most of this P was retained by soil via precipitation reactions that occurred rapidly after effluent was discharged in the subsurface soil.
In a study in the Florida Keys, Corbett et al. (2002) found that while the natural P concentration in groundwater was 0.20 mg/L, P concentrations as high as 5.9 mg/L were found in septic tank effluent. This P concentration decreased linearly with distance from the drain field, with values as low as 0.5 mg/L about 57 meters from the drain field. These authors also attributed P attenuation to mineral precipitation and found that increasing the height of the drain field just 1 meter above the ground surface increased retention time to a point where maximum P removal was achieved. They emphasized, however, that even after passing through and well beyond the drain field, P concentration remained higher than the natural background concentration.
Efroymson et al. (2007) asserted that if P travels a distance through soil before reaching a surface water body, a substantial fraction of P will precipitate with iron, aluminum, or calcium or P will be adsorbed by soil (clay) particles. These authors add that water quality impairment by P is most commonly associated with septic systems that suffer from hydraulic failure and that are located adjacent to surface waters.
Even with the above discussion of P attenuation by adsorption in mind, it is important to note that because three distinct soil P pools exist (Table 4), there is always a possibility for subsequent release (desorption) of P from soil. In this case, the P mass could ultimately remain mobile, especially in the decades-long time scales often employed by septic systems (Robertson 2008). Few studies have been undertaken to assess long-term P dynamics under septic systems. Zanini et al. (1998) and Robertson (2008) found field evidence that long-term P attenuation (or movement of P into the fixed pool) was limited to micro-sites (small sites in soil) in the unsaturated soil zones where changing redox (anaerobic and aerobic) conditions promoted rapid precipitation of insoluble P minerals.
In a 16-year study of P dynamics in a calcareous sand, Robertson et al. (1998) found that P fixation could not be relied upon to attenuate P movement to groundwater and surface water. In the absence of an irreversible P attenuation mechanism, P initially adsorbed to soil surfaces could become mobile in the long term and potentially impact nearby water bodies. Much larger setback distances between septic drain fields and surface water bodies may be one way of increasing the chance for strong P adsorption to soil surfaces. For some sensitive lakes already considered to be "at capacity" for P loading, a distance of no less than 300 meters is recommended (Robertson 2008). Some factors that may contribute to increased P concentration in groundwater may include (1) high hydraulic loading rate of wastewater, (2) uneven distribution of wastewater in the drain field, or (3) lack of a clogging zone in the drain field. These factors may result in enhanced P leaching to groundwater.
Studies conducted as part of the total maximum daily load development indicate that septic systems can contribute from 4% to 55% of total P to lakes (Table 5).
Summary
Phosphorus enters wastewater from human wastes, food residues, detergents, and soaps. There is little removal of P in the septic tank. However, P can be attenuated in soil during the disposal stage, when P-bearing effluent is percolated through the drain field. Though soils can retain P, adsorption (fixation of P) may be reversible (i.e., P may be released) during long periods of time, such as those expected for the lifetime of a typical septic system. Generally, the P-fixing capacity of Florida soil is low, as many—though by no means all—of our soils are sandy and have low amounts of clay. Release (desorption) of P and its consequent mobility into adjacent water bodies can lead to water quality impairment. Researchers have noted that in long-running septic systems, P plumes can develop in groundwater with time even though the systems may be working properly (Robertson et al. 1998; Zurawsky et al. 2004). The most commonly recommended means of reducing P transport to surface water is to increase the distance from the drain field to water bodies, thus increasing the chances for P adsorption to soil surfaces.
Consult the following EDIS articles in this series for more information on these topics:
SS549/SL347 - Onsite Sewage Treatment and Disposal Systems: An Overview
SS550/SL348 - Onsite Sewage Treatment and Disposal Systems: Nitrogen
SS552/SL350 - Onsite Sewage Treatment and Disposal Systems: Bacteria and Protozoa
SS553/SL351 - Onsite Sewage Treatment and Disposal Systems: Viruses
SS554/SL352 - Onsite Sewage Treatment and Disposal Systems: Toxic Organic Chemicals
References
Albright, M.F. "Otsego Lake Limnological Monitoring, 1998." 32nd Annual Report, SUNY Oneonta Biol. Fld. Sta., SUNY Oneonta, 1999.
Bowes, M.J., C. Neal, H.P. Jarvie, J.T. Smith, and H.N. Davies. "Predicting Phosphorus Concentrations in British Rivers Resulting from the Introduction of Improved Phosphorus Removal from Sewage Effluent." Science of the Total Environment 408, no. 19 (2010):4239-50.
Brady, N.C., and R.R. Weil. The Nature and Properties of Soils 14th ed. Upper Saddle River, NJ: Pearson-Prentice Hall, 2008.
Corbett, D.R., K. Dillon, W. Burnett, and G. Schafer. "The Spatial Variability of Nitrogen and Phosphorus Concentration in a Sand Aquifer Influenced by Onsite Sewage Treatment and Disposal Systems: A Case Study on St. George Island, Florida." Environmental Pollution 117 (2002):337-45.
Crites, R., and G. Tchobanoglous. Small and Decentralized Wastewater Management Systems. San Francisco, CA: McGraw-Hill, 1998.
Dillon, P.J., K.H. Nicholls, W.A. Scheider, N.D. Yan, and D.S. Jeffries. Lakeshore Capacity Study: Trophic Status - Technical Report. Toronto, Ont.: Ont. Min. Environ.,1986.
Doyle, S., J.E. McCray, K.S. Lowe, and G.D. Thyne. "Modeling Phosphorus Reaction and Transport at an Experimental Onsite Wastewater Site." Proc. of the NOWRA 2005 Annual Technical Education Conference, 2005.
Edwards, A.C., and P.J.A. Withers. "Transport and Delivery of Suspended Solids, Nitrogen and Phosphorus Sources to Freshwaters in the UK." Journal of Hydrology 350 (2008):144-53.
Efroymson, R.A., D.S. Jones, and A.J. Gold. "An Ecological Risk Assessment Framework for Effects of Onsite Wastewater Treatment Systems and Other Localized Sources of Nutrients on Aquatic Ecosystems." Human and Ecological Risk Assessment 13 (2007):574-614.
Florida Department of Environmental Protection (FLDEP) Total Maximum Daily Load for Total Phosphorus for Lake Carlton, Lake County, Florida (March 2004). Accessed February 9, 2023. https://floridadep.gov/sites/default/files/carlton-tp-tmdl.pdf.
Gold, A.J., and J.T. Sims. "Research Needs in Decentralized Wastewater Treatment and Management: A Risk-based Approach to Nutrient Contamination." In National Research Needs Conference Proceedings: Risk-Based Decision Making for Onsite Wastewater Treatment (2001). May 19-20, 2000, St. Louis, MO.
Idaho Water Quality Council (IDWQC) Pend Oreille Lake Phosphorus TMDL (2003). Accessed July 8, 2011. http://www.tristatecouncil.org/programs/lpowatershed.html.
Lowe, K.S., and R.L. Siegrist. "Controlled Field Experiment for Performance Evaluation of Septic Tank Effluent Treatment during Soil Infiltration." Journal of Environmental Engineering 134, no. 2 (2008):93-101.
Lowe, K.S., N.K. Rothe, J.M.B. Tomaras, K. DeJong, M.B. Tucholke, J.E. Drewes, J.E. McCray, and J. Munakata-Marr. "Influent Constituent Characteristics of the Modern Waste Stream from Single Sources: Literature Review." Water Environment Research Foundation. Technical Report 04-DEC-1a, 2007.
Magdoff, F.R., J. Bouma, and D.R. Keeney. "Columns Representing Mound-type Disposal Systems for Septic Tank Effluent: II. Nutrient Transformations and Bacterial Populations." Journal of Environmental Quality 3 (1974):228-34.
McCray, J., K.S. Lowe, M. Geza, J. Drewes, S. Roberts, A. Wunsch, D. Radcliffe, J. Amador, J. Atoyan, T. Boving, D. Kalen, and G. Loomis. "State of the Science: Review of Quantitative Tools to Determine Wastewater Soil Treatment Unit Performance." Water Environment Research Foundation. Technical Report DEC1R06, 2009.
Mueller, D.K., and D.R. Helsel. "Nutrients in the Nation's Waters—Too Much of a Good Thing?" U.S. Geological Survey Circular 1136 (1996). Accessed January 15, 2011. https://pubs.usgs.gov/circ/circ1136/.
Robertson, W.D. "Irreversible Phosphorus Sorption in Septic System Plumes?" Ground Water 46 (2008): 51-60.
Robertson, W.D., and J. Harman. "Phosphate Plume Persistence at Two Decommissioned Septic System Sites." Ground Water 37 (1999):228-36.
Robertson, W.D., S.L. Schiff, and C.J. Ptacek. "Review of Phosphate Mobility and Persistence in 10 Septic System Plumes." Ground Water 33 (1998):1000–10.
Schindler, D.W. "Evolution of Phosphorus Limitation in Lakes." Science 195 (1977):260–2.
Sharpley, A.N., S.C. Chapra, R. Wedepohl, et al. "Managing Agricultural Phosphorus for Protection of Surface Waters: Issues and Options." Journal of Environmental Quality 23 (1994):437–51.
Sharpley, A.N., T. Daniel, T. Sims, J. Lemunyon, R. Stevens, and R. Parry. Agricultural Phosphorus and Eutrophication, 2nd ed. U.S. Department of Agriculture, Agricultural Research Service, ARS–149, 2003.
Siegrist, R.L., and W.C. Boyle. "Wastewater Induced Soil Clogging Development." Journal of Environmental Engineering 113, no. 3 (1987):550-66.
South Dakota Department of Environment and Natural Resources (SD DENR). Phase I Watershed Assessment & TMDL Final Report - Cottonwood Lake/Medicine Creek, Faulk, Hand, Spink Counties South Dakota, 2003. Accessed February 9, 2023. https://danr.sd.gov/conservation/watershedprotection/tmdl/docs/TableDocs/tmdl_cottonwoodall.pdf.
Stewart, J.W.B., and H. Tiessen. "Dynamics of Soil Organic Phosphorus." Biogeochemistry 4 (1987):41-60.
Tjandraatmadja, G., C. Pollard, C. Sheedy, and Y. Gozukara. "Sources of Contaminants in Domestic Wastewater: Nutrients and Additional Elements from Household Products." CSIRO: Water for a Healthy Country National Research Flagship, 2010.
Toor, G.S., M. Lusk, and T. Obreza. "Onsite Sewage Treatment and Disposal Systems: An Overview." University of Florida – IFAS, Gainesville, FL. Accessed July 8, 2011. https://edis.ifas.ufl.edu/publication/SS549.
U.S. EPA. Onsite Wastewater Treatment Systems Manual. EPA/625/R-00/008, 2002. Accessed February 9, 2023. https://www.epa.gov/sites/default/files/2015-06/documents/2004_07_07_septics_septic_2002_osdm_all.pdf.
Utah Department of Environmental Quality (UT DEQ). Pineview Reservoir Phosphorus TMDL, 2003. Accessed February 9, 2023. https://documents.deq.utah.gov/water-quality/watershed-protection/total-maximum-daily-loads/DWQ-2015-006596.pdf.
Wilhelm, S.R., S.L. Schiff, and W.D. Robertson. "Chemical Fate and Transport in a Domestic Septic System: Unsaturated and Saturated Zone Geochemistry." Environmental Toxicology and Chemistry 13 (1994):193-203.
Zanini, L., W.D. Robertson, C.J. Ptacek, S.L. Schiff, and T. Mayer. "Phosphorus Characterization in Sediments Impacted by Septic Effluent at Four Sites in Central Canada." Journal of Contaminant Hydrology 33 (1998):405-29.
Zurawsky, M.A., W.D. Robertson, C.J. Ptacek., and S.L. Schiff. "Geochemical Stability of Phosphorus Solids below Septic System Infiltration Beds." Journal of Contaminant Hydrology 73 (2004):129-43.
Tables
Comparison of total phosphorus concentrations in raw domestic wastewater and septic tank effluent of a single-family residential source.
Phosphorus (P) pools in the soil. Note that P moves from one pool to another, but the movement is slow. At any one time, perhaps 80%–90% of soil P is in the fixed form, and most of the remainder is in the labile form; less than 1% is generally expected to be readily available in soil solution (Brady and Weil 2008).
