Abstract
Whether you’re an angler, diver, conservationist, or just someone that is generally interested in fisheries issues, you’ve likely heard the term “stock assessment” before. Oftentimes this comes in the form of: “The latest stock assessment for [insert species] is out, and it says the stock is ________." The blank is usually filled by one of four common phrases: “overfished and undergoing overfishing,” “overfished and not undergoing overfishing,” “not overfished and undergoing overfishing,” or sometimes “not overfished and not undergoing overfishing.” While these phrases describe important distinctions to fisheries scientists and managers, what they mean and how they are determined is far from obvious. What are stock assessments? How do they work? How do we make management decisions from them? This publication aims to shed light on the process fisheries scientists refer to as a “stock assessment” and intends to provide information to the public, individuals serving in natural resource management agencies, and individuals working in outreach and Extension, so that they may better understand and explain what stock assessment models are and why management agencies use them to make decisions.
What are stock assessments?
The term “stock assessment” is commonly used to describe two things: (1) a quantitative model that estimates fish population size and how it is affected by fishing, and (2), a broader management process whereby the stock assessment model is used, along with other information, to make decisions about fishing regulations and future research. This publication focuses on (1), the stock assessment model itself. We do this because stock assessment models are central to the broader stock assessment management process and because stock assessment model principles are consistent regardless of what the broader stock assessment management process is. For example, state and federal stock assessment management processes often differ, but both will rely on the same principles of stock assessment models. This is illustrated in Figure 1.
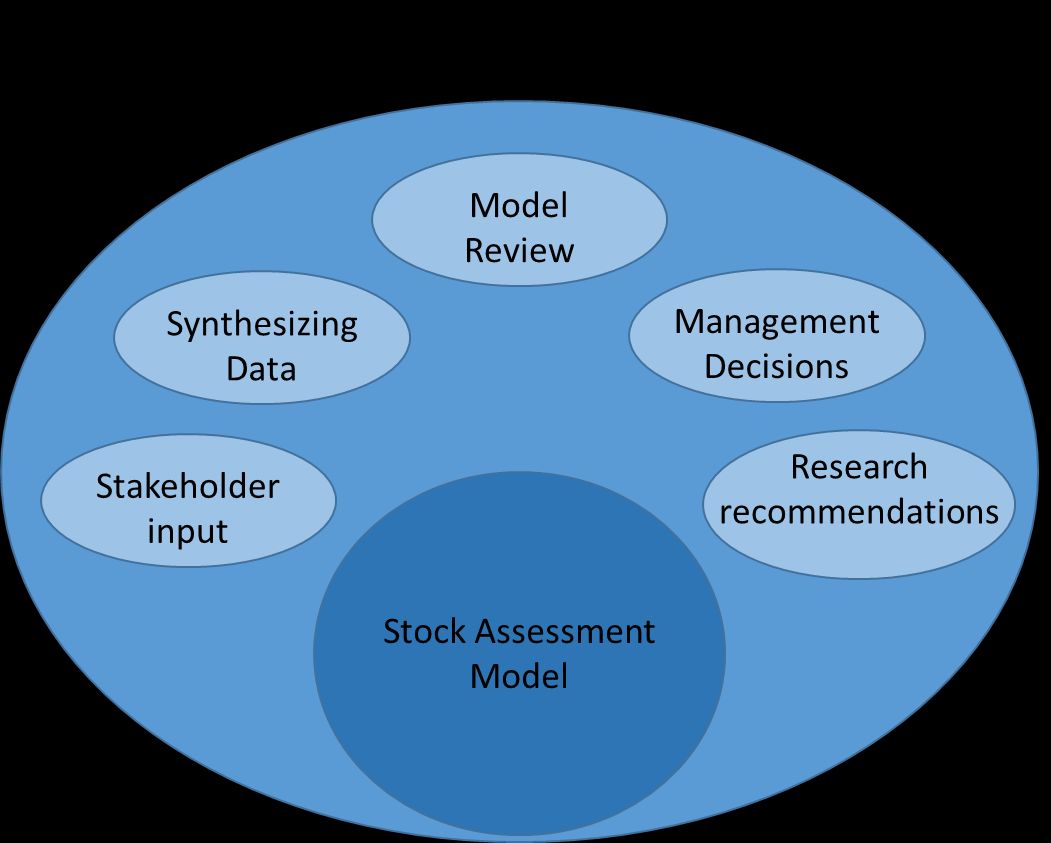
Figure 1. The stock assessment model is part of a broader stock assessment management process that includes other elements such as stakeholder input, synthesizing data, model review, management decisions, and future research recommendations. Which specific elements are included and how they are connected depends on the management process, which can differ between state- and federally managed fish species. However, the stock assessment model principles, which this publication describes, remain the same.
So what are stock assessment models? Similar to the way that meteorologists model hurricane trajectories to predict impacts, fisheries biologists are able to model fish populations to predict their response to fishing (or lack thereof). Stock assessments models are mathematical equations that describe how fish grow, how they reproduce, and how they die. How they die is often the key, because fisheries biologists usually separate out mortality due to natural causes from mortality due to fishing. That way they can tell what the stock might look like without fishing, and how the stock might respond to different levels of fishing. These mathematical representations of fish populations and fishing are fine-tuned or “fitted” to existing historical fisheries data through a statistical process. A stock assessment model is simply a mathematical representation that indicates a fishery’s status, the historical productivity of a stock, and how components of the stock have changed over time. They allow scientists to make the best possible predictions about the effects of fishing on fish populations, and eventually, the most appropriate management actions.
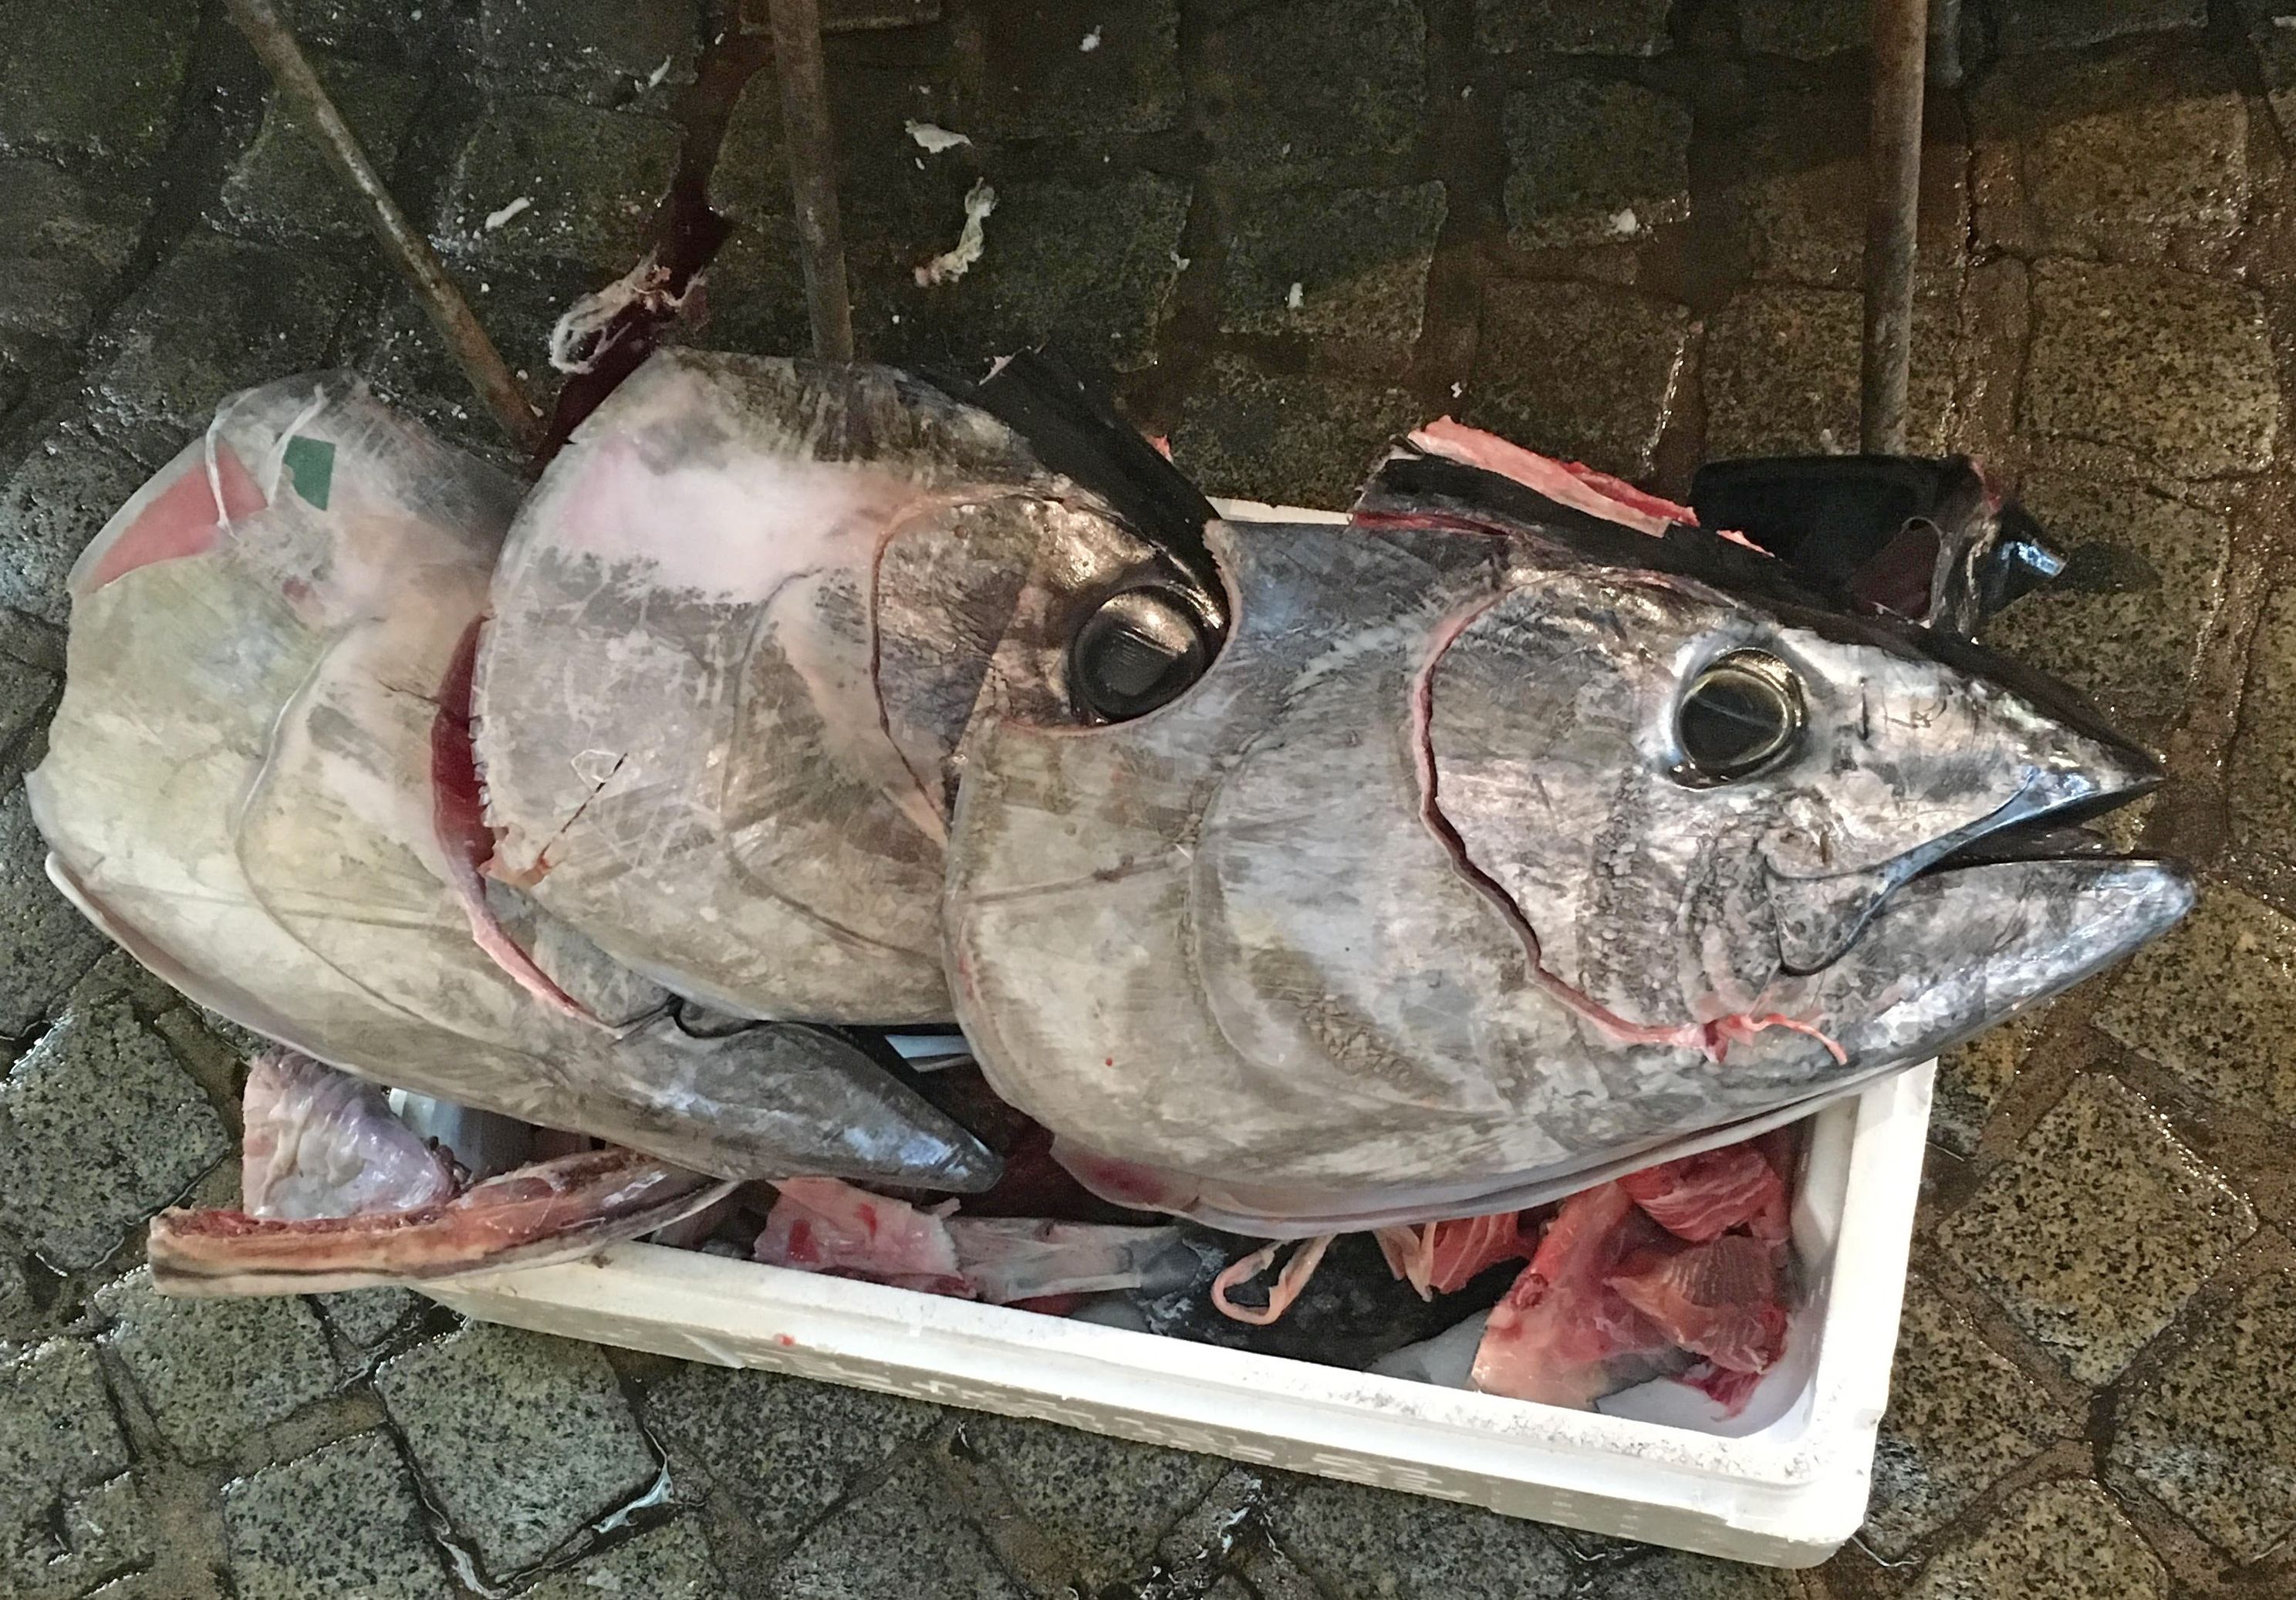
Figure 2. Sustainable fishing depends on stock assessments. Credit: Nicholas Fisch, UF/IFAS
How do stock assessment models work?
Central to any stock assessment is the attempt to estimate the role that fishing plays in affecting (in this case, reducing) the population or “stock” of fish. While to do this, stock assessments will also produce estimates of the total number of fish that are in the stock, the population estimate alone, without understanding the role of fishing, provides little information on how to ensure a sustainable fishery. What scientists most need is an understanding of what proportion of fish being killed by fishing (this is the harvest rate) will allow the population to be sustained at a level that provides socially and economically valuable catch into the future. If the harvest rate is too great, the population of fish will decline and catch rates will eventually fall. A harvest rate much less than a sustainable one might be forgoing revenue or satisfaction from people catching more fish. Sustainable rates of harvest vary across species, depending on biological aspects like how fish grow, die naturally, and reproduce. So this biological information, as well as information about past and current stock or population size (number of fish) is needed to make good recommendations for management. So how do fisheries biologists figure out what these harvest rates, biological rates, and population sizes are?
Assessment scientists use multiple sources of fishery data to model stock status; data on total harvest (or catch), data that indicate how the stock has changed over time (relative abundance data), and data that indicate how components of the population, by age or size, have changed. Relative abundance data often come in the form of catch rates, the most basic being total catch for a year divided by the total effort expended during the year.
Many stock assessments assume that catch rates are proportional to total abundance. This means that if the catch rate in one year was 5 fish per unit of effort and in the following year was 10 fish per unit of effort, the assessment would assume the stock doubled in size. It is important to remember that catch rates give us information on the relative changes in stock abundance, so we might know that the stock doubled in size but we don’t know if this was an increase from 1 million fish to 2 million fish or from 10 million fish to 20 million fish. The stock assessment estimates the absolute scale of the stock by comparing how well model predictions line up with the data (in particular the catch data). This is what is termed a “statistical fitting” process. It starts by making a guess at the total number of fish in the stock, then adjusts this “guess” based on how closely the model predictions of catch, the catch rates, and the catch composition (see paragraph below on catch composition) line up with the actual data. The process is repeated until the statistical fit to data is no longer improved. This is the stock assessment’s “best guess” or most credible representation of the historic population.
Age composition is another major data source that feeds into stock assessments. Most fishery species undergo some level of biological sampling from state and federal management agencies, allowing for the verification of individual fish ages and accurate age and growth curves for specific stocks. Age composition of a stock refers to the proportions of fish in each age class that were caught over the year in a fishery. For example, out of the catch of species “X” within a given year, 19% were age-1 fish, 23% age-2, 24% age-3, 19% age-4, and 15% age-5. Age composition data are particularly powerful because, once the vulnerability of different ages to fishing is corrected for, they provide information on the mortality rates of fish.
Vulnerability to fishing gear refers to the susceptibility of different ages of fish to capture. For example, given the hook size someone is using, they may only catch a narrow size-range of fish (the hook may be too big for the youngest fish and too small for the oldest and biggest fish).
Where harvest data help scale the population size and catch rates provide stock assessments with information on the relative changes in stock abundance, age-composition data provide information on mortality rates of fish, susceptibility of fish at different ages to fishing gear, and the relative scale of different year classes. When put together, these data sources can model a fish population, allowing fishery biologists to examine the effect of fishing on stock abundance and mortality rates. This is what we call stock assessment.
How do we make management decisions from stock assessments?
The overall goal of limiting harvest in fisheries is to ensure enough adult spawning animals are left in the population to replenish the stock and sustain future fishing. This target amount is typically estimated to be between 20%–50% of the unfished stock size (the expected stock size if there were no fishing), although it varies by species depending largely on the natural mortality rate and reproductive output of the stock (Caddy and Mahon 1995; Clark 1991; Goodyear 1993). So, what does it mean if a stock is considered “overfished?” It means the stock size is below this species-specific threshold level, or the stock size is less than the critical level of spawning adults needed to sustain the population over the long term. For example, if a species’ threshold level was set at 30%, we would say the stock is “overfished” if the assessment estimated a spawning stock size less than 30% of unfished levels. Managers may then choose to limit harvest in order to let the stock rebuild to a sustainable level (in this case, above 30%), at which the stock would no longer be considered “overfished.”
The term “overfishing” refers to the specific mortality rate added to the stock by the process of fishing. If a stock is “undergoing overfishing,” it means that if we kept fishing at this level the stock size would eventually cross the “overfished” threshold. This is the reason why a stock can be considered “overfished” but not be “undergoing overfishing,” as is often the case when fishing is significantly regulated to rebuild the stock. Alternatively, a stock could be “undergoing overfishing,” but not be considered “overfished;” if fishing were to continue at the same level, that stock would be expected to become “overfished.”
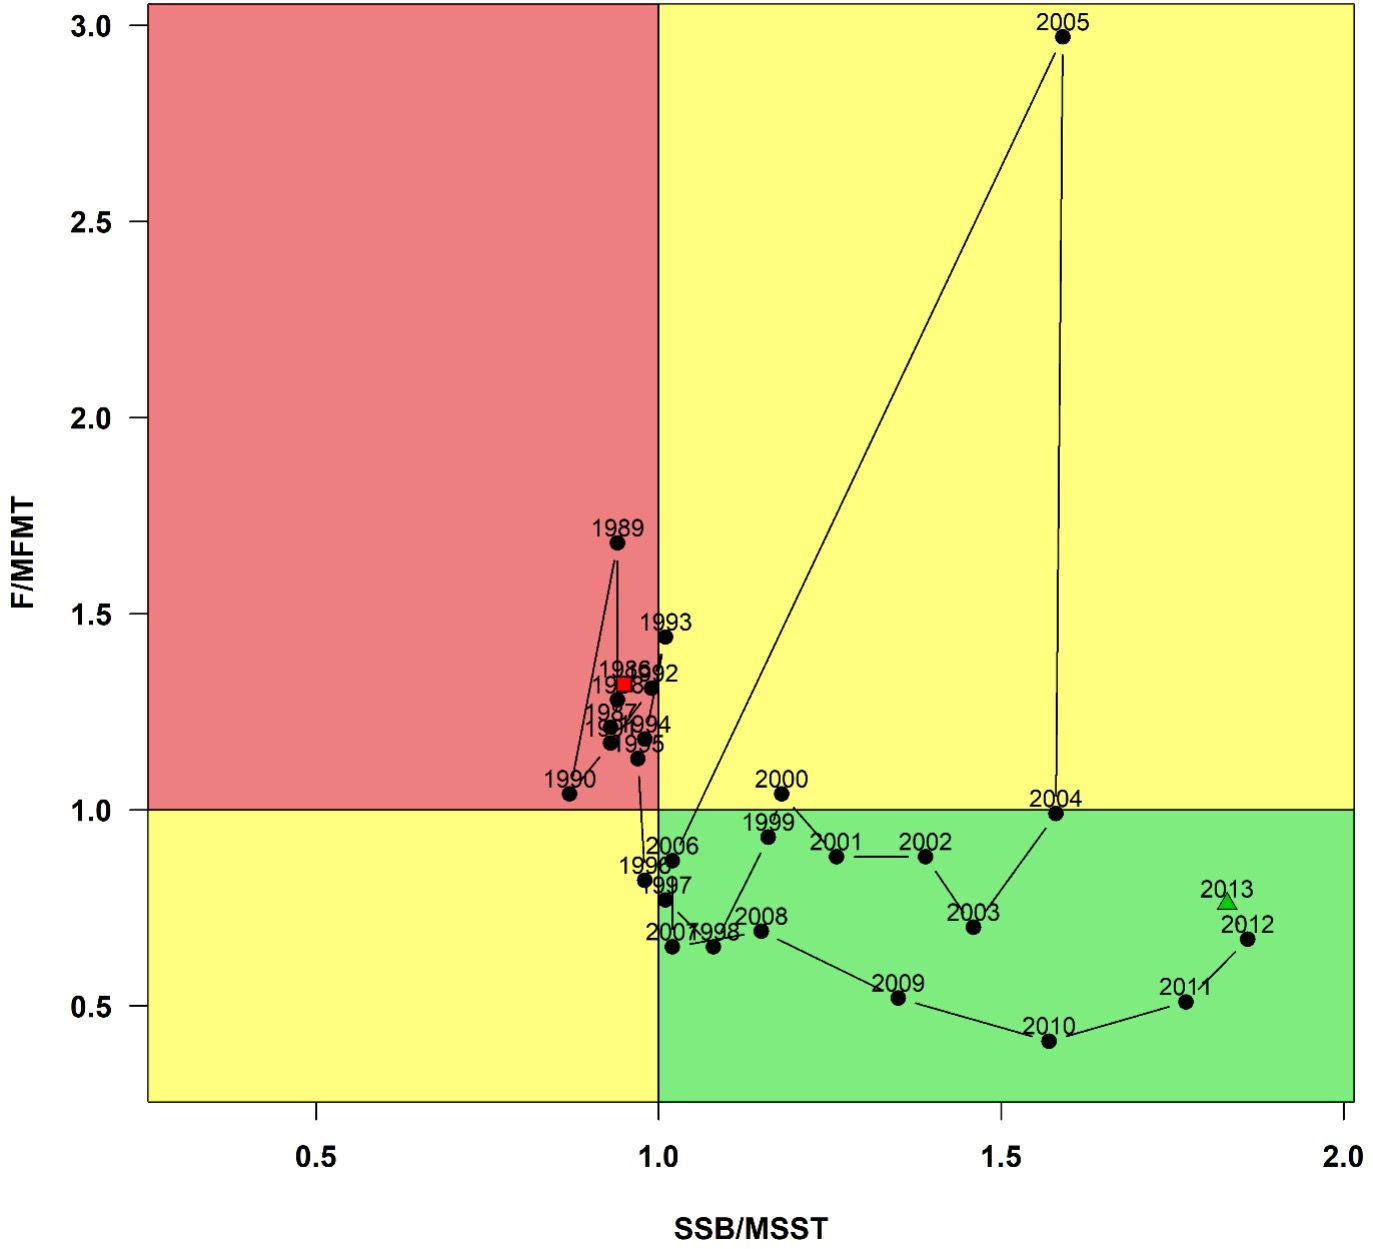
Figure 3. Gulf of Mexico red grouper stock status with respect to fishing mortality (F) and spawning stock biomass (SSB). This is known as a “Kobe” plot, where the ratio between F and the maximum fishing mortality threshold (MFMT) is used to determine whether a population is experiencing overfishing (y-axis) and the ratio of SSB to the minimum stock size threshold (MSST) is used to determine whether a population is overfished (x-axis). The red box (upper left corner) denotes a region where the stock would be considered “overfished and undergoing overfishing;” the green box (lower right corner) denotes a region where the stock would be considered “not overfished and not undergoing overfishing” (a healthy stock); while the yellow (bottom left and upper right) denotes a mix of the two. The red point in the upper left box shows the first assessment year (1986), and green point in the lower right box shows the final year of the assessment (2013). According to this most recent stock assessment (SEDAR 2015), Gulf of Mexico Red Grouper is neither overfished nor undergoing overfishing. Credits: Nicholas Fisch, UF/IFAS
Stock Assessments in Florida
As the “fishing capital of the world,” Florida has an abundance of species and stocks that undergo stock assessment routinely.
State-managed stocks are those found within the Florida state water boundaries (0–3 nautical miles on the Atlantic coast and 0–9 nautical miles on the Gulf coast). All stocks that inhabit waters outside of the state boundary out to the 200 nautical mile exclusive economic zone line fall under federal jurisdiction. For stocks managed by the state of Florida, the Florida Fish and Wildlife Conservation Commission (FWC) has a stock-assessment group that regularly conducts assessments on important Florida fish and invertebrates such as the common snook, red drum, spotted seatrout, striped mullet, stone crab, spiny lobster, etc. Documents describing these stock assessments can be found at https://myfwc.com/research/saltwater/stock-assessments/. Federally managed stocks, which include many reef and pelagic species such as gag grouper, red grouper, and amberjack, are assessed by the National Marine Fisheries Service (NMFS). Documents describing federal stock assessments from the southeast region of the United States can be found at the Southeast Data, Assessment, and Review (SEDAR) website: http://sedarweb.org/sedar-projects. The SEDAR process of stock assessment is meant to be transparent to the public and consists of data, assessment, and review workshops where fisheries representatives can attend and provide comment. Many stocks overlap state and federal boundaries, so management agencies often work together on the assessment process and associated fisheries regulations.
Additional resources online:
https://www.st.nmfs.noaa.gov/stock-assessment/stock-assessment-101
References
Caddy, J. F., and R. Mahon. 1995. “Reference Points for Fisheries Management.” FAO Fisheries Technical Paper Number 347.
Clark, W. G., 1991. “Groundfish Exploitation Rates Based on Life History Parameters.” Can. J. Fish. Aquat. Sci. 48:734–750. https://doi.org/10.1139/f91-088
Goodyear, C. P. 1993. “Spawning Stock Biomass Per Recruit in Fisheries Management: Foundation and Current Use.” In: Risk Evaluation and Biological Reference Points for Fisheries Management, vol. 120. Canadian Special Publication of Fisheries and Aquatic Sciences, edited by S. J. Smith, J. J. Hunt, and D. Rivard, 6781.
SEDAR (Southeast Data, Assessment, and Review). 2015. Gulf of Mexico Red Grouper stock assessment report (SEDAR 42). SEDAR, North Charleston, South Carolina.